mrD-Smart RangesmrD-Smart Ranges aims to offer a complete strategy based on Order Blocks. Ranges signals based on order volume are highlighted, from which smart ranges are suggested to provide potential entries.
This script also includes warnings for each signal marked.
🔶 SETTINGS
Pair Strategy: Select the desired from the list. Change the chart to the one specified in the Strategy.
Current TF Order Blocks: Allows the user to select how many most recent Internal Order Blocks appear in the current time frame on the chart.
Order Block Filter: Allows the user to select how the script mitigates an Order Block.
Hide Overlap: Allows the user to display overlapping Order Blocks.
Show Metrics: Allows the user to display volume % metrics within the Order Blocks.
Show Volume Box: Allows the user to display buy/sell activity within Order Blocks.
High Timeframe: Allows the user to choose a higher or lower timeframe to find the Signals.
Show Failed Buy Sell: Allows the user to display the Signals.
Show HTF Box: Allows the user to display a higher or lower timeframe Order Blocks.
🔶 DETAILS
Order blocks are formed after a slight bearish order block, these can provide an opportunity to change polarity, thus acting as a potential support/resistance level.
A retest/retrace on the order block, combined with order volume between the current timeframe and from the higher timeframe will establish the conditions for smart ranges are suggested to provide potential entries.
🔶 USAGE
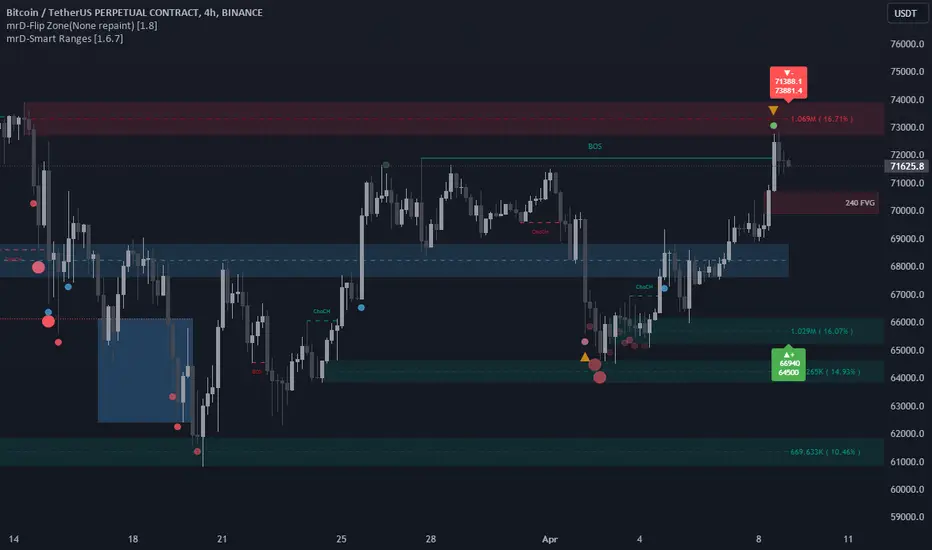
mrD-Smart Ranges aims to provide users with a minimalistic screen next to the optimal ranges to keep in mind to find trading setups as shown below.
Here we can see a suggested Sell range and display a label to confirm this range
Signal(s) that can be used for potential entries only during range retest are order blocks.
Users can search for more potential entry ranges based on larger timeframes in the settings: High Timeframe
In the image above, we can see that the price has generated potential orange and bearish entry signals. A confirmation signal with a red label is displayed on the chart when the price retests the Sell range.
Note: While range retests can still work well if they occur later in price action, it's best to look for signals only when price retests the range at the outset rather than retesting it. second price.
The logic of generating signal ranges using different rules is described below:
- Define order blocks in the current timeframe.
- Define the order blocks with the largest volume in the current timeframe.
- Define order blocks in larger timeframes in High Timeframe settings
- Define order blocks with the largest volume in larger timeframes in High Timeframe settings
Entry Range: The combination of the highest volume order blocks in the current timeframe and the highest volume order blocks in the larger timeframe.
🔶General disclaimer:
Trading stocks, futures, forex, options, ETFs, cryptocurrency, or any other financial instrument has huge potential rewards and risks.
You must be aware of the risks and willing to accept them to invest in stocks, futures, forex, options, ETFs, or cryptocurrencies.
Don't trade with money you can't afford to lose.
This is not an offer or an offer to Buy/Sell stocks, futures, Forex, options, ETFs, cryptocurrencies, or any other financial instrument.
Do not represent that any account will or is likely to achieve profit or loss of any kind.
The past performance of any trading system or method is not necessarily indicative of future results.
My Scripts/Indicators/Ideas/Algos/Systems are only for educational purposes!
Signals
RottenZero JMET Buy & Sell Signal”RottenZero JMET Buy & Sell Signal" is a custom indicator designed to help traders identify potential buy and sell signals in the market by unifying multiple indicators into a single tool.
(J(JMA)+M(MACD)+E(EMA)+T(Trend))
This was inspired by YouTube videos that showcased trading strategies using separate indicators.
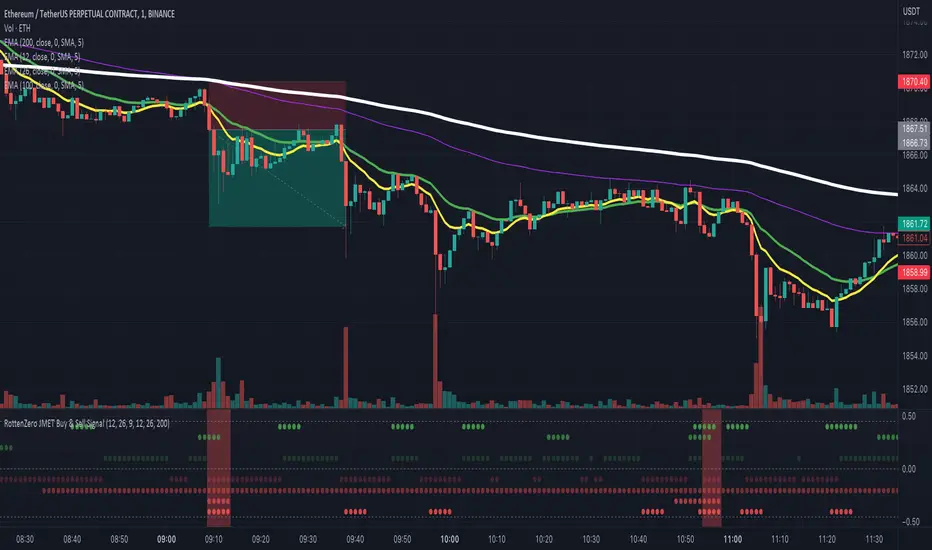
The indicator combines the Jurik Moving Average (JMA), Moving Average Convergence Divergence (MACD), and Exponential Moving Averages (EMA) into a concise visual representation using circles and background colors.
The indicator plots various events as circles with varying opacity levels, which helps visualize the strength of the signals.
It also changes the background color to green for a long signal and red for a short signal, indicating potential buy and sell signals, respectively.
Here's some examples:
(Please note that signals are not always accurate and should be used as a reference in your trading decisions, rather than relying solely on them.
It's essential to use proper risk management and incorporate other aspects of technical and fundamental analysis to make well-informed trading decisions.)
I hope this unified indicator proves to be a valuable tool in your trading.
-----
(KO)
"RottenZero JMET Buy & Sell Signal"은 여러 지표를 하나의 도구로 합쳐 잠재적인 매수 및 매도 신호를 파악하는 데 도움이 되도록 설계된 인디케이터입니다.
(J(JMA)+M(MACD)+E(EMA)+T(Trend))
이 인디케이터는 별도의 여러 지표를 사용한 거래 전략을 보여주는 YouTube 동영상에서 영감을 얻어 더 편하게 사용하기 위해 만들게 되었습니다.
지표는 Jurik 이동 평균 (JMA), 이동 평균 수렴 발산 (MACD), 지수 이동 평균 (EMA)을 원형 및 배경색을 사용하여 심플하게 보이도록 했습니다.
지표는 다양한 투명도 수준의 원으로 이벤트를 표시하여 신호의 강도를 시각화하는 데 도움이 됩니다.
또한 배경색을 Long 신호의 경우 초록색으로, Short 신호의 경우 빨간색으로 변경하여 잠재적인 매수 및 매도 신호를 나타냅니다.
(신호가 항상 정확하지는 않으므로, 이를 거래 결정에 대한 참조로 사용하고 전적으로 의존하지 마시길 바라며,
적절한 리스크 관리와 기술적이고 기본적인 여러 근거들을 포함하여 신중한 거래 결정을 내리시기를 바랍니다.)
이 인디케이터가 거래하실 때 도움이 되시기를 바라겠습니다.
No Code SignalsNo Code Signals is an intuitive user interface for users to generate their own signals based on indicators they already have applied to their chart.
This indicator makes use of the new input.source() limits for importing data from external sources (indicators) into 1 indicator.
You are now able to import ANY number of sources from up to 10 different indicators.
Features:
- Import up to 10 unique values from up to 10 different indicators already on your chart!
- Compare those values against other imported indicator values, or chart ohlc values.
- Option to use a defined level instead of an active source.
- 5 Signal Options (Currently)
- Alerts, Each signal has its own alert condition.
- Labeled Signals, to tell which signal is which.
Potential Future Plans:
- More Signals & Analysis Options
- Possibly more imports
- Combining 2 (or more) signals into 1
Here is a Screenshot of a chart with signals, and the Interface creating the signals.
Enjoy!

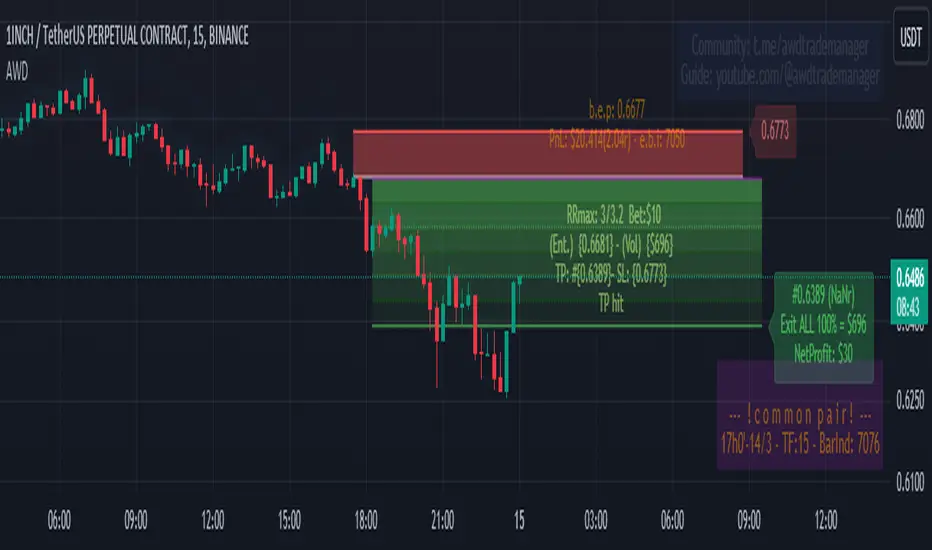
AWD TRADE MANAGER (ATM) by ManhDNAWD TRADE MANAGER (ATM) is a position management tool including with some advanced features and entry suggestions. It helps you to do most of position calculations and position management, reduce time spent for charting by alerts.
There are 3 main things to describe about the manager:
(1) The original function of the manager is to help traders to manage their trades with automatic calculations of all factors of their trades with some of input values. For example, it will calculate the trade volume when you enter the bet size, entry and stop loss price. It calculates take profit price when you enter entry, stop loss prices and the risk/reward ratio, …
(2) Another function is the system of alerts. After set up a trade, create an alert and the manager will do the rest. It will send you an alert when the limit order got filled, got stopped out, take profit level hit, or even it reached a key level or an opposite/spike move just occurred…
(3) Entry suggestions: Suggest entries with price action strategies. Details bellow.
Features in details:
(1) Automatic calculations:
- Auto calculate trade volume based on entry, stop loss prices and the money users willing to lose when the trade is failed. Auto detect some type of assets and volume will be calculated in USD (for cryptocurrencies) or in lot (for forex).
- Auto calculate take profit price based on entry, stop loss prices and expected rr ratio.
-Auto suggest take profit price based on pivot points.
- Auto suggest stop loss price based on pivot points.
- You can enter several exit points with percentages and the manager will calculate the averaged risk reward ratio you earned after the last exit price reached.
- Quick entry price pick to reduce typing requirement.
- Quick trade set up: 2 checkboxes and 1 number entering to set up a trade.
(2) Alert system
After setting up a trade and creating an alert of the manager, it will follow the market and your order. It will send you alerts for all the events that you should follow up your position. These alerts can be sent to your pc, your phone and your smart watch, so even you are a full-time day trader, you will save your time for charting or managing your positions. Here’s the list of alerts:
- Sending alert when suggesting an entry with details calculated from preset inputs so you can just pick that info to enter the position including trading volume, entry, stop loss, take profit prices, timeframe, estimated risk-reward ratio …
- Sending alert when a limit order got filled and auto switch to position-managing-mode.
- Sending alert when a limit order in still staying unfilled but should be canceled (because of price reaching a key level or is running too far, …)
- Sending alert when the position got stopped out or TP hit.
- Sending alert when the running position reached a key level and need to be watched out.
- Sending alert when a spike move or opposite move just occurred.
- Sending alert when a position is taking too long to run.
- You can also set 3 levels of price with messages then ATM will send you alerts when price reaches those levels.
- When price runs, ATM might suggest you to move stop loss to levels based on pivot points by sending you alerts.
- Alert when a BOS occurred.
- Options to turn on/off each kind of alert.
(3) Entry suggestions.
The script included price action entry suggestions.
The 1st strategy is getting in a position when a candle pattern occurred and confirmed by MA20.
The 2nd strategy is detecting double top/bottom and a candle pattern confirm break out after that.
The 3rd strategy is a pullback strategy, in a trending market, a candle pattern occurs and confirms the pullback ends, it will suggest an entry.
All those strategies I am using by myself for a long period of time but to make sure they are good for your trading style, do your own research and backtest before use. Keep in mind to manage risk and be responsible to your capital.
User side modifications:
- Those price action strategies have some major arguments that users can tune themselves to make it meet their style or their needs like choosing method to suggest entries, refine entry quality by changing the confirmation methods,…
- Most of appearance factors can be changed by users.
- one-click to toggle between full features and simple mode.
TradingView Chart demo pictures:
Author's bio:
I have been a full-time day trader for 7 years. I like coding with Pinescript and I also developed some helpful indicators that provide unique aspects to approach markets and the most favorite one from that is Relative Volume Index (RVI) that will be introduced in near future.
Disclaimer:
This tool has been tested and been using for my own trading career for a long period of time but practicing to use it yourself to understand it and use it correctly is needed. All of the features have been carefully tested before publishing but make sure to double-check all the info you get from it before getting into a trade to avoid losing money by a sudden mistake or even a bug. Keep in mind you will need to take all the responsibility with your capital or any potential loss while using this tool.
If you get anything wrong while using it, please leave some comments bellow, all of your ideas or suggestions will be taken seriously.
Thank you in advance!
(It is not possible to explain all the settings or features within the description, If you have questions, please leave comment, I will answer to help you to get familiar with the tool.)
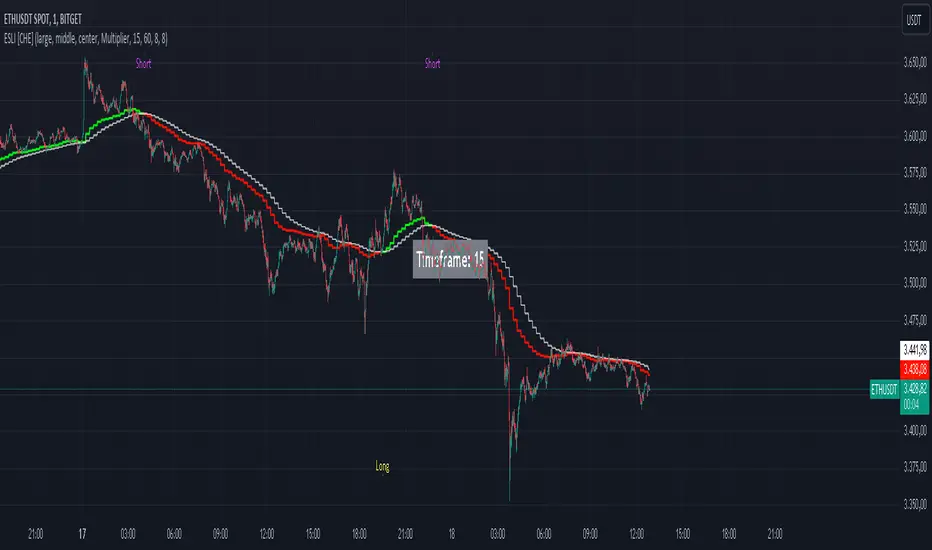
Ema Short Long Indicator[CHE]█ CONCEPTS
This Pine Script is an EMA Short Long indicator that displays the crossing EMA lines on the chart. The indicator uses three exponential moving averages (EMAs) to generate the buy and sell signals. The EMA lines are plotted as green (uptrend) and red (downtrend) lines. When the green line is above the white signal line, the indicator generates a buy signal, when the green line is below the white signal line, the indicator generates a sell signal. Arrows are also displayed marking the buy and sell signals. There is also an option to allow indicator repainting or not. Finally, users can also set alerts to be alerted to potential trading opportunities.
Note: please do not disable "time frame gaps". Allows to calculate the indicator on a Timeframe (TF) different from that of the chart Time window. The TF should ideally be higher than the charts to provide a broader perspective than
the TF of the chart. Using TFs lower than the chart's will deliver fragmentary results, since only the last value of intrabar is displayed (multiple values cannot be displayed for a single chart bar). The Gaps setting determines the behavior when the TF is higher than the TF of the chart. If 'gaps' is checked, higher TF values only come in and are interconnected on the diagram when the higher TF completed. This has the advantage of avoidance Real-time epainting. If Gaps is not enabled, Gaps are filled with the last higher TF value calculated, which will not produce a repaint Values on historical bars but repaint values realtime.
█ HOW TO USE IT
Load the indicator on an active chart (see the Help Center if you don't know how).
Time period
By default, the script uses an auto-stepping mechanism to adjust the time period of its moving window to the chart's timeframe. The following table shows chart timeframes and the corresponding time period used by the script. When the chart's timeframe is less than or equal to the timeframe in the first column, the second column's time period is used to calculate the Ema Short Long Indicator :
Chart Time
timeframe period
1min 🠆 1H
5min 🠆 4H
1H 🠆 1D
4H 🠆 3D
12H 🠆 1W
1D 🠆 1M
1W 🠆 3M
█ DESCRIPTION
The script begins by setting up the chart indicator with a short title, "ESLI", and enabling it as an overlay. It then initializes several variables for time conversions, to be used later in the script.
The timeStep_translate() function converts the timeframe of the chart into a string representing a larger time interval, based on the number of seconds in the timeframe. The resulting string is used to label the horizontal axis of the chart.
Next, the script defines several input variables that can be modified by the user. These include the colors of the EMA lines and the signals, whether or not the indicator is allowed to repaint (i.e. update past values based on future data), and the number of periods used to calculate the EMA and signal lines.
The f_security() function calls the request.security() function to fetch data from the specified security and timeframe, and is used to calculate the EMA and signal lines using the ta.ema() function. The clo variable is assigned the closing price data, adjusted for repainting and timeframe.
The EMA line is calculated using a weighted average of the EMA over the specified period and two times that period, as well as three times that period, divided by six. The signal line is calculated as the EMA of the EMA line over the specified period.
The col_css variable sets the color of the EMA line based on whether it is currently above or below the signal line. The script then plots the EMA and signal lines, and uses the plotshape() function to indicate long and short signals based on the crossovers and crossunders of the EMA and signal lines.
Finally, the script sets up alert conditions using the alertcondition() function to notify the user when a long or short signal is generated, including information about the symbol and closing price.
█ SPECIAL THANKS
Special thanks to LOXX, I wanted to take a moment to express my gratitude for his valuable input in the EMA calculation. His insights and expertise have greatly helped me in improving my Pine Script coding skills. Thanks to his suggestion, I was able to better understand the EMA formula and implement it effectively in my script.
Your generosity in sharing your knowledge and experience is truly appreciated. It is through collaboration and exchanging ideas that we can all grow and become better in our craft.
This script provides exact signals that, with suitable additional indicators, provide very good results.
Best regards
Chervolino
Swing BoxesHey, folks!
Sorry for not posting anything for such a long time. Don't have enough ideas and resources to get inspiration, so trying to brainstorm good stuff in my free time from university studies.
But despite my absence more I now have 300+ people subscribed to me! Thanks, guys, for keeping interest for my work, as I still do value each boost on my script, for real :)
So here is new script , enjoy!
Swing Boxes is pretty simple indicator, which plots signals with "boxes", that help you determine price targets.
What is the idea behind?
I wanted to make indicator, that could help me make swing trades with nice accuracy (as all we want, lol), and for signal criteria I decided to use highs and lows of the price . Then I started coding some ideas to see which of them could be worthy. And, actually, Swing Boxes appeared to be good. But the thing is, that I didn't intend to build them, they appeared as an anomaly from my code :)
I started to explore this anomaly (it looked super cool, but was repainting hard) to fix it and I succeeded, now Swng Boxes don't repaint.
The main idea is that when price goes above it's highest value of p-bars back or below it's lowest value p-bars back, then there is a some god probability, that price will continue to follow current direction.
And the things about Swing Boxes is that when there is a good trend movement, the boxes become super small to track price movement and when price breaks out in the counter-trend direction, then you will be able to almost perfectly catch a top or a bottom! But most of the signals won't be so high-quality, so don't think that is this some holy grail to trade swing-trading, because it is not.
Signal logic
Quick hint:
- epsilon(variable e ) = ATR * ATR_Factor . It is used to determine box's sensitivity to price changes.
If previous close is higher than variable, which contains previous HIGHEST value (variable h in the code), then update the this variable by taking up-to-date highest value and add epsilon( e ) to it;
If previous close is lower than variable, which contains previous LOWEST value (variable l in the code), then update the this variable by taking up-to-date lowest value and substract epsilon( e ) from it.
Variables decribed above ( h and l ) are box's top and bottom respectively, so if price cross them, it is logical to update it is value.
Settings and what is what
Swing Box Period - numbers fo bars in the past to find highest and lowest price from. The bigger the input, the bigger the boxes will be;
ATR Period;
ATR Factor - multiplier for ATR, determines sensitivity for price changes. The bigger this input, the more accurate signals will be, but less the probability that the signal will be on the top or a bottom.
Show Boxes? - when chosen, plots box's top and bottom. Used to determine price targets.
Show Baseline? - when chosen, plot's baseline, which midline between box's top and bottom.
How to use?
This indicator plots green and red triangles by default.
- Green triangle --> Buy ;
- Red triangle --> Sell ;
As I've said before, many signals from indicator will probably be garbage, so you need to tune settings for youself, so it could satisfy you .
You can enable showing boxes to see box's top and bottom. Box's bottom --> your entry, top --> your profit target.
If you find a way to sort bad signals, you will be able to trade with super cool RR, because the signal from Swing Boxes appear to be a good one, there is almost 95% probability, that price will not even come close to your stop loss, so you can trade with super small stop-losses! Smaller stop-loss --> smaller risk --> smaller loss --> bigger profit, it is that easy.
Also you can enable baseline to use at as your 1st TP, and box's top/bottom as 2nd TP, closing 25% on TP1 and the rest on TP2 (but that is just mine recommendation, you can use different RM (risk-management), if you want).
Also you can use baseline as your S/R (Support/Resistance) line, test it out on your charts.
And please, hear me out: as all other indicators out here on the TradingView, Swing Boxes ARE NOT meant to be traded in solo! Many bad signal can go in a row, so PLEASE find your way to filter out bad signals with other indicators.
You can see here the example of a garabge-class signal in a row, so be don't be deluded!
I do hope that somebody will suggest and idea to improve this thing, as I personally don't have enough time to think about it because of my university studies, but I will probably try it make this thing better throughout the time.
And that's it for now, folks! If you have any ideas for scripts, strategies or anything else, feel free to DM me or leave a comment, I will check it.
Hope you will find this script useful.
Take your profits!
- Tarasenko Fyodor

Stock Intrinsic Value & MOS IndicatorStock Intrinsic Value and MOS Indicator is a powerful tool that can help investors to evaluate the potential value of a particular stock. By taking into account key financial metrics such as earnings per share, price-to-earnings ratio, and dividend yield, this indicator provides a comprehensive analysis of a company's fundamentals, and can be used to estimate its intrinsic value.
To use this indicator, simply input the relevant financial metrics for the stock you're interested in from Yahoo finance, including the P/E ratio, earnings per share, and dividend yield. The indicator will then calculate the stock's intrinsic value based on these inputs, taking into account the company's earnings potential and dividend payments.
In addition to calculating the intrinsic value, the Stock Intrinsic Value and MOS Indicator also allows investors to add a margin of safety to their analysis, which can help to account for unexpected market events or uncertainties. By adding a margin of safety of 20% - 30%, for example, investors can ensure that they are buying the stock at a significant discount to its intrinsic value, providing a cushion against potential losses.
Using the Stock Intrinsic Value and MOS Indicator can be a valuable tool for investors looking to make informed decisions about their investments. By taking into account key financial metrics and adding a margin of safety, investors can be more confident in their investment decisions, and can potentially maximize their returns over the long-term.
However, it's important to remember that the Stock Intrinsic Value and MOS Indicator is just one tool among many that investors can use to evaluate potential investments. As with any investment strategy, it's important to conduct thorough research and analysis before making any investment decisions. Additionally, it's important to keep in mind that no investment strategy is foolproof, and that even the most well-informed investment decisions can still result in losses.
Overall, the Stock Intrinsic Value and MOS Indicator can be a valuable tool for investors looking to evaluate potential investments and make informed decisions about their portfolio. By using this indicator in combination with other tools and strategies, investors can potentially maximize their returns and achieve their long-term investment goals.

Click Signal IndicatorThis is a Signal Indicator that emits signals based on mouse clicks when the indicator is added to the chart, or later on in the "Settings/Inputs" tab by changing/selecting the open time of the desired bar of each one of the signals.
It is designed to be used as an External Input for the "Template Trailing Strategy" to verify the correctness of the features the aforementioned script offers, and to provide an easy way to play around with this framework.
Last but not least this script offers a way to debug and report problems when this is necessary. Moreover, this script is a simple example you can copy-paste and create your own custom signal indicator that can be "plugged into"
the "Template Trailing Strategy" taking advantage of all the fancy stuff the TTS framework can provide!
To connect this signal indicator to the TTS you have to change the "Deal Conditions Mode" to '🔨External' and the 'External Input 🛈➡' to 'CSI:🔌Signal' in the TTS "Settings/Inputs" tab. For more information check the "Template Trailing Strategy - Part 02" video tutorial.
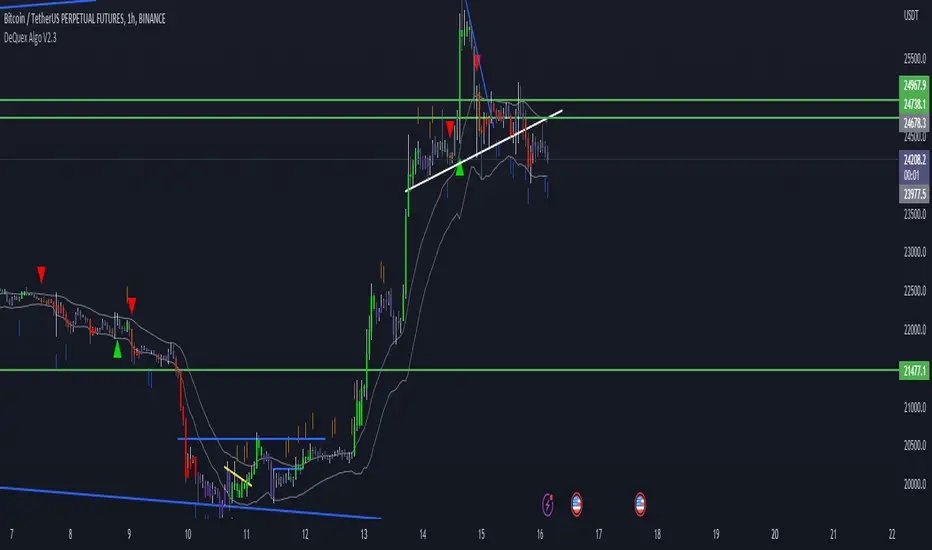
DeQuex Algo V2The DeQuex Algo V2 script is an advanced technical analysis tool that provides traders with a powerful set of features to help them identify potential trading opportunities in the market. The script is based on the widely used Moving Average Convergence Divergence (MACD) indicator, which is known for its ability to identify changes in trend direction.
The script has several input parameters that can be customized to meet the specific needs of each trader. This flexibility makes it a great tool for traders of all skill levels, from beginners to advanced traders. By adjusting the input parameters, traders can fine-tune the script to their preferred trading style and risk tolerance.
One of the key features of the DeQuex Algo V2 script is its ability to generate buy and sell signals based on MACD crosses. These signals are generated when the MACD line crosses above or below the signal line, indicating a potential change in trend direction. The script also includes options to display trend signals, which can be helpful in identifying the strength of the current trend.
In addition to the MACD indicator, the script also includes a dynamic support and resistance level calculation based on the basis and deviation of the price, as well as volume trend analysis using On Balance Volume (OBV). These features can be used to identify key levels of support and resistance, as well as determine the overall trend direction of the market. This information can be used to make more informed trading decisions and improve the chances of success in the market.
Overall, this script is powerful tool that can be used to help traders identify potential trading opportunities in the market. By using this script in conjunction with other technical analysis tools and fundamental analysis, traders can make more informed trading decisions and increase their chances of success.
Here are the main features of the script:
Moving Average Convergence Divergence (MACD) indicator: The script is based on the MACD indicator, which is widely used by traders to identify changes in trend direction. The script generates buy and sell signals based on MACD crosses, indicating potential changes in trend direction.
Customizable input parameters: The script has several input parameters that can be customized to meet the specific needs of each trader. This includes the sensitivity of the MACD indicator, the source of the price data, the smoothing period, the type of moving average to use, and the display options for trend signals and price bars.
Trend signals: The script includes options to display trend signals, which can be helpful in identifying the strength of the current trend. This can help traders determine whether to enter a trade or wait for a better opportunity.
Dynamic support and resistance levels: The script includes a dynamic support and resistance level calculation based on the basis and deviation of the price. This can help traders identify key levels of support and resistance, which can be used to determine potential entry and exit points.
Volume trend analysis: The script uses On Balance Volume (OBV) to determine the volume trend in the market. This can be used to identify potential changes in trend direction and to confirm the strength of the current trend.
Alert system: The script includes an alert system that can notify traders when a buy or sell signal is generated. This can be helpful for traders who are not able to monitor the market at all times.
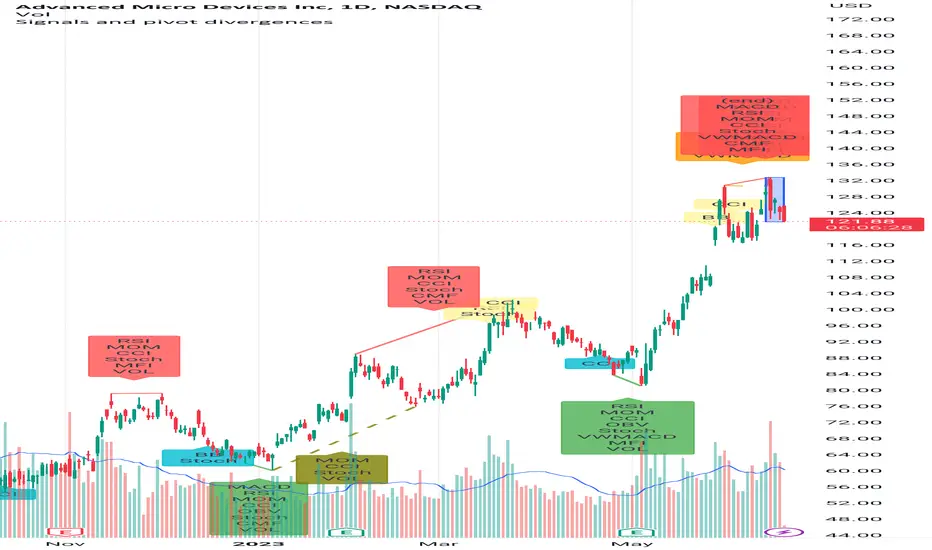
Signals and pivot divergencesScript that shows buy and sell signals for multiple indicators and divergences when there's a pivot in the price chart. The defaults are from my own laboration and don't hesitate to share your settings!
Best of trading luck!
Volume Directional OscillatorVolume Directional Oscillator is an indicator that combines several types of metrics for a convenient understanding of price movements.
The indicator displays a histogram of red, dark red, green, dark green and yellow columns, as well as a red-green line.
Red columns indicate an increase in selling volumes as the price moves.
Dark red indicates a decline compared to the previous candle.
Green indicates an increase in buy volumes.
Dark green indicates a decline from the previous candle.
Yellow columns appear when the market moves without volume, in other words, by inertia.
The red-green line passing through the tops of the columns indicates that buyers or sellers currently prevail. Green are buyers and red are sellers.
It is also possible to display overbought and oversold levels. By default, they correspond to the values 50 and -50. When the indicator goes beyond one of the levels, the background turns orange. Line and background colors can be changed in the settings.
Also, the indicator can be used to determine divergences and convergences and use them in a trading strategy.
-------------------------------------------
Volume Directional Oscillator - индикатор осциляторного типа, который объединяет в себе несколько видов показателей для удобного понимания движения цен.
Индикатор отображает гистограмму из красных, темно-красных, зеленых, темно-зеленых и желтых полос, а также красно-зеленую линию.
Красные полосы обозначают увеличение объемов на продажу по мере движения цены.
Темно-красные обозначают снижение, по сравнению с предыдущей свечой.
Зеленые обозначают увеличение объемов на покупку.
Темно-зеленые обозначают снижение, по сравнению с предыдущей свечой.
Желтые полосы появляются, когда движение рынка происходит без объёма, другими словами — по инерции.
Красно-зеленая линия проходящая через вершины полос указывает на то, покупатели или продавцы в данный момент преобладают. Зеленая — покупатели, а красная — продавцы.
Еще есть возможность отобразить уровни перекупленности и перепроданности. По умолчанию, они соответствуют значениям 50 и -50. Вы выходе индикатора за один из уровней, фон окрашивается в оранжевый. Цвета линий и фона можно изменить в настройках.
Также, по индикатору можно определять дивергенции и конвергенции и использовать их в торговой стратегии.

Negative Correlation SignalsThank you to Hendrik Fuchs who coded this for me - I highly recommend you...
The AUDUSD/EURUSD has a negative correlation with the DXY as does the GBPJPY/USDJPY have with the JPYX. This indicator is very simple and uses opposite candle pinbars (pinbar/doji structure can be set by you) of the two instruments on the chart whilst the stochastic RSI should be above 80 for overbought on the one but below 20 on the other for oversold (or vice versa) to generate a signal.
This indicator works as follow:
1. Choose an instrument that has an opposing negatively correlated instrument (EURUSD & DXY, GBPJPY & JPYX, US100 & VIX, etc.)
2. Add indicator to the chart and open settings.
3. Open the settings and add the correct instruments (default is set to GBPJPY & JPYX).
4. Enter your desired Stochastic RSI & candle formation settings.
You will see buy and sell signals appear on the charts. Alerts are possible (Any alert() function call). Does not repaint after close of candle. Better on higher timeframes but can also be used for scalping. Best used as confluence or as part of a trend trading system.
There are obviously many many variations that I have not even thought off - please let us know in the comment section if you find settings/timeframes/instruments that work particularly well.

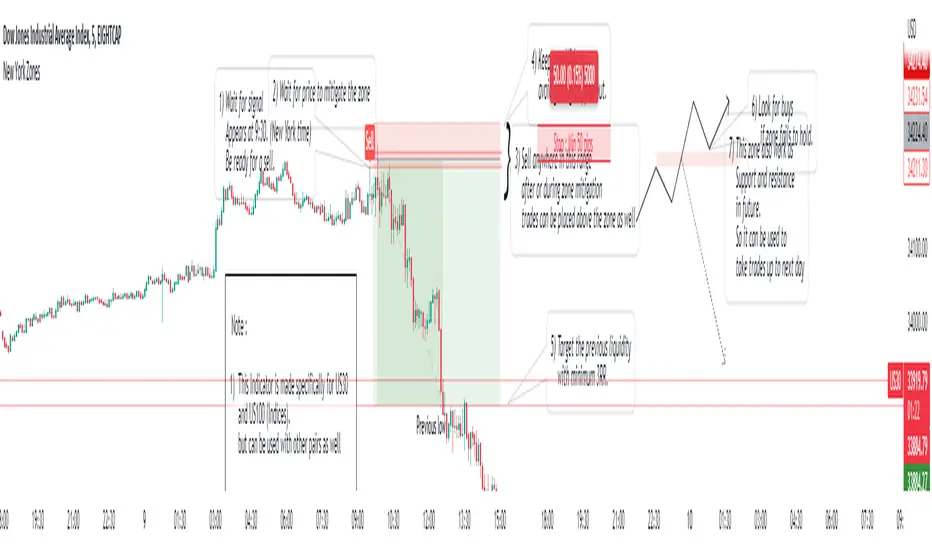
New York ZonesHello traders, here is a indicator which is based on a strategy I found on a forum. I hope you will find it useful.
Rules to Follow:
1) Wait for signal . Signal appears at 9:30. (New York time)
2) Wait for price to mitigate the zone
3) Sell anywhere in this range after or during zone mitigation.
4) Keep stop Wide to avoid getting stopped out.
5) Target the previous liquidity with minimum 3RR.
6) Look for opposite trade if zone fails to hold , with proper analysis
Note :
1) This Indicator is made specifically for US30 and US100 (Indices) but can be used with other pairs as well (need back testing)
2) I would not recommend to place the trade right away as soon as signal appears , wait for liquidity to be taken out and place a trade after confirmation.
3) Trades can be placed below the zone as well but the probability of entry may decrease ,while increasing the accuracy.
4) Use timeframe <= 5 min to take entries.
Trade scenarios
Perfect trade :
Price failed to hold, you got stopped out and market changes direction :
Price respect zone in future:
How To Limit Repeating SignalsAn example of how to limit the input number of allowed signals using a function containing a condition counter with a reset.

Fibonacci Step IndicatorThe Fibonacci Step Indicator assumes irregularity in calculating a moving average. It is measured as the mean of the previous lows and highs situated at Fibonacci past periods. For example, the mean of the lows from 2, 3, 5, 8, etc. periods ago form the Fibonacci step indicator.
The indicator uses the formula for the first twelve Fibonacci numbers on highs and lows so that it creates a moving support/resistance zone. Afterwards, the zone is stabilized by taking the highest highs of the upper indicator and the lowest lows of the lower indicator part.
The indicator is used as a trend following way. It can be compared to the Ichimoku Kinko Hyo cloud (without the future projection). The zone form a support and resistance area. During ranging periods, the market will fluctuate within the area which is a bad time to follow the trend (if any).

Cloak & Dagger Heikin-ashiThis indicator is intended to reduce market noise by averaging "Heikin-ashi" a few more times.
You can set the number of averages and how the closing price is calculated.
The Modes:
There are several presets.
The "Mode 1" is more conservative and flips fewer times, but with less noise.
(Averaged by 5 times, Close calculated by oc2)
The "Mode 2" is more aggressive, with more flips and faster timing.
(Averaged by 10 times, Close calculated by ohlc4)
Triggers:
Triggers the inversion of the bar. It can be visualized and alerts can be set.

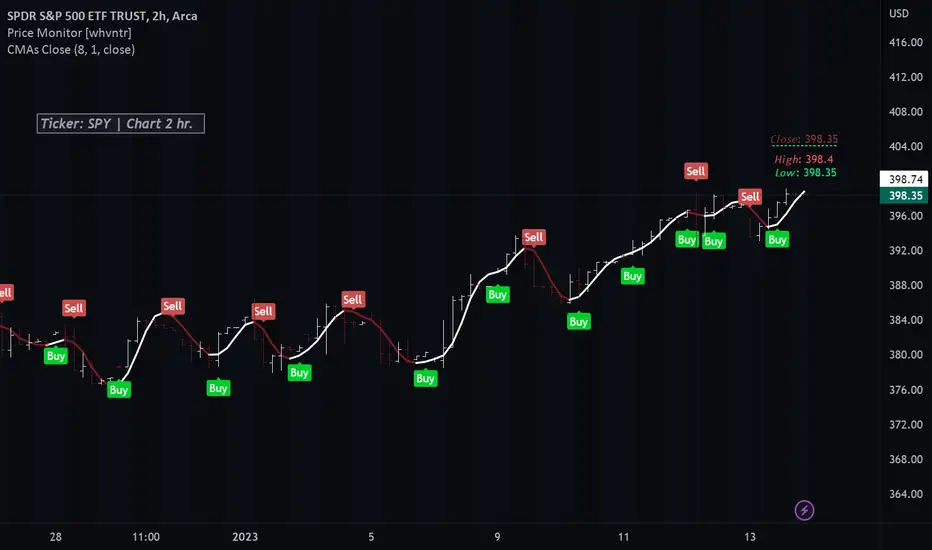
Colored Moving Averages With Close Signals[Whvntr][TradeStation]Plots the first time the close price is above or below the colored portion of the chosen MA. The MA's formula is from TradeStation's indicator: "Colored Moving Averages Can Help You Spot Trends" . I modified that indicator with customizations that include: Buy and Sell signals. Each time the current bar closes above the MA, while it's red (bearish), there's a Sell label at the start of that MA trend. Likewise: each time the current bar closes below the MA, while it's white (bullish), there's a Buy label at the beginning of that MA trend. You can now, also, easily see which MA you are selecting by hovering your cursor over the tooltips icon. I've included a modified Hull MA as default because I've found this SMA combination with the WMA to be a very smooth oscillation. I've also added some different types of MA's. Colored moving averages are helpful to determine when a trend may be reversing.
MA's
1 · Modified Hull MA: (SMA of the WMAs Hull Formula)
2 · Hull MA
3 · Exponential Moving Average
4 · Weighted Moving Average
5 · RMA Moving Average used in RSI
6 · Volume Weighted MA
7 · Simple Moving Average
This indicator isn't endorsed as a guarantee of future, favorable, results.
Swing Rapat Jik ( LOW-HIGH ) Smart Money TrendBandSWING RAPAT JIK ( LOW-HIGH ) Smart Money TrendBand
( 2023 updated edition )
The Swing Rapat Jik indicator is a method of knowing whether the current market is either at the highest or the lowest price.
It is also a relatively less risky strategy and suitable for long-term traders such as swing traders.
The analysis tool used is based on the Relative Strength Index ( RSI ) indicator as a parameter to measure the lowest price and the highest price in each cycle. If the price is at the extremely oversold level, then it shows the lowest price signal (LL/HL). Vice versa, if the price is at the extreme overbought level, then the signal will show the highest price signal (HH/LH).
It should be noted that this indicator is a repaint where it will make a re-mark if the price is at the lowest level of the previous signal. So, the solution is that I’ve added the Moving Average parameter as confirmation of the reversal of the LL price to the uptrend. That means the signal to enter the market only occurs when there is an Entry Price (EP) signal after LL/HL signal appears.
Please, do not enter the market when the EP signal is released if the LL/HL signal is not yet released. Make sure these two signals come out consecutively, starting with HL/LL and then the EP signal.
Key Signal;
LL = LOWER LOW
HL = HIGHER LOW
HH = HIGHER HIGH/TAKE PROFIT
LH = LOWER HIGH/TAKE PROFIT
EP = ENTRY PRICE
Hopefully, it can help traders to track the price at the lowest level before making a reversal and the highest price during the market supply situation.
*So far, the invention of the entry market is for the stock market only, which is to use buy signals only. Any updates for other markets will be notified from time to time.
Major updates;
1. Update version to Version 5 pine script
2. variable value used for the EP signal, to obtain a more significant weighted value.
3. Change of label color
4. Colored bars- bullish and bearish trends detected
SOPs and strategies
colored bars are pointers of the current trend and the period in which it occurred.
Use this combination as a strong confirmation
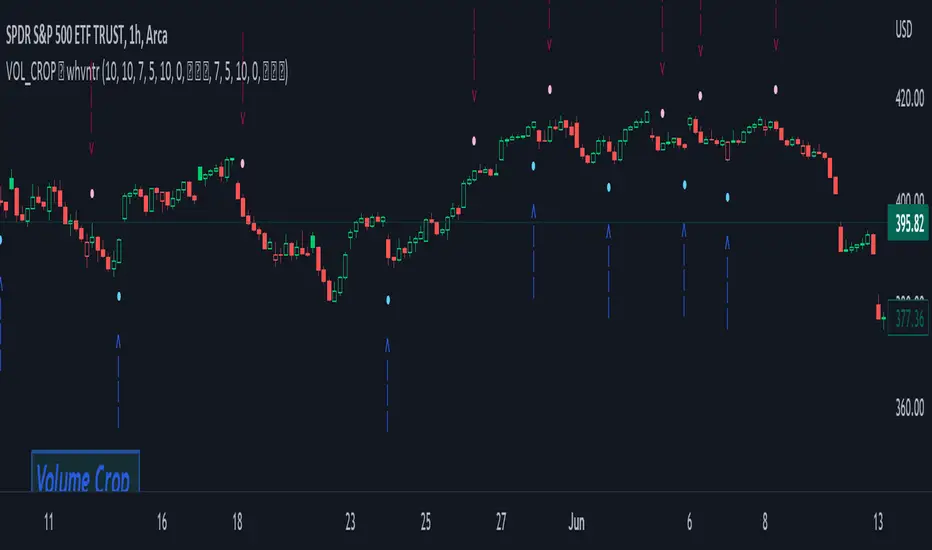
Volume Crop ━ Hidden Volume Divergence [whvntr] Volume Divergence
• Formula originated from: "Hidden Price Divergence" (circles) by TheLark. I did two things to harness its
effectiveness:
• Firstly, I developed a unique way to filter out the divergence signals that were appearing on both sides of the
midline. This filter will be known as the "Midline Tool" . It filters out a lot of the false signals commonly
associated with oscillators.
• Then, I modified the default format from Price to Volume.
• The midline formula "Midline Tool" was developed by me . It adjusts in the thousands since it's volume.
Let me know in the comments if you would rater have a smaller step value than 10,000. How does it work?
Crossover then Crossunder, the arrows only appear during the first sign of hidden volume divergence once
crossing the midline. Normally, these signs appear on both side of the midline both bearish and bullish no
matter if it's on an oversold or overbought side of the spectrum... Also, let
me know in the comments if you would like for me to release an oscillator version of this
indicator for co-witnessing.
Features:
• Volume divergence
• Midline Tool©
• Disclaimer: This indicator does not constitute investment advice. Trade at your own risk with the investments
you can afford to lose because all financial investments have risks and this is not a
guarantee that the volume divergence will be 100% all the time.
Bender Stochastic MTF With Buy & Sell SignalsA stochastic indicator is a technical analysis tool that uses random data points to forecast price changes in a financial security. It compares the closing price of a security to its price range over a set period of time. The indicator is designed to indicate when a security is overbought or oversold by comparing the closing price to the price range over a certain number of periods. A stochastic indicator can be used to identify potential buying or selling opportunities. It is often used in conjunction with other technical analysis tools to provide a more comprehensive analysis of market conditions.
Configurable Indicator Signals
Signal on k & d Stochastic Line Crosses
Invalidate Signal if not in a overbought or oversold pressure zone
Invalidate signal on neutral zone breach
Invalidate signal on reverse cross
Invalidate signal after a user set number of bars
Delay signal until the cross is considered strong by calculating the distance between the stochastic lines the a user set threshold
Please Note:
This indicator is also embedded in the Bender Bot strategy script. Signals and confluence identified by this indicator can be used to autonomously mange strategies. The below settings will not have any effect on this indicator's functionality when used as a stand alone indicator.
Bender Bot Strategy Confluence
Close any open trade on reverse k & d Stochastic line crosses
Require any signal and Stochastic directional confluence before opening any trade
Require any signal and Stochastic pressure to be in confluence before opening any trade
Require any signal to be in directional confluence with the Stochastic signal

Bender Filtered MA Cloud with Buy Sell SignalsBender MA Cloud is a powerful indicator that uses two moving averages filtered by standard deviation to create a "cloud" on the chart. The upper and lower bounds of the cloud could be key levels of support and resistance, and the indicator plots lines on the chart that reflects the average price of the stock over a specified period of time. The standard deviation is used to filter out noise and identify significant trends. Bender MA Cloud also generates signals based on the direction changes of the fast moving average, crosses of the cloud, and breaches of the cloud boundaries. This indicator is a useful tool for traders who want to make informed decisions based on reliable market trends and anticipate potential trade opportunities. (Video Demo Coming Soon)
Configurable Indicator Signals
Signal on :
Pullbacks
A pullback begins when the fast MA1 line changes direction and moves opposite to the cloud. The pullback is confirmed when the fast MA1 line returns to the direction of the cloud on the close of the bar. These signals can be fine-tuned using the invalidation settings below.
Breaches
A breach is signaled when the price closes beyond the slow MA2 line in the opposite direction of the cloud. These signals can be optimized using the invalidation settings.
Crosses
A cross is signaled by a change in the direction of the cloud. The strength of the cross can be evaluated using the settings below..
Signal Filters
Confirmed pullbacks allowed after a cross
The number of confirmed pullbacks allowed after a cross can be set using this option. If the number of confirmed pullbacks since the last cross exceeds the specified value, the pullback signal will be invalidated.
Allowed Number of bars in Pullback
The pullback signal is considered invalid if the specified number of bars form within the pullback without a reversal occurring. This limits the number of bars allowed in the pullback.
Invalidate Pullback if price breaches the slow MA2
The pullback signal is considered invalid if the price crosses the slow MA2 during the pullback. This indicates that the trend may be reversing and the signal is no longer reliable.
Require Strong Cloud During Pullback
This option allows you to invalidate the pullback signal if the cloud is not considered strong using the ATR strength threshold. This can help to ensure that the signal is reliable and accurate..
Require Strong Cross. _ look-back bars.
This option allows you to invalidate the cross signal if the cloud is not considered strong over a specified number of look-back bars. The strength of the cloud is measured using the ATR strength threshold, and the signal will be invalidated if the cloud is not considered strong. This can help to ensure that the signal is reliable and accurate..
Strength Threshold ATR Length
This option allows you to specify the ATR length that should be used to gauge the strength of the cloud. Keep in mind that the ATR is a dynamic measure, so if there is a spike in the ATR, the cloud strength calculations will also change. This can affect the reliability and accuracy of the signals generated by the indicator.
Cloud Size Must Be _ times the size of the Threshold ATR to be considered strong
This option allows you to specify the minimum size that the cloud must be relative to the Threshold ATR in order to be considered strong. If the distance between the fast MA1 and the slow MA2 is less than the specified value multiplied by the Threshold ATR, the cloud is considered weak. For example, if the cloud size is not at least 2 times the ATR, it will be considered weak.
This indicator is also incorporated into the Bender Bot strategy script and can be used to autonomously manage strategies based on signals and confluences identified by the indicator. When used as a standalone indicator, the features below will not affect the indicators functionality.
Bender Bot Strategy Confluence
Require Signal Confluence before opening any position
This option requires that all of the signal conditions are met before opening any position. If all conditions are satisfied, the signal will remain "Long" or "Short" until it is invalidated.
Require MA Cloud Directional Confluence before opening any position
This option requires that the direction of the cloud (either "Long" or "Short") is in agreement before opening any position. The direction of the cloud changes on crosses.
Close Position if Pullback is started
This option closes the position if a pullback is started and causes the fast MA1 line to change direction and oppose the open position.
Please feel free to contact me if there are any questions

[LazyBear] SQZ Momentum + 1st Gray Cross Signals ━ whvntrI have modified LazyBears Squeeze Momentum Indicator with enhancements, plus added signals
LazyBear mentioned that in John F. Carter's book, Chapter 11, "Mastering the Trade", that "Mr. Carter suggests waiting till the first gray after a black cross, and taking a position in the direction of the momentum (for ex., if momentum value is above zero, go long). Exit the position when the momentum changes (increase or decrease --- signified by a color change)." I have done just that. Now at each "first gray after a black cross", there are now Bearish and Bullish signals.. The signals only appear in the direction of the momentum.
Disclaimer: This indicator does not constitute investment advice. Trade at your own
risk with this method of identifying changes in stock market momentum.

Auto Trend Lines Breakouts and Bounces Signals and AlertsAuto Trend Lines Breakout with Confirmation Bounce Signals and Alerts
This indicator draws trend lines automatically based on the 2 pivot points, which are calculated based on the specified number of bars (length), which is of course customizable. The indicator then shows you when these trend lines get touched (potential bounce) or “almost touched” (Yes! The script can do that as well!) by the current price of the instrument or broken and then confirmed by the “after break come back touch” – classic! Everything is shown on the chart, and for everything - alarms can be set up with just a few clicks!
Now there are 2 modes here (you can hide all signals as well and just use the trend lines):
1) Current/recent trend lines only: will only show 2 current upper/lower trend lines as well as previous 2 for reference.
2) All time (historical) trend lines: will show 2 current upper/lower trend lines as well as the historical lines from the past and these lines are often very respected by the price!
Besides that, you can set the indicator to show you exactly what you want: Just the trend lines touches/bounces, breaks with confirmation touches/bounces or BOTH.
In addition to that, you can set the indicator to only show you these touches/bounces and breaks with additional confirmations, only if confirmed by :
- Moving Average (customizable length): LONG signals based off the trend lines will only be shown if above EMA, SHORT if below.
- Signals where the candle color confirms the direction of the trade, but the candle type is opposite (like a green colored bearish hammer for example) will be avoided (such candles can be very uncertain/deceptive)
- Signals where the signal candle is doji will be avoided (uncertain)
- Signals will only be shown if supported by the trend line slope (for example, with this feature turned on, if there is an upper line trend line, but the line is actually above, touching the top of the candles and the price touches/crosses it or it gets broken – there will be no signal as even though the trend line is an upper line above candles, it’s slope is positive (going up), if the slope would be down, like a classical down/bearish trend line and the price touches/bounces off it or the line gets broken, only then the indicator will show the signal/alert.
- OFFSET: this one is really cool! With this feature you can hunt these conditions when the price comes very near the trend line, but never touches it. With this setting turned on, with a correct offset amount – you will be able to catch these! You will need to play around with the offset amount, depending on the timeframe/instrument, be quick-n-easy!
The indicator also includes Round Number lines on the chart, which are customizable for any instrument. As you know round numbers are appreciated by the price and can be very nicely used with this indicator looking for combos or using trend lines for signals, while round numbers as partial profit price targets or stop-loss areas.
Important economic events are also shown on the chart as red vertical lines (during these events, volatility can suddenly spike, so it’s best to stay away from trading!)
This is a very powerful indicator with plenty of customizations to find the best approaches, can be used for any instrument and on any timeframe! Awesome for scalping and could be used with swing trading as well! Enjoy!
To add the alerts
-Right-click anywhere on the TradingView chart
-Click on Add alert
-Condition: Auto Trend Lines Breakout with Confirmation Bounce Signals and Alerts
-Alert name: DO NOT TOUCH THIS
-Hit “Create”
-Note: If you change ANY Settings within the indicator – you must DELETE the current alert and create a new one per steps above, otherwise it will continue triggering alerts per old Settings!
A few strategies how this indicator can be used (these were actually tested and showed awesome results!):
1) Bounce Scalping: Simply hunting bounces off the trend lines. Often the price will slightly cross the trend line and then immediately bounces from it for nice little price move, which is great for scalping or if you for example take 2/3s off the position and leave the remaining, often with such bounces – the price may reverse from the trend line and go in the opposite direction considerably.
2) Break-Bounce-Confirm: this is the “Breaks with Confirmation Bounce” option of the script which fully automates the classical trend lines break confirmation, where the trend line is broken (which could be a fake out), so you wait for a touch/bounce of that trend line back from the initial break and open the position right there or wait and see if after the touch/bounce back, the price once again goes into the direction of the break.
For stop-loss and take-profit areas, you can use:
1) Pivots (these are marked with red and green crosses on the chart), which are used to draw the actual trend lines.
2) The actual trend lines themselves (if one gets broken + confirmation, you can set your stop-loss if that same line gets broken again in the opposite direction | similar for take-profit, you can take profit or partial profit at next trend line on the chart if the price reaches it.
3) Use the Round Numbers included, for example: use the closest round number as a visual soft stop-loss and the furthest one away as a visual soft take-profit.
You can try combining this indicator with divergence, stochastic, Bollinger bands, pretty much anything!
If you wish to try this out for a week or so – please reach out and I will give you access.
