Cvd Divergence Signals with filter.
CVD Divergence + Candles - False Signal Filter
Hey traders,
I want to share my custom indicator with you. Through testing, I've found that CVD (Composite Volume Delta) captures divergences much more accurately than traditional tools like RSI. But this isn't just another divergence indicator - I've added strict candlestick pattern confirmation to filter out false signals. I'll keep improving this tool over time, and I welcome all your suggestions in the comments.
How it works step-by-step:
1. First, it detects CVD divergences (the delta between buy/sell volumes)
2. Then confirms each signal with reversal candlestick patterns:
- Hammer/Hanging Man
- Engulfing
- Pin Bar
- Inside Bar
Why mine beats standard CVD indicators:
• No raw divergences - only shows signals confirmed by BOTH volume AND price action
• Eliminates 80% of junk signals from basic versions
• Adaptable to any asset and timeframe
Simple usage guide:
Green arrows = Buy when:
- CVD shows bullish divergence
- AND a hammer/pin bar appears
Red arrows = Sell when:
- CVD shows bearish divergence
- Confirmed by hanging man/engulfing pattern
Pro tip:
For best results, combine with:
• Volume profile analysis
• Smart Money concepts (order blocks, FVGs )
Important notes:
This isn't a holy grail - I personally use it with support/resistance levels. Works best on 5M charts for scalping.
**PS** Got questions? Drop them in comments!
Signal

SD Bands Filtered Signals### SD Bands Filtered Signals: Reversion & Volatility Scanner
**Core Description:**
The SD Bands Filtered Signals is a tool developed to help traders identify more accurate buy and sell signals in sideways markets, or during periods of low price movement. It utilizes the principles of Standard Deviation (SD) and a Moving Average (MA), with a unique 'signal filtering' system added to reduce unnecessary noise.
**Key Features:**
* **SD Bands:** Creates upper and lower bands to define price volatility zones, providing a clear overview of market conditions.
* **Intelligent Reversal Signals:** Generates specially filtered Buy/Sell signals for a 'Reversion to the Mean' strategy. These signals appear only when the market has low volatility and the price touches the SD Bands.
* **Advanced Signal Filtering System:** Uses a **`Cooldown Bars`** variable to set a rest period between signals. This prevents repetitive arrows in the same zone, helping you find the best signal at the most suitable point.
* **Fully Customizable:** You can adjust the **`Length`**, **`Multiplier`**, **`Sideways Threshold`**, and **`Cooldown Bars`** to fit your trading style and asset of choice.
**How to Use:**
* **Buy Signal (Green Arrow Up):** Look for this signal when the market is sideways and the price moves down to touch the lower band (SD Low).
* **Sell Signal (Red Arrow Down):** Look for this signal when the market is sideways and the price moves up to touch the upper band (SD High).
* **Customization:** You can adjust the **`Cooldown Bars`** value to control the number of arrows. If you want more accurate but fewer signals, increase this value.
**Disclaimer:**
* This indicator is an **analytical tool only** and is not a 100% guarantee of profit.
* It should be used in conjunction with other forms of analysis, such as candlestick patterns, trading volume, and proper risk management.
ไทย
ชื่ออินดิเคเตอร์ "SD Bands Filtered Signals: Reversion & Volatility Scanner"
คำอธิบายหลัก:
อินดิเคเตอร์ SD Bands Filtered Signals เป็นเครื่องมือที่ถูกพัฒนาขึ้นเพื่อช่วยให้นักเทรดสามารถระบุสัญญาณซื้อ (Buy) และขาย (Sell) ที่แม่นยำขึ้นในตลาดแบบ Sideways หรือช่วงที่ราคาเคลื่อนที่ในกรอบแคบๆ โดยใช้หลักการของ Standard Deviation (SD) และ Moving Average (MA) และเพิ่มระบบ 'กรองสัญญาณ' ที่เป็นเอกลักษณ์เพื่อลดสัญญาณรบกวน (Noise) ที่ไม่จำเป็นออกไป
คุณสมบัติเด่น:
* SD Bands: สร้างเส้นขอบบนและล่างเพื่อระบุโซนความผันผวนของราคา ทำให้เห็นภาพรวมของตลาดได้ง่าย
* สัญญาณ Reversal อัจฉริยะ: สร้างสัญญาณ Buy/Sell ที่ถูกคัดกรองมาเป็นพิเศษสำหรับกลยุทธ์การกลับตัว (Reversion to the Mean) โดยจะปรากฏเฉพาะเมื่อตลาดมีความผันผวนต่ำและราคาแตะขอบของ SD Bands
* ระบบกรองสัญญาณขั้นสูง: ใช้ตัวแปร Cooldown Bars เพื่อกำหนดระยะเวลาพักสัญญาณ ทำให้ไม่เกิดลูกศรซ้ำๆ ในโซนเดียวกัน และช่วยให้คุณได้สัญญาณที่ดีที่สุดในจุดที่เหมาะสมที่สุด
* ปรับแต่งได้เต็มที่: คุณสามารถปรับค่า Length, Multiplier, Sideways Threshold และ Cooldown Bars เพื่อให้เข้ากับสไตล์การเทรดและคู่สินทรัพย์ที่คุณสนใจ
วิธีการใช้งาน:
* สัญญาณ Buy (ลูกศรสีเขียวขึ้น): มองหาสัญญาณนี้เมื่อตลาดอยู่ในช่วง Sideways และราคาวิ่งลงมาแตะเส้นขอบล่าง (SD Low)
* สัญญาณ Sell (ลูกศรสีแดงลง): มองหาสัญญาณนี้เมื่อตลาดอยู่ในช่วง Sideways และราคาวิ่งขึ้นไปแตะเส้นขอบบน (SD High)
* การปรับแต่ง: คุณสามารถปรับค่า Cooldown Bars เพื่อให้ได้จำนวนลูกศรที่ต้องการ หากต้องการสัญญาณที่แม่นยำขึ้นแต่จำนวนน้อยลง ให้เพิ่มค่านี้ให้สูงขึ้น
ข้อควรระวัง:
* อินดิเคเตอร์นี้เป็นเพียงเครื่องมือวิเคราะห์ ไม่ใช่สัญญาณที่การันตีผลกำไร 100%
* ควรใช้ประกอบกับการวิเคราะห์อื่นๆ เช่น รูปแบบแท่งเทียน, ปริมาณการซื้อขาย (Volume) และการจัดการความเสี่ยงที่เหมาะสม

DAX Inducere Simplă v1.3 – Confirmare InducereDAX Inducere Simplă v1.3 – Confirmare Inducere ,signals before fvg mss and displacement

Smart Money Breakout Channels [AlgoAlpha]🟠 OVERVIEW
This script draws breakout detection zones called “Smart Money Breakout Channels” based on volatility-normalized price movement and visualizes them as dynamic boxes with volume overlays. It identifies temporary accumulation or distribution ranges using a custom normalized volatility metric and tracks when price breaks out of those zones—either upward or downward. Each channel represents a structured range where smart money may be active, helping traders anticipate key breakouts with added context from volume delta, up/down volume, and a visual gradient gauge for momentum bias.
🟠 CONCEPTS
The script calculates normalized price volatility by measuring the standard deviation of price mapped to a scale using the highest and lowest prices over a set lookback period. When normalized volatility reaches a local low and flips upward, a boxed channel is drawn between the highest and lowest prices in that zone. These boxes persist until price breaks out, either with a strong candle close (configurable) or by touching the boundary. Volume analysis enhances interpretation by rendering delta bars inside the box, showing volume distribution during the channel. Additionally, a real-time visual “gauge” shows where volume delta sits within the channel range, helping users spot pressure imbalances.
🟠 FEATURES
Automatic detection and drawing of breakout channels based on volatility-normalized price pivots.
Optional nested channels to allow multiple simultaneous zones or a clean single-zone view.
Gradient-filled volume gauge with dynamic pointer to show current delta pressure within the box.
Three volume visualization modes: raw volume, comparative up/down volume, and delta.
Alerts for new channel creation and confirmed bullish or bearish breakouts.
🟠 USAGE
Apply the indicator to any chart. Wait for a new breakout box to form—this occurs when volatility behavior shifts and a stable range emerges. Once a box appears, monitor price relative to its boundaries. A breakout above suggests bullish continuation, below suggests bearish continuation; signals are stronger when “Strong Closes Only” is enabled.
Watch the internal volume candles to understand where buy/sell pressure is concentrated during the box. Use the gauge on the right to interpret whether net pressure is building upward or downward before breakout to anticipate the direction.
Use alerts to catch breakout events without needing to monitor the chart constantly 🚨.

Advanced RSI Divergence & Signal TrackerThis indicator offers a unique edge over traditional RSI divergence tools by supporting both Live and Confirmed modes of divergence detection.
Key Features:
Two Detection Modes
- Live Mode: Detects divergences as price moves. Ideal for faster signal generation when early entries matter. Only the most recent signal may repaint to stay aligned with live market data.
- Confirmed Mode: Waits for full pivot confirmation before signaling. This results in more stable, but delayed, signals — great for traders who prefer validation over speed.
Multiple Divergence Types
Supports detection and visualization for the following:
- Bullish Divergence
- Hidden Bullish Divergence
- Bullish Convergence
- Bearish Divergence
- Hidden Bearish Divergence
- Bearish Convergence
Each signal is marked directly on the RSI chart with labeled lines for clarity.
RSI Signal Tracker Panel
A built-in, optional status table displays:
- Current signal type
- RSI value at the signal
- Price at the signal
- Age of the signal (in bars)
- Previous signal (if enabled)
Fully customizable in the settings — show only what you want to see.
Alerts Included
Alerts are available for all divergence and convergence signal types.
This indicator is designed for traders who want flexibility — whether you need early signals or prefer confirmed ones. Perfect for both reversal and trend-following strategies, with complete control over what is shown on your chart.

52SIGNAL RECIPE Smart Money Detector : CME + Exchanges=================52SIGNAL RECIPE CME-Exchange Smart Money Detector=================
◆ Overview
The 52SIGNAL RECIPE CME-Exchange Smart Money Detector is an advanced technical indicator designed to identify institutional and smart money movements by analyzing and comparing futures markets across both CME and cryptocurrency exchanges. This powerful tool detects coordinated buying and selling patterns that often precede significant price movements, giving traders an edge in anticipating market direction.
What makes this indicator unique is its cross-market verification approach. By requiring confirmation from both CME Bitcoin futures (dominated by institutional players) and crypto exchange futures (with broader market participation), it significantly reduces false signals and identifies high-probability smart money footprints that typically lead market movements.
─────────────────────────────────────
◆ Key Features
• Dual Market Confirmation: Simultaneously analyzes both CME Bitcoin futures and exchange futures charts to identify synchronized smart money activity
• Smart Volume Analysis: Uses advanced algorithms to separate buying and selling volume based on candle structure and price action
• Energy Wave Visualization: Displays smart money signals as intuitive energy waves with varying sizes reflecting signal strength
• Strength Rating System: Quantifies signal strength on a 0-100% scale, with multiple visualization levels (10%+, 40%+, 60%+, 80%+)
• Candlestick Pattern Integration: Incorporates bullish/bearish candle formations to enhance signal reliability
• Volume Spike Detection: Identifies abnormal volume increases that often accompany smart money positioning
• Trend Context Analysis: Evaluates signals in relation to current market trend for higher probability setups
• Dynamic Strength Calculation: Uses a multi-factor model considering volume ratio, buying/selling imbalance, candle structure, and trend alignment
• Transparent Signal Labeling: Displays precise strength percentage values with each signal for clear decision-making
• Real-time Institutional Flow Monitor: Tracks the footprints of large players across both regulated (CME) and crypto exchange markets
─────────────────────────────────────
◆ Understanding Signal Types
■ Buy Signal Energy Waves (Green)
• Definition: Detected when significant buying pressure appears simultaneously on both CME and exchange futures, typically on bearish candles
• Visual Appearance: Green circular waves below price bars, with size/opacity increasing with signal strength
• Market Interpretation: Indicates institutional buying interest even as price is declining, often preceding bullish reversals
• Signal Strength Factors:
▶ Higher buying volume relative to selling volume
▶ Above-average total volume
▶ Lower wicks on bearish candles
▶ Appearance at key support levels
▶ Coinciding with oversold conditions
■ Sell Signal Energy Waves (Red)
• Definition: Detected when significant selling pressure appears simultaneously on both CME and exchange futures, typically on bullish candles
• Visual Appearance: Red circular waves above price bars, with size/opacity increasing with signal strength
• Market Interpretation: Indicates institutional selling interest even as price is rising, often preceding bearish reversals
• Signal Strength Factors:
▶ Higher selling volume relative to buying volume
▶ Above-average total volume
▶ Upper wicks on bullish candles
▶ Appearance at key resistance levels
▶ Coinciding with overbought conditions
─────────────────────────────────────
◆ Signal Strength Understanding
■ The Four Strength Levels
• Level 1 (10-39%): Initial Detection
▶ Visual: Smallest energy wave
▶ Meaning: Early smart money positioning detected
▶ Usage: Early warning, prepare for possible setup
• Level 2 (40-59%): Moderate Strength
▶ Visual: Medium-small energy wave
▶ Meaning: Clearer institutional positioning
▶ Usage: Begin position planning, watch for confirmation
• Level 3 (60-79%): Strong Signal
▶ Visual: Medium-large energy wave
▶ Meaning: Significant smart money footprint
▶ Usage: High-probability setup forming, consider entry
• Level 4 (80-100%): Exceptional Strength
▶ Visual: Largest energy wave
▶ Meaning: Powerful institutional movement confirmed
▶ Usage: Highest probability setup, strong conviction entry point
■ Understanding Signal Strength Calculation
• Volume Component (0-50 points):
▶ Measures how current volume compares to recent average
▶ Maximum points when volume is 2x or higher than average
• Buy/Sell Ratio Component (0-50 points):
▶ Measures imbalance between buying and selling pressure
▶ Maximum points when ratio exceeds predefined multiplier threshold
• Advanced Weighting Factors:
▶ Candle Structure: Body size, wick length, and orientation
▶ Trend Alignment: Signal relationship to current trend
▶ Volume Spike: Abnormal volume increase detection
▶ Cross-Market Confirmation: Strength of signal alignment between CME and exchange
─────────────────────────────────────
◆ Practical Trading Applications
■ Reversal Trading Strategy
• Buy Signal Application:
▶ Setup: Strong buy energy wave (60%+) on a bearish candle
▶ Entry: After confirmation candle following the signal
▶ Stop Loss: Below recent low or 1 ATR below entry
▶ Take Profit: Previous resistance or 1:2 risk-reward minimum
▶ Enhancers: Signal occurring at support zone, oversold conditions, or trend line tests
• Sell Signal Application:
▶ Setup: Strong sell energy wave (60%+) on a bullish candle
▶ Entry: After confirmation candle following the signal
▶ Stop Loss: Above recent high or 1 ATR above entry
▶ Take Profit: Previous support or 1:2 risk-reward minimum
▶ Enhancers: Signal occurring at resistance zone, overbought conditions, or trend line tests
■ Trend Continuation Strategy
• During Uptrends:
▶ Focus on buy signals that appear during pullbacks
▶ Higher probability when signals occur at key moving averages or support levels
▶ Enter on strength when price shows signs of resuming the uptrend
• During Downtrends:
▶ Focus on sell signals that appear during relief rallies
▶ Higher probability when signals occur at key moving averages or resistance levels
▶ Enter on strength when price shows signs of resuming the downtrend
■ Multiple Timeframe Approach
• Signal Confirmation Across Timeframes:
▶ Major signals on higher timeframes (4H, daily) provide strategic direction
▶ Signals on lower timeframes (15m, 1H) offer tactical entry points
▶ Highest probability setups occur when signals align across multiple timeframes
• Signal Clustering:
▶ Multiple signals in the same price area significantly increase probability
▶ Look for areas where both buy and sell signals have appeared, indicating battleground zones
▶ The most recent signal direction often wins these battles
─────────────────────────────────────
◆ Technical Foundation
■ Why Cross-Market Confirmation Matters
• Institutional Participation:
▶ CME Bitcoin futures are dominated by regulated institutional investors
▶ Crypto exchange futures include both retail and institutional players
▶ When both markets show the same smart money pattern, the signal reliability increases dramatically
• Market Inefficiency Exploitation:
▶ Large players often position across multiple venues to minimize market impact
▶ This coordinated activity creates detectable footprints when analyzed correctly
▶ Cross-market confirmation helps filter out market noise and isolate true smart money movements
■ Smart Volume Calculation Methodology
• Price-Volume Relationship Analysis:
▶ Uses candle structure to estimate buying vs. selling volume
▶ Buying volume = Total volume × (Close - Low) / (High - Low)
▶ Selling volume = Total volume × (High - Close) / (High - Low)
• Signal Triggering Logic:
▶ Buy signal: When buying volume exceeds selling volume by multiplier factor
▶ Sell signal: When selling volume exceeds buying volume by multiplier factor
▶ Both conditions must be met simultaneously on CME and exchange futures
• Advanced Pattern Recognition:
▶ Evaluates candle body-to-range ratio for signal quality
▶ Analyzes wick length and position for additional confirmation
▶ Considers recent highs/lows to detect potential turning points
─────────────────────────────────────
◆ Indicator Settings Guide
■ Main Settings
• CME Bitcoin Futures Symbol:
▶ Default: CME:BTC1!
▶ Purpose: Sets the CME futures contract to analyze alongside current chart
• Buy/Sell Volume Multiplier:
▶ Default: 3.0
▶ Range: 1.0-10.0
▶ Purpose: Determines how much buying volume must exceed selling volume (or vice versa) to trigger a signal
▶ Higher values = fewer but stronger signals
▶ Lower values = more signals but potentially lower reliability
■ Volume Filter Settings
• Enable Volume Filter:
▶ Default: Enabled
▶ Purpose: When enabled, only considers candles with above-threshold volume
• Volume Average Period:
▶ Default: 20 candles
▶ Range: 5-200 candles
▶ Purpose: Sets the lookback period for calculating average volume
• Volume Threshold:
▶ Default: 150%
▶ Range: 10%-500%
▶ Purpose: Minimum volume percentage (of average) required for signal consideration
▶ Higher values focus on only the most significant volume spikes
■ Signal Visualization
• Show Signal Strength Value:
▶ Default: Enabled
▶ Purpose: Displays the exact percentage strength value with each signal
• Energy Wave Colors:
▶ Buy Energy Wave: Green (#00ff80)
▶ Sell Energy Wave: Red (#ff4040)
▶ Purpose: Customize the appearance of energy waves for visual preference
■ Advanced Settings
• Use Advanced Strength Calculation:
▶ Default: Enabled
▶ Purpose: When enabled, uses the full multi-factor model for signal strength
▶ When disabled, uses only basic volume and ratio factors
─────────────────────────────────────
◆ Synergy with Other Indicators
• Support/Resistance Levels:
▶ Smart money signals occurring at key support/resistance significantly increase reliability
▶ Particularly powerful when signals appear at tested price levels
• Moving Averages:
▶ Signals near key moving averages (50MA, 200MA) often indicate institutional interest
▶ Moving average crosses combined with smart money signals create high-probability setups
• RSI/Momentum Indicators:
▶ Buy signals in oversold conditions increase probability of successful reversal
▶ Sell signals in overbought conditions increase probability of successful reversal
• Volume Profile:
▶ Signals occurring at high volume nodes often indicate significant turning points
▶ Low volume nodes between high volume areas can act as acceleration zones after signal triggers
• Market Structure:
▶ Smart money signals that break key market structure levels (higher highs/lows or lower highs/lows) are particularly significant
▶ Can signal the early stages of trend changes when aligned with structure breaks
─────────────────────────────────────
◆ Conclusion
The 52SIGNAL RECIPE CME-Exchange Smart Money Detector provides traders with a powerful edge by revealing institutional positioning across both regulated futures and crypto exchange markets. By requiring synchronized signals from both venues, it cuts through market noise to identify the most reliable smart money footprints.
What sets this indicator apart is its sophisticated cross-market verification system. Rather than relying on signals from a single market, it only triggers when both CME and exchange futures display the same smart money pattern simultaneously. This approach dramatically reduces false signals and highlights truly significant institutional activity.
The intuitive energy wave visualization system makes it easy to spot signals of varying strength, while the transparent percentage rating allows for objective assessment of each opportunity. By focusing on these dual-confirmed smart money movements, traders can position themselves alongside institutional players rather than against them.
Remember that the most powerful signals typically appear at key market junctures, often before significant price movements. By incorporating this indicator into your trading approach, you gain insight into institutional positioning that can help anticipate market direction with greater confidence.
─────────────────────────────────────
※ Disclaimer: Like all trading tools, the CME-Exchange Smart Money Detector should be used as a supplementary indicator and not relied upon exclusively for trading decisions. Past patterns of institutional behavior may not guarantee future market movements. Always employ appropriate risk management strategies in your trading.
================52SIGNAL RECIPE CME-Exchange Smart Money Detector==================
◆ 개요
52SIGNAL RECIPE CME-Exchange Smart Money Detector는 CME와 암호화폐 거래소의 선물 시장을 동시에 분석하여 기관 및 스마트 머니의 움직임을 포착하는 고급 기술적 지표입니다. 이 강력한 도구는 주요 가격 움직임에 선행하는 조직적인 매수 및 매도 패턴을 감지하여 트레이더들에게 시장 방향 예측에 유리한 정보를 제공합니다.
이 지표의 독보적인 특징은 교차 시장 검증 접근법에 있습니다. CME 비트코인 선물(기관 투자자 중심)과 암호화폐 거래소 선물(광범위한 시장 참여자) 모두에서 확인을 요구함으로써, 허위 신호를 크게 줄이고 일반적으로 시장 움직임을 선도하는 고확률 스마트 머니 흔적을 식별합니다.
─────────────────────────────────────
◆ 주요 특징
• 듀얼 마켓 확인: CME 비트코인 선물과 거래소 선물 차트를 동시에 분석하여 동기화된 스마트 머니 활동 식별
• 스마트 볼륨 분석: 캔들 구조와 가격 행동을 기반으로 매수 및 매도 볼륨을 분리하는 고급 알고리즘 사용
• 에너지 파동 시각화: 스마트 머니 신호를 신호 강도를 반영하는 다양한 크기의 직관적인 에너지 파동으로 표시
• 강도 평가 시스템: 신호 강도를 0-100% 척도로 수치화하고 여러 시각화 레벨(10%+, 40%+, 60%+, 80%+) 제공
• 캔들스틱 패턴 통합: 신호 신뢰성을 높이기 위해 상승/하락 캔들 형성을 분석에 통합
• 볼륨 스파이크 감지: 스마트 머니 포지셔닝을 동반하는 비정상적인 볼륨 증가 식별
• 추세 맥락 분석: 현재 시장 추세와 관련하여 신호를 평가하여 높은 확률의 설정 제공
• 동적 강도 계산: 볼륨 비율, 매수/매도 불균형, 캔들 구조 및 추세 일치도를 고려하는 다중 요소 모델 사용
• 투명한 신호 라벨링: 명확한 의사 결정을 위해 각 신호와 함께 정확한 강도 백분율 값 표시
• 실시간 기관 자금 흐름 모니터: 규제된(CME) 시장과 암호화폐 거래소 시장 모두에서 대형 플레이어의 흔적 추적
─────────────────────────────────────
◆ 신호 유형 이해하기
■ 매수 신호 에너지 파동 (녹색)
• 정의: 일반적으로 하락 캔들에서 CME와 거래소 선물 모두에서 동시에 상당한 매수 압력이 감지될 때 발생
• 시각적 모습: 가격 바 아래에 녹색 원형 파동으로 표시되며, 신호 강도에 따라 크기/불투명도 증가
• 시장 해석: 가격이 하락하는 동안에도 기관의 매수 관심이 있음을 나타내며, 종종 상승 반전에 선행
• 신호 강도 요소:
▶ 매도 볼륨 대비 높은 매수 볼륨
▶ 평균 이상의 총 거래량
▶ 하락 캔들의 아래 꼬리
▶ 주요 지지 수준에서의 출현
▶ 과매도 조건과 일치
■ 매도 신호 에너지 파동 (적색)
• 정의: 일반적으로 상승 캔들에서 CME와 거래소 선물 모두에서 동시에 상당한 매도 압력이 감지될 때 발생
• 시각적 모습: 가격 바 위에 적색 원형 파동으로 표시되며, 신호 강도에 따라 크기/불투명도 증가
• 시장 해석: 가격이 상승하는 동안에도 기관의 매도 관심이 있음을 나타내며, 종종 하락 반전에 선행
• 신호 강도 요소:
▶ 매수 볼륨 대비 높은 매도 볼륨
▶ 평균 이상의 총 거래량
▶ 상승 캔들의 위 꼬리
▶ 주요 저항 수준에서의 출현
▶ 과매수 조건과 일치
─────────────────────────────────────
◆ 신호 강도 이해하기
■ 네 가지 강도 레벨
• 레벨 1 (10-39%): 초기 감지
▶ 시각적: 가장 작은 에너지 파동
▶ 의미: 초기 스마트 머니 포지셔닝 감지
▶ 활용: 초기 경고, 가능한 설정 준비
• 레벨 2 (40-59%): 중간 강도
▶ 시각적: 중간-작은 에너지 파동
▶ 의미: 더 명확한 기관 포지셔닝
▶ 활용: 포지션 계획 시작, 확인 대기
• 레벨 3 (60-79%): 강한 신호
▶ 시각적: 중간-큰 에너지 파동
▶ 의미: 중요한 스마트 머니 흔적
▶ 활용: 고확률 설정 형성, 진입 고려
• 레벨 4 (80-100%): 예외적 강도
▶ 시각적: 가장 큰 에너지 파동
▶ 의미: 강력한 기관 움직임 확인
▶ 활용: 최고 확률 설정, 강한 확신의 진입 지점
■ 신호 강도 계산 이해하기
• 볼륨 구성 요소 (0-50 포인트):
▶ 현재 볼륨이 최근 평균과 비교하여 얼마나 높은지 측정
▶ 볼륨이 평균보다 2배 이상 높을 때 최대 포인트 부여
• 매수/매도 비율 구성 요소 (0-50 포인트):
▶ 매수와 매도 압력 간의 불균형 측정
▶ 비율이 미리 정의된 배율 임계값을 초과할 때 최대 포인트 부여
• 고급 가중치 요소:
▶ 캔들 구조: 몸통 크기, 꼬리 길이 및 방향
▶ 추세 일치: 현재 추세와의 신호 관계
▶ 볼륨 스파이크: 비정상적인 볼륨 증가 감지
▶ 교차 시장 확인: CME와 거래소 간 신호 일치 강도
─────────────────────────────────────
◆ 실전 트레이딩 응용
■ 반전 트레이딩 전략
• 매수 신호 응용:
▶ 설정: 하락 캔들에서 강한 매수 에너지 파동(60%+)
▶ 진입: 신호 이후 확인 캔들 이후
▶ 손절: 최근 저점 아래 또는 진입점 아래 1 ATR
▶ 이익실현: 이전 저항 또는 최소 1:2 리스크-리워드
▶ 강화 요소: 지지 구역, 과매도 조건 또는 추세선 테스트에서 발생하는 신호
• 매도 신호 응용:
▶ 설정: 상승 캔들에서 강한 매도 에너지 파동(60%+)
▶ 진입: 신호 이후 확인 캔들 이후
▶ 손절: 최근 고점 위 또는 진입점 위 1 ATR
▶ 이익실현: 이전 지지 또는 최소 1:2 리스크-리워드
▶ 강화 요소: 저항 구역, 과매수 조건 또는 추세선 테스트에서 발생하는 신호
■ 추세 지속 전략
• 상승 추세 중:
▶ 조정 중에 나타나는 매수 신호에 집중
▶ 주요 이동평균선이나 지지 수준에서 신호가 발생할 때 확률이 높음
▶ 가격이 상승 추세를 재개할 징후를 보일 때 강도에 맞춰 진입
• 하락 추세 중:
▶ 일시적 반등 중에 나타나는 매도 신호에 집중
▶ 주요 이동평균선이나 저항 수준에서 신호가 발생할 때 확률이 높음
▶ 가격이 하락 추세를 재개할 징후를 보일 때 강도에 맞춰 진입
■ 다중 시간프레임 접근법
• 다양한 시간프레임에서의 신호 확인:
▶ 상위 시간프레임(4시간, 일봉)의 주요 신호는 전략적 방향 제공
▶ 하위 시간프레임(15분, 1시간)의 신호는 전술적 진입 지점 제공
▶ 여러 시간프레임에서 신호가 일치할 때 가장 높은 확률의 설정 발생
• 신호 클러스터링:
▶ 동일한 가격 영역에서 여러 신호가 발생하면 확률이 크게 증가
▶ 매수와 매도 신호가 모두 나타난 영역을 찾아 전투 구역 식별
▶ 이러한 전투에서는 대개 가장 최근의 신호 방향이 우세
─────────────────────────────────────
◆ 기술적 기반
■ 교차 시장 확인이 중요한 이유
• 기관 참여:
▶ CME 비트코인 선물은 규제된 기관 투자자가 주도
▶ 암호화폐 거래소 선물은 소매 및 기관 플레이어 모두 포함
▶ 두 시장이 동일한 스마트 머니 패턴을 보일 때 신호 신뢰성이 크게 증가
• 시장 비효율성 활용:
▶ 대형 플레이어들은 시장 영향을 최소화하기 위해 여러 거래소에 걸쳐 포지션을 취하는 경우가 많음
▶ 이러한 조직적인 활동은 올바르게 분석할 때 감지 가능한 흔적을 남김
▶ 교차 시장 확인은 시장 노이즈를 필터링하고 진정한 스마트 머니 움직임을 분리하는 데 도움
■ 스마트 볼륨 계산 방법론
• 가격-볼륨 관계 분석:
▶ 캔들 구조를 사용하여 매수 대 매도 볼륨 추정
▶ 매수 볼륨 = 총 볼륨 × (종가 - 저가) / (고가 - 저가)
▶ 매도 볼륨 = 총 볼륨 × (고가 - 종가) / (고가 - 저가)
• 신호 트리거 로직:
▶ 매수 신호: 매수 볼륨이 매도 볼륨을 배율 요소만큼 초과할 때
▶ 매도 신호: 매도 볼륨이 매수 볼륨을 배율 요소만큼 초과할 때
▶ 두 조건 모두 CME와 거래소 선물에서 동시에 충족되어야 함
• 고급 패턴 인식:
▶ 신호 품질을 위한 캔들 몸통-범위 비율 평가
▶ 추가 확인을 위한 꼬리 길이 및 위치 분석
▶ 잠재적 전환점을 감지하기 위해 최근 고점/저점 고려
─────────────────────────────────────
◆ 지표 설정 가이드
■ 주요 설정
• CME 비트코인 선물 심볼:
▶ 기본값: CME:BTC1!
▶ 목적: 현재 차트와 함께 분석할 CME 선물 계약 설정
• 매수/매도 볼륨 배율:
▶ 기본값: 3.0
▶ 범위: 1.0-10.0
▶ 목적: 신호를 트리거하기 위해 매수 볼륨이 매도 볼륨을 얼마나 초과해야 하는지(또는 그 반대) 결정
▶ 높은 값 = 적지만 더 강한 신호
▶ 낮은 값 = 더 많은 신호지만 잠재적으로 낮은 신뢰성
■ 볼륨 필터 설정
• 볼륨 필터 활성화:
▶ 기본값: 활성화됨
▶ 목적: 활성화되면 임계값 이상의 볼륨을 가진 캔들만 고려
• 볼륨 평균 기간:
▶ 기본값: 20 캔들
▶ 범위: 5-200 캔들
▶ 목적: 평균 볼륨 계산을 위한 룩백 기간 설정
• 볼륨 임계값:
▶ 기본값: 150%
▶ 범위: 10%-500%
▶ 목적: 신호 고려에 필요한 최소 볼륨 백분율(평균 대비)
▶ 높은 값은 가장 중요한 볼륨 스파이크에만 집중
■ 신호 시각화
• 신호 강도 값 표시:
▶ 기본값: 활성화됨
▶ 목적: 각 신호와 함께 정확한 백분율 강도 값 표시
• 에너지 파동 색상:
▶ 매수 에너지 파동: 녹색(#00ff80)
▶ 매도 에너지 파동: 적색(#ff4040)
▶ 목적: 시각적 선호도에 맞게 에너지 파동의 모양 사용자 정의
■ 고급 설정
• 고급 강도 계산 사용:
▶ 기본값: 활성화됨
▶ 목적: 활성화되면 신호 강도에 전체 다중 요소 모델 사용
▶ 비활성화되면 기본 볼륨 및 비율 요소만 사용
─────────────────────────────────────
◆ 다른 지표와의 시너지
• 지지/저항 레벨:
▶ 주요 지지/저항에서 발생하는 스마트 머니 신호는 신뢰성을 크게 높임
▶ 특히 테스트된 가격 레벨에서 신호가 나타날 때 강력함
• 이동평균선:
▶ 주요 이동평균선(50MA, 200MA) 근처의 신호는 종종 기관의 관심을 나타냄
▶ 이동평균선 교차와 스마트 머니 신호의 조합은 고확률 설정 생성
• RSI/모멘텀 지표:
▶ 과매도 조건에서의 매수 신호는 성공적인 반전 확률 증가
▶ 과매수 조건에서의 매도 신호는 성공적인 반전 확률 증가
• 볼륨 프로파일:
▶ 높은 볼륨 노드에서 발생하는 신호는 종종 중요한 전환점을 나타냄
▶ 높은 볼륨 영역 사이의 낮은 볼륨 노드는 신호 트리거 후 가속 구간으로 작용할 수 있음
• 시장 구조:
▶ 주요 시장 구조 레벨(높은 고점/저점 또는 낮은 고점/저점)을 깨는 스마트 머니 신호는 특히 중요
▶ 구조 깨짐과 일치할 때 추세 변화의 초기 단계를 알릴 수 있음
─────────────────────────────────────
◆ 결론
52SIGNAL RECIPE CME-Exchange Smart Money Detector는 규제된 선물 시장과 암호화폐 거래소 시장 모두에서 기관의 포지셔닝을 드러냄으로써 트레이더에게 강력한 우위를 제공합니다. 두 거래소에서 동기화된 신호를 요구함으로써, 시장 노이즈를 제거하고 가장 신뢰할 수 있는 스마트 머니 흔적을 식별합니다.
이 지표를 차별화하는 것은 정교한 교차 시장 검증 시스템입니다. 단일 시장의 신호에 의존하는 대신, CME와 거래소 선물 모두가 동시에 동일한 스마트 머니 패턴을 표시할 때만 트리거됩니다. 이 접근 방식은 허위 신호를 크게 줄이고 진정으로 중요한 기관 활동을 강조합니다.
직관적인 에너지 파동 시각화 시스템을 통해 다양한 강도의 신호를 쉽게 발견할 수 있으며, 투명한 백분율 평가를 통해 각 기회를 객관적으로 평가할 수 있습니다. 이러한 이중 확인된 스마트 머니 움직임에 집중함으로써, 트레이더는 기관 참가자들에 대항하기보다는 그들과 함께 포지션을 취할 수 있습니다.
가장 강력한 신호는 일반적으로 주요 시장 변곡점에서, 종종 중요한 가격 움직임 이전에 나타난다는 점을 기억하세요. 이 지표를 트레이딩 접근법에 통합함으로써, 시장 방향을 더 높은 확신으로 예측하는 데 도움이 되는 기관 포지셔닝에 대한 통찰력을 얻을 수 있습니다.
─────────────────────────────────────
※ 면책 조항: 모든 트레이딩 도구와 마찬가지로, CME-Exchange Smart Money Detector는 보조 지표로 사용되어야 하며 트레이딩 결정을 전적으로 의존해서는 안 됩니다. 과거의 기관 행동 패턴이 미래 시장 움직임을 보장하지는 않습니다. 항상 적절한 리스크 관리 전략을 트레이딩에 사용하세요.

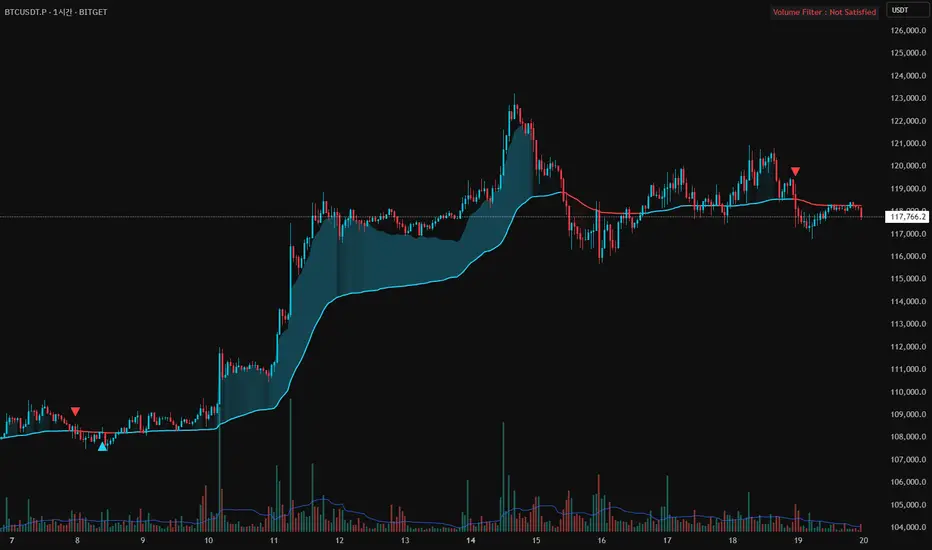
52SIGNAL RECIPE AMA Momentum Vector═══52SIGNAL RECIPE AMA Momentum Vector═══
◆ Overview
52SIGNAL RECIPE AMA Momentum Vector is an advanced technical indicator based on Adaptive Moving Average (AMA), integrating volume filtering and gradient zone visualization to provide comprehensive analysis of price trends and momentum.
It automatically adjusts to market conditions by calculating efficiency ratios, reducing noise while clearly capturing significant trends. The volume confirmation system helps traders identify high-probability entry and exit points with precision.
─────────────────────────────────────
◆ Key Features
• Adaptive Moving Average: Smart moving average that automatically adjusts based on market conditions
• Volume Filter Integration: Double-confirmation of important price movements through volume analysis
• Momentum Gradient Zones: Intuitive visualization of trend strength through color gradation
• Signal Confirmation System: Generation of high-reliability buy/sell signals by combining multiple factors
• Trend Direction Identification: Clear color distinction between bullish and bearish market conditions
• Automatic Adaptation: Intelligent design that self-adjusts to various market situations
─────────────────────────────────────
◆ Technical Foundation
■ AMA Calculation Principles
• Efficiency Ratio (ER): Measures how efficiently price moves in one direction
• Dynamic Smoothing Coefficient: Automatically adjusts faster or slower based on market conditions
• Adaptive Algorithm: Less sensitive during sideways markets, more responsive during trending markets
• Noise Reduction Function: Filters out meaningless price movements while capturing important signals
■ Momentum Vector Implementation
• Trend-Price Distance Calculation: Measures trend strength by the distance between AMA and current price
• Color Gradation: Visual system where color intensity changes proportionally to trend strength
• ATR-Based Adjustment: Automatically adjusts gradient zone width according to market volatility
• Directional Color Distinction: Intuitive display with blue/cyan for uptrends and red for downtrends
─────────────────────────────────────
◆ Practical Applications
■ Price Trend Interpretation
• Trend Direction Assessment:
▶ Price above AMA with blue gradation indicates ongoing bullish momentum
▶ Price below AMA with red gradation indicates ongoing bearish momentum
• Momentum Strength Verification:
▶ Deeper gradient colors mean stronger momentum and healthier trends
▶ Lighter gradient colors suggest weakening momentum and potential reversal
■ Trading Strategy Utilization
• Trend Following Strategy:
▶ Buy signal when price crosses above AMA with increased volume
▶ Sell signal when price crosses below AMA with increased volume
• Momentum Confirmation Trading:
▶ Deep gradation increases confidence in trend continuation for entry decisions
▶ Multiple consecutive candles staying on one side of AMA increases trend reliability
─────────────────────────────────────
◆ Advanced Configuration Options
■ Input Parameter Guide
• Fast Period (Default: 2)
▶ 1-2: Responds very quickly to price changes. Suitable for short-term trading.
▶ 3-5: Moderate response that reduces frequent signals.
▶ 6-10: Slower response but captures only more definitive trends.
• Slow Period (Default: 30)
▶ 20-25: AMA moves faster. Good for shorter timeframe trading.
▶ 26-35: Balanced speed suitable for most market conditions.
▶ 36-50: AMA moves slowly, smoothly following long-term trends.
• Efficiency Ratio Period (Default: 10)
▶ 5-8: Focuses more on recent price movements. Responds quickly to changes.
▶ 9-12: Balanced period suitable for most situations.
▶ 13-20: Considers longer-term price movements, ignoring temporary fluctuations.
• Volume Average Period (Default: 20)
▶ 10-15: Compares with the average volume of the last 10-15 days. More sensitive to changes.
▶ 16-25: Compares with the average volume of approximately the last month. Balanced setting.
▶ 26-50: Compares with long-term average volume, capturing only truly significant volume changes.
• Volume Threshold Multiplier (Default: 1.2)
▶ 1.0-1.1: Recognizes volume just 10% above average as valid.
▶ 1.2-1.5: Requires volume 20-50% higher than average (e.g., 1.2 means 120% of average).
▶ 1.6-2.0: Recognizes only very high volume at least 1.6 times (160%) above average.
■ Timeframe-Specific Recommended Settings
• Short Timeframes (5min-1hr):
Fast Period 2, Slow Period 20, Efficiency Ratio Period 8
→ Responds quickly to price changes, suitable for day trading.
• Medium Timeframes (4hr-daily):
Fast Period 2, Slow Period 30, Efficiency Ratio Period 10
→ Most balanced setting for general swing trading.
• Long Timeframes (daily-weekly):
Fast Period 2, Slow Period 40, Efficiency Ratio Period 14
→ Optimized for smoothly tracking longer trends.
■ Market-Specific Recommended Settings
• Stock Market:
Volume Threshold 1.2, Volume Average Period 20
→ Signal is valid when volume is 20% above average.
• Forex Market:
Volume Threshold 1.5, Efficiency Ratio Period 12
→ Forex requires higher volume to be meaningful and slightly longer efficiency measurement.
• Cryptocurrency Market:
Volume Threshold 1.3, Fast Period 2, Slow Period 25
→ Settings optimized for highly volatile cryptocurrencies.
─────────────────────────────────────
◆ Synergy with Other Indicators
• Moving Averages: Trend reliability increases when AMA and key moving averages point in the same direction
• RSI/Stochastic: Powerful reversal signals when AMA crossovers occur in overbought/oversold zones
• MACD: Signal probability greatly increases when MACD histogram direction changes coincide with AMA crossovers
• Bollinger Bands: Trend strength can be determined by AMA's position within Bollinger Bands
• Support/Resistance Levels: Success probability dramatically increases when AMA breakouts occur at key price levels
─────────────────────────────────────
◆ Conclusion
AMA Momentum Vector provides accurate price trend analysis by combining the advanced features of adaptive moving averages with momentum visualization technology.
It perfectly adapts to constantly changing market environments through its self-adjusting algorithm and generates highly reliable trading signals through its volume confirmation system.
Users can optimize the indicator for their trading style and market conditions with simple parameter adjustments, enabling effective trading decisions that comprehensively consider price direction, momentum strength, and volume confirmation.
─────────────────────────────────────
※ Disclaimer: Past performance does not guarantee future results. Always use appropriate risk management strategies.
═══52SIGNAL RECIPE AMA Momentum Vector═══
◆ 개요
52SIGNAL RECIPE AMA Momentum Vector는 적응형 이동평균(AMA)을 기반으로 한 고급 기술적 지표로, 볼륨 필터링과 그라데이션 존 시각화를 통합하여 가격 추세와 모멘텀을 종합적으로 분석합니다.
시장 효율성 비율을 자동으로 계산하여 시장 상황에 맞게 스스로 조정되며, 노이즈는 줄이고 중요한 추세는 선명하게 포착합니다. 또한 볼륨 확인 시스템을 통해 높은 확률의 매매 시점을 정확하게 식별할 수 있도록 도와줍니다.
─────────────────────────────────────
◆ 주요 특징
• 적응형 이동평균: 시장 상황에 따라 자동으로 조정되는 스마트한 이동평균선
• 볼륨 필터 통합: 중요한 가격 움직임을 볼륨으로 한번 더 확인
• 모멘텀 그라데이션 존: 색상 그라데이션으로 추세의 강도를 직관적으로 시각화
• 신호 확인 시스템: 여러 요소를 종합하여 신뢰도 높은 매수/매도 신호 생성
• 추세 방향 식별: 상승세와 하락세를 색상으로 명확하게 구분
• 자동 적응 기능: 다양한 시장 상황에 알아서 맞춰지는 지능형 설계
─────────────────────────────────────
◆ 기술적 기반
■ AMA 계산 원리
• 효율성 비율 (ER): 가격이 얼마나 효율적으로 한 방향으로 움직이는지 측정
• 동적 평활화 계수: 시장 상황에 따라 빠르거나 느리게 자동 조절되는 계수
• 적응형 알고리즘: 횡보장에서는 둔감하게, 추세장에서는 민감하게 반응
• 노이즈 감소 기능: 무의미한 가격 움직임은 걸러내고 중요한 신호만 포착
■ 모멘텀 벡터 구현
• 추세-가격 거리 계산: AMA와 현재 가격 사이의 거리로 추세 강도 측정
• 색상 그라데이션: 추세 강도에 비례하여 색상 농도가 변하는 시각화 시스템
• ATR 기반 조정: 시장 변동성에 맞춰 그라데이션 영역 너비 자동 조절
• 방향성 색상 구분: 상승세는 파란색/청록색, 하락세는 빨간색으로 직관적 표시
─────────────────────────────────────
◆ 실용적 응용
■ 가격 추세 해석
• 추세 방향 판단:
▶ 가격이 AMA 위에 있고 파란색 그라데이션이 보이면 상승 모멘텀 진행 중
▶ 가격이 AMA 아래에 있고 빨간색 그라데이션이 보이면 하락 모멘텀 진행 중
• 모멘텀 강도 확인:
▶ 그라데이션 색상이 진할수록 모멘텀이 강하고 추세가 건강함을 의미
▶ 그라데이션 색상이 옅을수록 모멘텀이 약해지고 있으며 반전 가능성 시사
■ 트레이딩 전략 활용
• 추세 추종 전략:
▶ 가격이 AMA를 상향 돌파하고 볼륨이 증가하면 매수 신호
▶ 가격이 AMA를 하향 돌파하고 볼륨이 증가하면 매도 신호
• 모멘텀 확인 트레이딩:
▶ 진한 그라데이션은 추세 지속 가능성이 높음을 의미하므로 진입 확신 강화
▶ 여러 캔들이 연속해서 AMA 한쪽에 머물면 추세의 신뢰도가 높아짐
─────────────────────────────────────
◆ 고급 설정 옵션
■ 인풋 파라미터 가이드
• 빠른 기간 (Fast Period) (기본값: 2)
▶ 1-2: 가격 변화에 매우 빠르게 반응합니다. 단기 거래에 적합합니다.
▶ 3-5: 적당히 반응하여 잦은 신호를 줄여줍니다.
▶ 6-10: 반응이 느리지만 더 확실한 추세만 포착합니다.
• 느린 기간 (Slow Period) (기본값: 30)
▶ 20-25: AMA가 더 빠르게 움직입니다. 짧은 시간 거래에 좋습니다.
▶ 26-35: 균형 잡힌 속도로 대부분의 시장 상황에 적합합니다.
▶ 36-50: AMA가 천천히 움직여 장기 추세를 부드럽게 따라갑니다.
• 효율성 비율 기간 (Efficiency Ratio Period) (기본값: 10)
▶ 5-8: 최근 가격 움직임에 더 집중합니다. 변화에 빠르게 반응합니다.
▶ 9-12: 균형 잡힌 기간으로 대부분의 상황에 적합합니다.
▶ 13-20: 더 긴 기간의 가격 움직임을 고려하여 일시적인 변동을 무시합니다.
• 볼륨 평균 기간 (Volume Average Period) (기본값: 20)
▶ 10-15: 최근 10-15일의 평균 볼륨과 비교합니다. 변화에 민감합니다.
▶ 16-25: 지난 약 한 달간의 평균 볼륨과 비교합니다. 균형 잡힌 설정입니다.
▶ 26-50: 장기 평균 볼륨과 비교하여 정말 큰 볼륨 변화만 포착합니다.
• 볼륨 임계값 승수 (Volume Threshold Multiplier) (기본값: 1.2)
▶ 1.0-1.1: 평균보다 약 10% 정도만 높아도 유효한 볼륨으로 인정합니다.
▶ 1.2-1.5: 평균보다 20~50% 높은 볼륨을 요구합니다(예: 1.2는 평균의 120%).
▶ 1.6-2.0: 평균의 최소 1.6배(160%) 이상 되는 매우 높은 볼륨만 인정합니다.
■ 타임프레임별 추천 설정
• 짧은 시간 차트 (5분-1시간):
빠른 기간 2, 느린 기간 20, 효율성 비율 기간 8
→ 가격 변화에 빠르게 반응하며 단타에 적합합니다.
• 중기 차트 (4시간-일봉):
빠른 기간 2, 느린 기간 30, 효율성 비율 기간 10
→ 일반적인 스윙 트레이딩에 가장 균형 잡힌 설정입니다.
• 장기 차트 (일봉-주봉):
빠른 기간 2, 느린 기간 40, 효율성 비율 기간 14
→ 더 긴 추세를 매끄럽게 추적하는 데 최적화되었습니다.
■ 시장별 추천 설정
• 주식 시장:
볼륨 임계값 1.2, 볼륨 평균 기간 20
→ 평균보다 20% 많은 볼륨이 있을 때 신호가 유효합니다.
• 외환 시장:
볼륨 임계값 1.5, 효율성 비율 기간 12
→ 외환은 볼륨이 더 높아야 의미가 있으며, 약간 더 긴 효율성 측정이 필요합니다.
• 암호화폐 시장:
볼륨 임계값 1.3, 빠른 기간 2, 느린 기간 25
→ 변동성이 큰 암호화폐에 최적화된 설정입니다.
─────────────────────────────────────
◆ 다른 지표와의 시너지
• 이동평균선: AMA와 주요 이동평균선이 같은 방향을 가리킬 때 추세 신뢰도 상승
• RSI/스토캐스틱: 과매수/과매도 구간에서 AMA 교차 발생 시 강력한 반전 신호
• MACD: MACD 히스토그램 방향 변화와 AMA 교차가 일치하면 신호 확률 대폭 증가
• 볼린저 밴드: AMA가 볼린저 밴드 내에서 어떤 위치에 있는지로 추세 강도 판단
• 지지/저항 레벨: 중요 가격대에서 AMA 돌파 시 성공 확률이 크게 증가
─────────────────────────────────────
◆ 결론
AMA Momentum Vector는 적응형 이동평균의 고급 기능과 모멘텀 시각화 기술을 결합하여 정확한 가격 추세 분석을 제공합니다.
자체 조정 알고리즘으로 시시각각 변하는 시장 환경에 완벽하게 적응하며, 볼륨 확인 시스템을 통해 신뢰도 높은 매매 신호를 생성합니다.
사용자는 간단한 파라미터 조정으로 자신의 거래 스타일과 시장 상황에 맞게 지표를 최적화할 수 있어, 가격 방향, 모멘텀 강도, 볼륨 확인을 종합적으로 고려한 효과적인 거래 결정을 내릴 수 있습니다.
─────────────────────────────────────
※ 면책 조항: 과거 성과가 미래 결과를 보장하지 않습니다. 항상 적절한 리스크 관리 전략을 사용하세요.
Expansion Triangle [TradingFinder] MegaPhone Broadening🔵 Introduction
The Expanding Triangle, also known as the Broadening Formation, is one of the key technical analysis patterns that clearly reflects growing market volatility, increasing indecision among participants, and the potential for sharp price explosions.
This pattern is typically defined by a sequence of higher highs and lower lows, forming within two diverging trendlines. Unlike traditional triangles that converge to a breakout point, the expanding triangle pattern becomes wider over time, leaving no precise apex for a breakout to occur.
From a price action perspective, the pattern represents a prolonged tug-of-war between buyers and sellers, where neither side has taken control yet. Each aggressive swing opens the door to new opportunities whether it's a trend reversal, range trading, or a momentum breakout. This dual nature makes the pattern highly versatile across market conditions, from exhausted trend ends to volatile consolidation zones.
The custom-built indicator for this pattern uses a combination of smart algorithms and detailed analysis of swing dynamics to automatically detect expanding triangles and highlight low-risk entry points.
Traders can use this tool to capitalize on high-probability setups from shorting near the upper edge of the structure with confirmation, to trading bearish breakouts during trend continuations, or entering long positions near the lower boundary during bullish reversals. The chart examples included in this article demonstrate these three highly practical trading scenarios in live market conditions.
A major advantage of this indicator lies in its structural filtering engine, which analyzes the behavior of each price leg in the triangle. With four adjustable filter levels from Very Aggressive, which highlights all potential patterns, to Very Defensive, which only triggers when price actually touches the triangle's trendlines the indicator ensures that only structurally sound and verified setups appear on the chart, reducing noise and false signals significantly.
Long Setup :
Short Setup :
🔵 How to Use
The pattern typically forms in conditions of heightened uncertainty and volatility, where price swings generate a series of higher highs and lower lows. The expanding triangle consists of three key legs bounded by diverging trendlines. The indicator intelligently analyzes each leg's direction and angle to determine whether a valid pattern is forming.
At the core of the indicator’s logic is its leg filtering system, which controls the quality of the pattern and filters out weak or noisy setups. Four structural filter modes are available to suit different trading styles and risk preferences. In Very Aggressive mode, filters are disabled, and the indicator detects any pattern purely based on the sequence of swing points.
This mode is ideal for traders who want to see everything and apply their own discretion.
In Aggressive mode, the indicator checks whether each new leg extends no more than twice the length of the previous one. If a leg overshoots excessively, the structure is invalidated.
In Defensive mode, the filter enforces a minimum movement requirement each leg must move at least 2% of the previous one. This prevents the formation of shallow, weak patterns that visually resemble triangles but lack substance.
The strictest setting, Very Defensive, combines all previous filters and additionally requires the price to physically touch the triangle’s trendlines before issuing a signal. This ensures that setups only appear when real market interaction with key structural levels has occurred, not based on assumptions or geometry alone. This mode is ideal for traders seeking maximum precision and minimal risk.
🟣 Bullish Setup
A bullish setup within the Expanding Triangle pattern occurs when price revisits the lower support boundary after a series of broad swings typically near the third leg of the formation. This area often represents a shift in momentum, where sellers begin to lose strength and buyers prepare to take control.
Ideally, the setup is accompanied by a bullish reversal candle (e.g. doji, pin bar, or engulfing) near the lower trendline. If the Very Defensive filter is active, the indicator will only issue a signal if price makes a confirmed touch on the trendline and reacts from that level. This significantly improves signal accuracy and filters out premature entries.
After confirmation, traders may choose to enter a long position on the bullish candle or shortly afterward. A logical stop-loss is placed just below the recent swing low within the pattern. The target can be set at or near the upper trendline, or projected using the full height of the triangle added to the breakout point. On higher timeframes, this reversal often marks the beginning of a strong uptrend.
🟣 Bearish Setup
A bearish setup forms when price climbs toward the upper resistance trendline, usually as the third leg completes. This is where buyers often begin to show exhaustion, and sellers step in with strength providing an ideal low-risk entry point for short positions.
As with the bullish setup, if the Candle Confirmation filter is enabled, the indicator will only show a signal when a bearish reversal candle forms at the point of contact. If Defensive or Very Defensive filters are also active, the setup must meet strict criteria of proportionate leg movement and an actual trendline touch to qualify.
Once confirmed, traders can enter on the reversal candle, placing a stop-loss slightly above the recent high. The target can be set at the lower trendline or calculated based on the triangle's full height, projected downward. This setup is particularly useful at the end of weak bullish trends or in volatile market tops.
🔵 Settings
🟣 Logic Settings
Pivot Period : Defines how many bars are analyzed to identify swing highs and lows. Higher values detect larger, slower structures, while lower values respond to faster patterns. The default value of 13 offers a balanced sensitivity.
Pattern Filter :
Very Aggressive : Detects all patterns based on point sequence with no structural checks.
Aggressive : Ensures each leg is no more than 2x the size of the previous one.
Defensive : Requires each leg to be at least 2% the size of the previous leg.
Very Defensive : The strictest level; only confirms patterns when price touches trendlines.
Candle Confirmation : When enabled, the indicator requires a valid confirmation candle (doji, pin bar, engulfing) at the interaction point with the trendline before issuing a signal. This reduces false entries and improves entry precision.
🟣 Alert Settings
Alert : Enables alerts for SSS.
Message Frequency : Determines the frequency of alerts. Options include 'All' (every function call), 'Once Per Bar' (first call within the bar), and 'Once Per Bar Close' (final script execution of the real-time bar). Default is 'Once per Bar'.
Show Alert Time by Time Zone : Configures the time zone for alert messages. Default is 'UTC'.
🔵 Conclusion
The Expanding Triangle pattern, with its wide structure and volatility-driven nature, represents chaos but also opportunity. For traders who can read its behavior, it provides some of the most powerful setups for reversals, breakouts, and range-based trades. While the pattern may seem messy at first glance, it is built on clear logic and when properly detected, it offers high-probability opportunities.
This indicator doesn’t just draw expanding triangles it intelligently evaluates their structural quality, validates price interaction through candle confirmation, and allows the trader to fine-tune the detection logic through adjustable filter levels. Whether you’re a reversal trader looking for a turning point, or a breakout trader hunting momentum, this tool adapts to your strategy.
In volatile or uncertain markets, where fakeouts and sudden shifts are common, this indicator can become a cornerstone of your trading system helping you turn volatility into structured, high-quality opportunities.

Machine Learning Key Levels [AlgoAlpha]🟠 OVERVIEW
This script plots Machine Learning Key Levels on your chart by detecting historical pivot points and grouping them using agglomerative clustering to highlight price levels with the most past reactions. It combines a pivot detection, hierarchical clustering logic, and an optional silhouette method to automatically select the optimal number of key levels, giving you an adaptive way to visualize price zones where activity concentrated over time.
🟠 CONCEPTS
Agglomerative clustering is a bottom-up method that starts by treating each pivot as its own cluster, then repeatedly merges the two closest clusters based on the average distance between their members until only the desired number of clusters remain. This process creates a hierarchy of groupings that can flexibly describe patterns in how price reacts around certain levels. This offers an advantage over K-means clustering, since the number of clusters does not need to be predefined. In this script, it uses an average linkage approach, where distance between clusters is computed as the average pairwise distance of all contained points.
The script finds pivot highs and lows over a set lookback period and saves them in a buffer controlled by the Pivot Memory setting. When there are at least two pivots, it groups them using agglomerative clustering: it starts with each pivot as its own group and keeps merging the closest pairs based on their average distance until the desired number of clusters is left. This number can be fixed or chosen automatically with the silhouette method, which checks how well each point fits in its cluster compared to others (higher scores mean cleaner separation). Once clustering finishes, the script takes the average price of each cluster to create key levels, sorts them, and draws horizontal lines with labels and colors showing their strength. A metrics table can also display details about the clusters to help you understand how the levels were calculated.
🟠 FEATURES
Agglomerative clustering engine with average linkage to merge pivots into level groups.
Dynamic lines showing each cluster’s price level for clarity.
Labels indicating level strength either as percent of all pivots or raw counts.
A metrics table displaying pivot count, cluster count, silhouette score, and cluster size data.
Optional silhouette-based auto-selection of cluster count to adaptively find the best fit.
🟠 USAGE
Add the indicator to any chart. Choose how far back to detect pivots using Pivot Length and set Pivot Memory to control how many are kept for clustering (more pivots give smoother levels but can slow performance). If you want the script to pick the number of levels automatically, enable Auto No. Levels ; otherwise, set Number of Levels . The colored horizontal lines represent the calculated key levels, and circles show where pivots occurred colored by which cluster they belong to. The labels beside each level indicate its strength, so you can see which levels are supported by more pivots. If Show Metrics Table is enabled, you will see statistics about the clustering in the corner you selected. Use this tool to spot areas where price often reacts and to plan entries or exits around levels that have been significant over time. Adjust settings to better match volatility and history depth of your instrument.

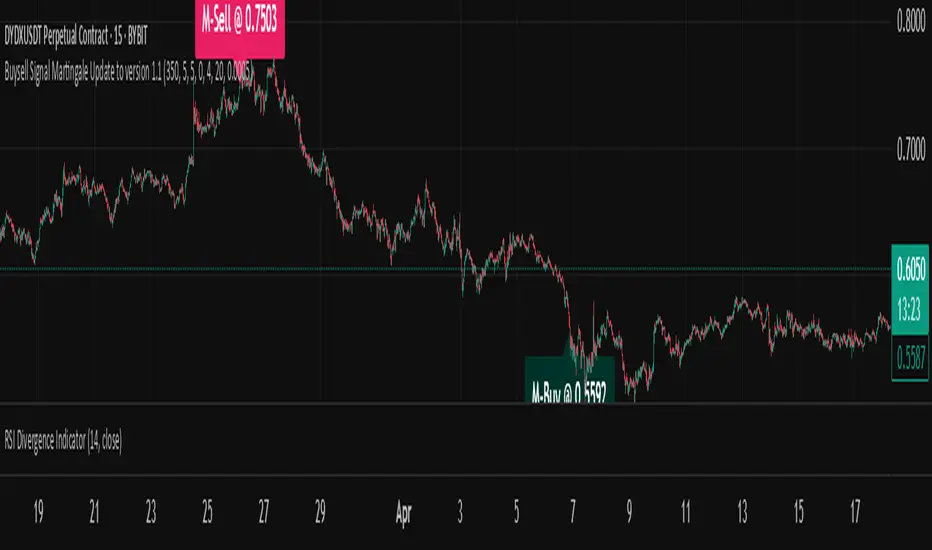
Buysell Martingale Signal - CustomBuysell Martingale Signal - Custom Indicator
Introduction:
This indicator provides a dynamic buy and sell signal system incorporating an adaptive Martingale logic. Built upon the signalLib_yashgode9/2 library, it is designed for use across various markets and timeframes.
Key Features:
Primary Buy & Sell Signals: Identifies initial buy and sell opportunities based on directional changes derived from the signalLib.
Martingale Signals:
For Short (Sell) Positions: A Martingale Sell signal is triggered when the price moves against the existing short position by a specified stepPercent from the last entry price, indicating a potential opportunity to average down or increase position size.
For Long (Buy) Positions: Similarly, a Martingale Buy signal is triggered when the price moves against the existing long position by a stepPercent from the last entry price.
On-Chart Labels: Displays clear, customizable labels on the chart for primary Buy, Sell, Martingale Buy, and Martingale Sell signals.
Customizable Colors: Allows users to set distinct colors for primary signals and Martingale signals for better visual distinction.
Adjustable Sensitivity: Features configurable parameters (DEPTH_ENGINE, DEVIATION_ENGINE, BACKSTEP_ENGINE) to fine-tune the sensitivity of the underlying signal generation.
Webhook Support (Static Message Alerts): This indicator provides alerts with static messages for both primary and Martingale buy/sell signals. These alerts can be leveraged for automation by external systems (such as trading bots or exchange-provided Webhook Signal Trading services).
Important Note: When using these alerts for automation, an external system is required to handle the complex Martingale logic and position management (e.g., tracking steps, PnL calculation, hedging, dynamic quantity sizing), as this indicator solely focuses on signal generation and sending predefined messages.
How to Use:
Add the indicator to your desired chart.
Adjust the input parameters in the indicator's settings to match your specific trading symbol and timeframe.
For automation, you can set up TradingView alerts for the Buy Signal (Main/Martingale) and Sell Signal (Main/Martingale) conditions, pointing them to your preferred Webhook URL.
Configurable Parameters:
DEPTH_ENGINE: (e.g., 30) Controls the depth of analysis for the signal algorithm.
DEVIATION_ENGINE: (e.g., 5) Defines the allowable deviation for signal generation.
BACKSTEP_ENGINE: (e.g., 5) Specifies the number of historical bars to look back.
Martingale Step Percent: (e.g., 0.5) The percentage price movement against the current position that triggers a Martingale signal.
Labels Transparency: Adjusts the transparency of the on-chart signal labels.
Buy-Color / Sell-Color: Sets the color for primary Buy and Sell signal labels.
Martingale Buy-Color / Martingale Sell-Color: Sets the color for Martingale Buy and Sell signal labels.
Label size: Controls the visual size of the labels.
Label Offset: Adjusts the vertical offset of the labels from the candlesticks.
Risk Warning:
Financial trading inherently carries significant risk. Martingale strategies are particularly high-risk and can lead to substantial losses or even complete liquidation of capital if the market moves strongly and persistently against your position. Always backtest thoroughly and practice with a demo account, fully understanding the associated risks, before engaging with real capital.
Visual ProwessVisual Prowess: Ultimate Visual of Price Action Indicator
Overview
Visual Prowess is a Pine Script indicator that integrates Trend, Momentum, Strength/Weakness, Money Flow, and Volatility into a single, intuitive interface. Scaled from 0 to 100, it provides traders with clear bullish (>50) and bearish (<50) zones. Visual Prowess is made up of several data components which will be explained below. All these components have custom thresholds that lead to Green Dot Buy Signals and Red Dot sell signals. Designed for multi-timeframe analysis, it helps traders anticipate market moves with precision seeing behind the scenes of price action.
The fundamental inputs of price action are made up of different variables -- the components of Trend Strength, Volatility, Momentum, Money Flow/Volume and Overbought/Oversold. These are very important inputs market makers use. From what I've learned in my trading journey (always still learning), this is the data I value most important. This is why I combined all these components into one indicator.....to be an ultimate visual—this extrapolation of different pieces of data is the Visual Prowess.
What It Does
Visual Prowess combines five key market factors into a unified score (0-100) to assess market conditions by examining the price action like an x-ray aka Visual Prowess:
• Trend Direction & Strength (Green and Red Wave) : Identifies bullish (green clouds) or bearish (red clouds) trend. This data is designed to illustrate the trend by the color, and its strength by the height (score).
How it is Calculated = Data is derived from price action-- comparing the current and previous price highs and lows to measure the strength of upward (+) or downward (-) price movements, smoothed over a period and expressed as a percentage of the price range.
• Momentum (Blue and White Wave): Tracks price acceleration via a custom momentum oscillator, displayed as blue (positive) or white (negative) waves.
How it is Calculated = Data is calculated by subtracting a longer-term exponential moving average from a shorter-term exponential moving average to measure momentum and trend direction. Momentum strength is measured by height on 0-100 score, and color dictates the trend-- Blue up, White down.
• Strength Index (Purple Line): Measures overbought/oversold conditions with a normalized index, derived from price deviation.
How it is Calculated = Strength Index is calculated by comparing the average of price gains to the average of price losses over a specified period, expressed as a value between 0 and 100 to measure momentum and identify overbought or oversold conditions.
• Money Flow: Monitors capital inflows and outflows using a modified Money Flow Index, shown as green (buying) or red (selling) circles.
How it is Calculated = The Money Flow is calculated by using price and volume data to measure buying and selling pressure, comparing positive and negative money flow over a specified period to produce a value between 0 and 100, indicating overbought or oversold conditions and more importantly where the money is moving, + or -.
• Volatility: Gauges market volatility, marked by colored crosses (blue for low, red for high). Blue illustrates low volatility which is key for big moves either + or -; red to illustrate when price action is extremely overheated either + or -.
How it is Calculated = The volatility is calculated by the creator of the BBWP The_Caretaker. This excellent work is calculated using the width of the iconic indicator the Bollinger Bands (the difference between the upper and lower bands divided by the middle band (the moving average), expressed as a percentage to show how volatile the price is relative to its recent average.
Originality
Unlike traditional multi-indicator dashboards, Visual Prowess uses a combination of specific open-source indicators which I believe to be the most important inputs in price action-- trend, momentum, strength, money flow, and volatility into an all-in-one visual ratioed on a 0-100 scale. This unique synthesis of data reduces noise, prioritizes signal alignment, and a look behind the scenes of price action to see deeper into the movement – This combination of indicators has custom thresholds, when these components in alignment with each other hit certain parameters; it leads to key custom price action signals -- Green Dot Buy and Red Dot Sell signals.
There is also a bonus indicator….. a Yellow Triangle. When you see this, it is rare and strong. It only prints when strength index reaches extreme lows at the same time volatility reaches extreme highs…. It then waits to print the yellow triangle upon a third condition= which is price action is back in bullish/positive zone. This Yellow triangle is meant to be strong reversals of Macro Trend lows.
How to Use the Visual Prowess Components:
• Add to Chart: Apply Visual Prowess to any timeframe (recommended: higher timeframes 12H, 1D, 2D, 3D for optimal signals).
• Interpret Zones: Values >50 indicate bullish conditions (green background); <50 signal bearish conditions (red background).
Wait for Green Dot Buy signal for buys and Red Dot Sell signals for sells. One can read each component individually to gauge the price action and predict before the buy signal prints; all of those components merged together is what leads to the buy and sell signals. The story of what’s to come can be seen at lower timeframes before the higher timeframes print, that is a key way to gauge projections of bull or bear prints to come.
HOW TO READ EACH DATA COMPONENT
TREND CLOUDS: Green/red clouds show trend direction; vivid colors tied to number/ score on the 0-100 scale indicate strength of the trend.
Bull Conditions
Green cloud illustrates the trend is bullish. The height is correlated to the trend’s strength—this height is also aligned with colors, more transparent green is weak, then it gets more opaque being medium strength, and the most vibrant is the strongest. How to ride the bull condition is by seeing this transformation of trend get from weak to strong, until it tops out and the wave points down losing strength which alludes to the bear condition.
Bear Conditions
Vice versa with the bear condition. Different shades of red tie into the strength of the bear trend. How to read when things are about to get bearish, is by seeing bull trend shift levels of strength (Example- medium to weak). This transition of bull strength getting weaker is the start, once it gets to weak bear it has commenced until bearish strength tops out before it begins to get weaker leading to the next bull phase.
MOMENTUM WAVES: Blue waves above 50 suggest bullish momentum; white waves below 50 warn of bearish shifts.
Bull Conditions
Good to look at flips of white wave to blue in bearish zones to see the tide turning= guaranteed bullish when safely gets above and holds above 50 zone.
Bear Conditions
Vice versa for Bearish side of this momentum wave being blue wave turning white in bullish zone aiming down to break below 50 zone to confirm bearish descent.
STRENGTH INDEX: Values >80 indicate overbought; <20 suggest oversold. Look for “Bull” or “Bear” labels for divergences.
Bull Conditions
Above 50 level is key, so seeing price action break from below 50 to above 50 is strong buy condition until it gets overbought.
Bear Conditions
Once conditions are too overbought and falling making lower lows (especially when price action is climbing or staying sideways) it is indicating strength is getting weaker. When this indicator fights 50 level and breaks down below 50 level bearish conditions are coming until it gets to an oversold level.
MONEYFLOW: Green circles signal buying pressure; red circles indicate selling.
Bull Conditions
Green circles show money flow is positive so that’s a good sign of upward price action to come, and again above 50 level is bullish conditions
Bear Conditions
Red circles show money flow is negative so that’s a bad sign of price action to come, pointing down and breaking below 50 level is no good. It can have corrections in bullish scenario keep in mind seeing red doesn’t mean trend is over z9could be in higher low scenario).
VOLATILITY: Blue crosses (<25% volatility) suggest breakout potential; red crosses (>75%) warn of overheated markets.
Bull Conditions
This is a very important indication. Big volatile moves can move either direction + or -. When all other components look positive/bullish and this is signalling blue crosses it means a big move is coming and will most likely be in the upward direction –If all other components align/lean bullish.
Another bullish scenario is when price action is down large and red crosses are forming. This indicates that the downward move is overheated (red x’s are rare). This extremely oversold condition can be great buying opportunities when volatility is hot printing red x’s.
Bear Conditions
When all other components look negative/bearish and this is signalling blue crosses it means a big move is coming and will most likely be in the downward direction –If all other components align/lean bearish.
Another bearish scenario is when price action is up large and red crosses are forming. This indicates that the upward move is overheated (red x’s are rare). This extremely overbought condition can be great selling opportunities when volatility is hot printing red x’s.
*****All these components in alignment of hitting each pertaining important threshold--is what prints the green dot and sell signals to trade by. It is not black and white; each component has a sweet spot fine tuned to be triggered through analysis of what is happening individually to each component and how it is reacting to the price action data.
EXAMPLE= Taking a look at the screenshot (Perfect Scenario)
Bullish Examination
- Taking a look at the 2-D timeframe on BTC
x>50
x= all components traveling to the bullish zone. Blue wave, Strength Index with bullish divergence accumulation, Money Flow Positive with Green Trend Wave starting, with teal low volatility cross→→→ leads to Green Dot Buy Signal print…. And the big rise speaks for itself with price action and the big mountain wave of the Green Trend Wave.
This rise leads to
↓↓↓↓
Bearish Examination
Strength Index gets really high at 80 scale, Red X’s showing extremely heated Volatility, Money Flow turning red and sloping down, Trend Wave peaking starting to roll over, Blue Momentum Wave transitioning to white, bearish divergence of price action related to Strength Index→→→ leads to Red Dot Sell Signal print… and the flush speaks for itself when all components fall below 50 level with Trend wave turning red
All this is forecasted in the data, showing weakness before weakness and showing strength before strength. It works because every single piece of important elements in data of price action is incorporated in this all-in-one indicator…. Which leads to the reasoning of me calling this indicator the Visual Prowess, for its unprecedent sharpness of visual observation.
****This is a passion script incorporating every piece of data I value important when reading a chart — to see current perspective of a chart and to help foresee future projection of direction Up or Down. Any community feedback is greatly appreciated. Ongoing work will be done on this script as new thoughts and fine tuning will continuously be done for infinity, as this is my personal go to model for data on the markets.

Trailing Stop Loss [TradingFinder] 4 Machine Learning Methods🔵 Introduction
The trailing stop indicator dynamically adjusts stop-loss (SL) levels to lock in profits as price moves favorably. It uses pivot levels and ATR to set optimal SL points, balancing risk and reward.
Trade confirmation filters, a key feature, ensure entries align with market conditions, reducing false signals. In 2023 a study showed filtered entries improve win rates by 15% in forex. This enhances trade precision.
SL settings, ranging from very tight to very wide, adapt to volatility via ATR calculations. These settings anchor SL to previous pivot levels, ensuring alignment with market structure. This caters to diverse trading styles, from scalping to swing trading.
The indicator colors the profit zone between the entry point (EP) and SL, using light green for buy trades and light red for sell trades. This visual cue highlights profit potential. It’s ideal for traders seeking dynamic risk management.
A table displays real-time trade details, including EP, SL, and profit/loss (PNL). Backtests show trailing stops cut losses by 20% in trending markets. This transparency aids decision-making.
🔵 How to Use
🟣 SL Levels
The trailing stop indicator sets SL based on pivot levels and ATR, offering four options: very tight, tight, wide, or very wide. Very tight SLs suit scalpers, while wide SLs fit swing traders. Select the base level to match your strategy.
If price hits the SL, the trade closes, and the indicator evaluates the next trade using the selected filter. This ensures disciplined trade management. The cycle restarts with a new confirmed entry.
Very tight SLs, set near recent pivots, trigger exits early to minimize risk but limit profits in volatile markets. Wide SLs, shown as farther lines, allow more price movement but increase exposure to losses. Adjust based on ATR and conditions, noting SL breaches open new positions.
🟣 Visualization
The indicator’s visual cues, like colored profit zones, simplify monitoring, with light green showing the profit area from EP to trailed SL. Dashed lines mark entry points, while solid lines track the trailed SL, triggering new positions when breached.
When price moves into profit, the area between EP and SL is colored—light green for longs, light red for shorts. This highlights the profit zone visually. The SL trails price, locking in gains as the trade progresses.
🟣 Filters
Upon trade entry, the indicator requires confirmation via filters like SMA 2x or ADX to validate momentum. Filters reduce false entries, though no guarantee exists for improved outcomes. Monitor price action post-entry for trade validity.
Filters like Momentum or ADX assess trend strength before entry. For example, ADX above 25 confirms strong trends. Choose “none” for unfiltered entries.
🟣 Bullish Alert
For a bullish trade, the indicator opens a long position with a green SL Line (after optional filters), trailing the SL below price. Set alerts to On in the settings for notifications, or Off to monitor manually.
🟣 Bearish Alert
In a bearish trade, the indicator opens a short position with a red SL Line post-confirmation, trailing the SL above price. With alerts On in the settings, it notifies the potential reversal.
🟣 Panel
A table displays all trades’ details, including Win Rates, PNL, and trade status. This real-time data aids in tracking performance. Check the table to assess trade outcomes instantly.
Review the table regularly to evaluate trade performance and adjust settings. Consistent monitoring ensures alignment with market dynamics. This maximizes the indicator’s effectiveness.
🔵 Settings
Length (Default: 10) : Sets the pivot period for calculating SL levels, balancing sensitivity and reliability.
Base Level : Options (“Very tight,” “Tight,” “Wide,” “Very wide”) adjust SL distance via ATR.
Show EP Checkbox : Toggles visibility of the entry point on the chart.
Show PNL : Displays profit/loss data for active and closed trades.
Filter : Options (“none,” “SMA 2x,” “Momentum,” “ADX”) validate trade entries.
🔵 Conclusion
The trailing stop indicator, a dynamic risk management tool, adjusts SLs using pivot levels and ATR. Its confirmation filters reduce false entries, boosting precision. Backtests show 20% loss reduction in trending markets.
Customizable SL settings and visual profit zones enhance usability across trading styles. The real-time table provides clear trade insights, streamlining analysis. It’s ideal for forex, stocks, or crypto.
While filters like ADX improve entry accuracy, no setup guarantees success in all conditions. Contextual analysis, like trend strength, is key. This indicator empowers disciplined, data-driven trading.

Bitcoin Power Law OscillatorThis is the oscillator version of the script. The main body of the script can be found here.
Understanding the Bitcoin Power Law Model
Also called the Long-Term Bitcoin Power Law Model. The Bitcoin Power Law model tries to capture and predict Bitcoin's price growth over time. It assumes that Bitcoin's price follows an exponential growth pattern, where the price increases over time according to a mathematical relationship.
By fitting a power law to historical data, the model creates a trend line that represents this growth. It then generates additional parallel lines (support and resistance lines) to show potential price boundaries, helping to visualize where Bitcoin’s price could move within certain ranges.
In simple terms, the model helps us understand Bitcoin's general growth trajectory and provides a framework to visualize how its price could behave over the long term.
The Bitcoin Power Law has the following function:
Power Law = 10^(a + b * log10(d))
Consisting of the following parameters:
a: Power Law Intercept (default: -17.668).
b: Power Law Slope (default: 5.926).
d: Number of days since a reference point(calculated by counting bars from the reference point with an offset).
Explanation of the a and b parameters:
Roughly explained, the optimal values for the a and b parameters are determined through a process of linear regression on a log-log scale (after applying a logarithmic transformation to both the x and y axes). On this log-log scale, the power law relationship becomes linear, making it possible to apply linear regression. The best fit for the regression is then evaluated using metrics like the R-squared value, residual error analysis, and visual inspection. This process can be quite complex and is beyond the scope of this post.
Applying vertical shifts to generate the other lines:
Once the initial power-law is created, additional lines are generated by applying a vertical shift. This shift is achieved by adding a specific number of days (or years in case of this script) to the d-parameter. This creates new lines perfectly parallel to the initial power law with an added vertical shift, maintaining the same slope and intercept.
In the case of this script, shifts are made by adding +365 days, +2 * 365 days, +3 * 365 days, +4 * 365 days, and +5 * 365 days, effectively introducing one to five years of shifts. This results in a total of six Power Law lines, as outlined below (From lowest to highest):
Base Power Law Line (no shift)
1-year shifted line
2-year shifted line
3-year shifted line
4-year shifted line
5-year shifted line
The six power law lines:
Bitcoin Power Law Oscillator
This publication also includes the oscillator version of the Bitcoin Power Law. This version applies a logarithmic transformation to the price, Base Power Law Line, and 5-year shifted line using the formula: log10(x) .
The log-transformed price is then normalized using min-max normalization relative to the log-transformed Base Power Law Line and 5-year shifted line with the formula:
normalized price = log(close) - log(Base Power Law Line) / log(5-year shifted line) - log(Base Power Law Line)
Finally, the normalized price was multiplied by 5 to map its value between 0 and 5, aligning with the shifted lines.
Interpretation of the Bitcoin Power Law Model:
The shifted Power Law lines provide a framework for predicting Bitcoin's future price movements based on historical trends. These lines are created by applying a vertical shift to the initial Power Law line, with each shifted line representing a future time frame (e.g., 1 year, 2 years, 3 years, etc.).
By analyzing these shifted lines, users can make predictions about minimum price levels at specific future dates. For example, the 5-year shifted line will act as the main support level for Bitcoin’s price in 5 years, meaning that Bitcoin’s price should not fall below this line, ensuring that Bitcoin will be valued at least at this level by that time. Similarly, the 2-year shifted line will serve as the support line for Bitcoin's price in 2 years, establishing that the price should not drop below this line within that time frame.
On the other hand, the 5-year shifted line also functions as an absolute resistance , meaning Bitcoin's price will not exceed this line prior to the 5-year mark. This provides a prediction that Bitcoin cannot reach certain price levels before a specific date. For example, the price of Bitcoin is unlikely to reach $100,000 before 2021, and it will not exceed this price before the 5-year shifted line becomes relevant. After 2028, however, the price is predicted to never fall below $100,000, thanks to the support established by the shifted lines.
In essence, the shifted Power Law lines offer a way to predict both the minimum price levels that Bitcoin will hit by certain dates and the earliest dates by which certain price points will be reached. These lines help frame Bitcoin's potential future price range, offering insight into long-term price behavior and providing a guide for investors and analysts. Lets examine some examples:
Example 1:
In Example 1 it can be seen that point A on the 5-year shifted line acts as major resistance . Also it can be seen that 5 years later this price level now corresponds to the Base Power Law Line and acts as a major support at point B(Note: Vertical yearly grid lines have been added for this purpose👍).
Example 2:
In Example 2, the price level at point C on the 3-year shifted line becomes a major support three years later at point D, now aligning with the Base Power Law Line.
Finally, let's explore some future price predictions, as this script provides projections on the weekly timeframe :
Example 3:
In Example 3, the Bitcoin Power Law indicates that Bitcoin's price cannot surpass approximately $808K before 2030 as can be seen at point E, while also ensuring it will be at least $224K by then (point F).

Bitcoin Power LawThis is the main body version of the script. The Oscillator version can be found here.
Understanding the Bitcoin Power Law Model
Also called the Long-Term Bitcoin Power Law Model. The Bitcoin Power Law model tries to capture and predict Bitcoin's price growth over time. It assumes that Bitcoin's price follows an exponential growth pattern, where the price increases over time according to a mathematical relationship.
By fitting a power law to historical data, the model creates a trend line that represents this growth. It then generates additional parallel lines (support and resistance lines) to show potential price boundaries, helping to visualize where Bitcoin’s price could move within certain ranges.
In simple terms, the model helps us understand Bitcoin's general growth trajectory and provides a framework to visualize how its price could behave over the long term.
The Bitcoin Power Law has the following function:
Power Law = 10^(a + b * log10(d))
Consisting of the following parameters:
a: Power Law Intercept (default: -17.668).
b: Power Law Slope (default: 5.926).
d: Number of days since a reference point(calculated by counting bars from the reference point with an offset).
Explanation of the a and b parameters:
Roughly explained, the optimal values for the a and b parameters are determined through a process of linear regression on a log-log scale (after applying a logarithmic transformation to both the x and y axes). On this log-log scale, the power law relationship becomes linear, making it possible to apply linear regression. The best fit for the regression is then evaluated using metrics like the R-squared value, residual error analysis, and visual inspection. This process can be quite complex and is beyond the scope of this post.
Applying vertical shifts to generate the other lines:
Once the initial power-law is created, additional lines are generated by applying a vertical shift. This shift is achieved by adding a specific number of days (or years in case of this script) to the d-parameter. This creates new lines perfectly parallel to the initial power law with an added vertical shift, maintaining the same slope and intercept.
In the case of this script, shifts are made by adding +365 days, +2 * 365 days, +3 * 365 days, +4 * 365 days, and +5 * 365 days, effectively introducing one to five years of shifts. This results in a total of six Power Law lines, as outlined below (From lowest to highest):
Base Power Law Line (no shift)
1-year shifted line
2-year shifted line
3-year shifted line
4-year shifted line
5-year shifted line
The six power law lines:
Bitcoin Power Law Oscillator
This publication also includes the oscillator version of the Bitcoin Power Law. This version applies a logarithmic transformation to the price, Base Power Law Line, and 5-year shifted line using the formula: log10(x) .
The log-transformed price is then normalized using min-max normalization relative to the log-transformed Base Power Law Line and 5-year shifted line with the formula:
normalized price = log(close) - log(Base Power Law Line) / log(5-year shifted line) - log(Base Power Law Line)
Finally, the normalized price was multiplied by 5 to map its value between 0 and 5, aligning with the shifted lines.
Interpretation of the Bitcoin Power Law Model:
The shifted Power Law lines provide a framework for predicting Bitcoin's future price movements based on historical trends. These lines are created by applying a vertical shift to the initial Power Law line, with each shifted line representing a future time frame (e.g., 1 year, 2 years, 3 years, etc.).
By analyzing these shifted lines, users can make predictions about minimum price levels at specific future dates. For example, the 5-year shifted line will act as the main support level for Bitcoin’s price in 5 years, meaning that Bitcoin’s price should not fall below this line, ensuring that Bitcoin will be valued at least at this level by that time. Similarly, the 2-year shifted line will serve as the support line for Bitcoin's price in 2 years, establishing that the price should not drop below this line within that time frame.
On the other hand, the 5-year shifted line also functions as an absolute resistance , meaning Bitcoin's price will not exceed this line prior to the 5-year mark. This provides a prediction that Bitcoin cannot reach certain price levels before a specific date. For example, the price of Bitcoin is unlikely to reach $100,000 before 2021, and it will not exceed this price before the 5-year shifted line becomes relevant. After 2028, however, the price is predicted to never fall below $100,000, thanks to the support established by the shifted lines.
In essence, the shifted Power Law lines offer a way to predict both the minimum price levels that Bitcoin will hit by certain dates and the earliest dates by which certain price points will be reached. These lines help frame Bitcoin's potential future price range, offering insight into long-term price behavior and providing a guide for investors and analysts. Lets examine some examples:
Example 1:
In Example 1 it can be seen that point A on the 5-year shifted line acts as major resistance . Also it can be seen that 5 years later this price level now corresponds to the Base Power Law Line and acts as a major support at point B (Note: Vertical yearly grid lines have been added for this purpose👍).
Example 2:
In Example 2, the price level at point C on the 3-year shifted line becomes a major support three years later at point D, now aligning with the Base Power Law Line.
Finally, let's explore some future price predictions, as this script provides projections on the weekly timeframe :
Example 3:
In Example 3, the Bitcoin Power Law indicates that Bitcoin's price cannot surpass approximately $808K before 2030 as can be seen at point E, while also ensuring it will be at least $224K by then (point F).

RunRox - Entry Model🎯 RunRox Entry Model is an all-in-one reversal-pattern indicator engineered to help traders accurately identify key price-reversal points on their charts. It will be part of our premium indicator package and improve the effectiveness of your trading strategies.
The primary concept of this indicator is liquidity analysis, making it ideal for Smart Money traders and for trading within market structure. At the same time, the indicator is universal and can be integrated into any strategy. Below, I will outline the full concept of the indicator and its settings so you can better understand how it works.
🧬 CONCEPT
In the screenshot below, I’ll schematically illustrate the core idea of this indicator. It’s one of the patterns that the indicator automatically detects on the chart using a two-timeframe approach. We use the higher timeframe to identify liquidity zones, and the lower timeframe to capture liquidity removal and structure breaks. The schematic is shown in the screenshot below.
Our indicator includes three entry models in total , and I will discuss its functionality and features in more detail later in this post.
💡 FEATURES
Three entry models
PO3 HTF Bar
Entry Area
Optimization for each Entry Area
Filters
HTF FVG
Alert customization
Next, we will examine each entry model in detail.
🟠 ENTRY MODEL 1
The first model is the core one we’ll work with; all other models rely on its structure and construction. In the screenshot below, I’ll schematically show the complete model.
As shown in the screenshot above, we display higher-timeframe candles on the current chart to better visualize the entry model and keep the trader informed of what’s happening on the larger timeframe. The screenshot also highlights both the Long and Short models, as well as the Entry Area, which I will explain in more detail below.
The schematic model on the lower timeframe is shown in the screenshot above. It illustrates that after the Entry Model forms, we draw the Entry Area on the next candle and wait for a price pullback into this zone for the optimal trade entry. Statistically, before moving higher, the price typically revisits the Entry Area, covering the imbalances created by MSS; thus, the Entry Area represents the ideal entry point.
🟩 Entry Area
Once the Entry Model has formed, we focus on identifying the optimal pullback zone for taking a position. To determine which retracement area performs best, we conducted extensive historical backtesting on potential zones and selected those that consistently delivered the strongest results. This process yields Entry Areas with the highest probability of a successful reversal.
On the screenshot above, you can see an example of the Entry Area and which zones carry a higher versus lower probability of reversal. Zones rendered with greater transparency have historically delivered weaker results than the more opaque zones. The deeper-colored areas represent the optimal entry zones and can improve your risk-reward ratio by allowing you to enter at more favorable prices.
It’s important to remember that the entire Entry Area functions as a potential zone for scaling into a position. However, if your risk-to-reward ratio isn’t favorable, you can wait for the price to retrace to lower levels within the Entry Area and enter with a more attractive risk-to-reward.
🟢 Pattern Rating
Each entry model receives a rating in the form of green circles next to its name 🟢. The rating ranges from one to four circles, based on the historical performance of similar patterns. To calculate this rating, we backtest past data by analyzing candle behavior during the model’s formation and assign circles according to how similar patterns performed historically.
Example Ratings:
🟢 – One circle
🟢🟢 – Two circles
🟢🟢🟢 – Three circles
🟢🟢🟢🟢 – Four circles
The more green circles a model has, the more reliable it is—but it’s crucial to rely on your own analysis when identifying strong reversal points on the chart. This rating reflects the model’s historical performance and does not guarantee future results, so keep that in mind!
Below is a screenshot showing four model variations with different ratings on the chart.
⚠️ Unconfirmed Pattern
Entry Model 1 is designed so that, until the higher-timeframe candle closes, the pattern remains unconfirmed and is hidden on the chart. For traders who prefer to see setups as they form, there’s a dedicated feature that displays the unconfirmed pattern at the moment of its appearance - triggered by the Market Structure Shift - before the HTF candle closes. The screenshot below shows what the pattern looks like prior to confirmation.
‼️IMPORTANT: Until the pattern is confirmed and the higher-timeframe candle has closed, the model may disappear from the chart if price reverses and the HTF candle closes below the previous bar. Therefore, this mode is suitable only for experienced traders who want to see market moves in advance. Remember that the pattern can be removed from the chart, so we recommend waiting for the HTF candle to close before deciding to enter a trade.‼️
✂️ Filters
For the primary model, there are four filters designed to enhance entry points or exclude less-confirmed patterns. The filters available in the indicator are:
Bounce Filter
Market Shift Mode
Same Wave Filter
Only with Divergence
I will explain how each of these filters works below.
- Bounce Filter
The Bounce Filter identifies significant deviations of price from its mean and only displays the Entry Model once the asset’s price moves beyond the average level. The screenshot below illustrates how this appears on the chart.
The actual average-price calculation is more sophisticated than what’s shown in the screenshot, that image is just an illustrative example. When the price deviates significantly from the N-bar average, we start looking for the Entry Model. This approach works particularly well in range-bound markets without a clear trend, as it lets you trade strong deviations from the mean.
- Market Shift Mode
This filter works by detecting the initial impulse that triggered the liquidity sweep on the previous higher-timeframe candle, and then holding the Market Structure Shift level at that point after the sweep. If the filter is turned off, price may move higher following the liquidity removal, creating a new MSS level and potentially producing a false structure shift and entry signal on the formed model.
This filter helps you more accurately identify genuine shifts - but keep in mind that the model can still perform well without it, so choose the setting that best suits your trading style.
- Same Wave Filter
The Same Wave Filter removes entry models that form without a clear lower-timeframe structure when liquidity is swept from the previous higher-timeframe candle. In other words, if the prior HTF candle and the current one belong to the same impulse wave - without any retracements on the LTF - the model is filtered out.
Keep in mind that this filter may also exclude patterns that could have produced positive results, so whether to enable it depends on your trading system.
- Only with Divergence
The Only with Divergence filter detects divergence between the lows of successive candles and indicators like RSI. When the low that swept liquidity diverges from the previous candle’s low, the indicator displays a “DIV” label. Although RSI is cited as an example, our divergence calculation is more advanced. This filter highlights patterns where low divergence signals genuine liquidity manipulation and a likely aggressive price reversal.
🌀 Model Settings
Trade Direction: Choose whether to display models for Long or Short trades.
Fractal: Select between automatic fractal detection—which adapts the lower-timeframe (LTF) and higher-timeframe (HTF) candles—or Custom.
Custom Fractal: When Custom is selected, manually specify the LTF and HTF timeframes used to detect the patterns.
History Pattern Limit: Set the maximum number of patterns to display on the chart to keep it clean and uncluttered.
🎨 Model Style
You can flexibly customize the model’s appearance by choosing your preferred line thickness, color, and the other settings we discussed above.
🔵 ENTRY MODEL 2
This model appears under specific conditions when Model 1 cannot form. It’s a price-reversal model constructed according to different rules than the first model. The screenshot below shows how it looks on the chart.
This model forms less frequently than Model 1 but delivers equally strong performance and is displayed as a position-entry zone.
Like the Entry Area in Entry Model 1, this zone is calculated automatically and highlights the best entry levels: areas that showed the strongest historical results are rendered in a brighter shade.
🎨 Model Style
You can flexibly customize the style of Entry Model 2 - its color, opacity, visibility, and the average price of the previous candle.
🟢 ENTRY MODEL 3
Entry Model 3 is a continuation pattern that only forms after Entry Model 1 has completed and delivered the necessary price move to trigger Model 3.
Below is a schematic illustration of how Model 3 is intended to work.
🎨 Model Style
As with the previous models, you can flexibly customize the style of this zone.
⬆️ HTF CANDLES
One of the standout features of this indicator is the ability to plot higher-timeframe (HTF) candles directly on your lower-timeframe (LTF) chart, giving you clear visualization of the entry models and insight into what’s unfolding on the larger timeframe.
You can fully customize the HTF candles - select their style, the number of bars displayed, and tweak various settings to match your personal trading style.
HTF FVG
Fair Value Gaps (FVGs) can also be drawn on the HTF candles themselves, enabling you to spot key liquidity or interest zones at a glance, without switching between timeframes.
Additionally, you can view all significant historical HTF highs and lows, with demarcation lines showing where each HTF candle begins and ends.
All these options let you tailor the HTF candle display on your chart and monitor multiple timeframes’ trends in a single view.
📶 INFO PANEL
Instrument: the market symbol on which the model is detected
Fractal Timeframes: the LTF and HTF fractal periods used to locate the pattern
HTF Candle Countdown: the time remaining until the higher-timeframe candle closes
Trade Direction: the direction (Long or Short) in which the model is searched for entry
🔔 ALERT CUSTOMIZATION
And, of course, you can configure any alerts you need. There are seven alert types available:
Confirmed Entry Model 1
Unconfirmed Entry Model 1
Confirmed Entry Model 2
Confirmed Entry Model 3
Entry Area 1 Trigger
Entry Area 2 Trigger
Entry Area 3 Trigger
You also get a custom macro field where you can enter any placeholders to fully personalize your alerts. Below are example macros you can use in that field.
{{event}} - Event name ('New M1')
{{direction}} - Trade direction ('Long', 'Short')
{{area_beg}} - Entry Area Price
{{area_end}} - Entry Area Price
{{exchange}} - Exchange ('Binance')
{{ticker}} - Ticker ('BTCUSD')
{{interval}} - Timeframe ('1s', '1', 'D')
{{htf}} - High timeframe ('15', '60', 'D')
{{open}}-{{close}}-{{high}}-{{low}} - Candle price values
{{htf_open}}-{{htf_close}}-{{htf_high}}-{{htf_low}} - Last confirmed HTF candle's price
{{volume}} - Candle volume
{{time}} - Candle open time in UTC timezone
{{timenow}} - Signal time in UTC timezone
{{syminfo.currency}} - 'USD' for BTCUSD pair
{{syminfo.basecurrency}} - 'BTC' for BTCUSD pair
✅ USAGE EXAMPLES
Now I’ll demonstrate several ways to apply this indicator across different trading strategies.
Primarily, it’s most effective within the Smart Money framework - where liquidity and manipulation are the core focus - so it integrates seamlessly into your SMC-based approach.
However, it can also be employed in other strategies, such as classic technical analysis or Elliott Wave, to capitalize on reversal points on the chart.
Example 1
The first example illustrates forming a downtrend using a Smart Money strategy. After the market structure shifts and the first BOS is broken, we begin looking for a short entry.
Once Entry Model 1 is established, a Fair Value Gap appears, which we use as our position-entry zone. The nearest target becomes the newly formed BOS level.
In this trade, it was crucial to wait for a strong downtrend to develop before hunting for entries. Therefore, we waited for the first BOS to break and entered the trade to ride the continuation of the downtrend down to the next BOS level.
Example 2
The next example illustrates a downtrend developing with a Fair Value Gap on the 1-hour timeframe. The FVG is also displayed directly on the HTF candles in the chart.
The pattern forms within the HTF Fair Value Gap, indicating that we can balance this inefficiency and ride the continuation of the downtrend.
The target can simply be a 1:2 or 1:3 risk–reward ratio, as in our case.
📌 CONCLUSION
These two examples illustrate how this indicator can be used to identify reversals or trend continuations. In truth, there are countless ways to incorporate this tool, and each trader can adapt the model to fit their own strategy.
Always remember to rely on your own analysis and only enter trades when you feel confident in them.

MissedPrice Volume Method[KiomarsRakei]█ Core Concept:
This script detects price zones that are highly likely to be revisited — areas where price moved too quickly to fully fill market activity. Using sharp volume shifts and volatility filters, the script identifies these “missed” levels and generates signals pointing toward them.
Signals are generated before price reaches the zone, allowing you to analyze price behavior both before and after the zone is touched. These zones often act like magnets for price, making them ideal for short-term.
Examples of signals and high hit rate of Missed zones
█ How It Works:
The script monitors 3-candle volume and price behavior to detect moments where volume accelerates abnormally compared to recent averages. When a potential missed zone is found and price hasn’t revisited it yet, a signal is created in advance, pointing to that zone as a likely future target.
█ Features:
Zone Visualization: Dynamic boxes show price targets based on missed volume areas.
Pre-Zone Signals: Alerts fire before price returns, offering early trade setups.
Stat Tracking System: Automatically logs signals, win rate, and average profit.
Live Performance Table: On-chart stats including hit/miss breakdown and late-return analysis.
Works on All Markets: Compatible with any chart that provides volume — crypto, forex, indices, or stocks.
A signal is considered successful when price touches the zone. However, not all zones are guaranteed to be revisited.
█ Key Inputs & Stats Table:
Volume Filters: Control signal sensitivity using min/max relative volume shift.
Zone & Line Settings: Adjust how long the zone stays visible and whether entry lines are drawn.
Custom Colors: Choose colors for buy/sell zones, lines, and visuals.
📊 Table Metrics:
Total Signals: Count of all generated signals.
Win Rate: % of signals where price returned to the zone (hit = touched the zone, regardless of timing).
Bad Signals: Signals that took too long to hit or were never hit.
Bad but Hit: Signals marked bad but eventually touched the zone.
Bad signals are marked in red. These indicate zones that price failed to reach within the expected time window, showing where the script identified a target that remained unfulfilled.

Head Hunter HHHead Hunter HH - Advanced Market Structure & Volume Analysis Indicator
This indicator combines volume analysis, price action, and VWAP to identify high-probability trading opportunities across multiple timeframes.
Key Features:
• Smart Volume Analysis: Detects institutional volume patterns using dynamic thresholds
• VWAP-Based Market Structure: Multiple standard deviation bands for precision entry/exit
• Daily Level Integration: Previous day's high, low, close, and current day's open
• Advanced Signal Classification: Regular, Super Strong, and Scalp signals
Signal Types:
1. Regular Signals (White/Purple Triangles)
• Volume-confirmed reversals
• Institutional price levels
• Technical momentum alignment
2. Super Strong Signals (Green/Red Diamonds)
• High-volume breakouts
• Strong momentum confirmation
• Multiple timeframe alignment
3. Scalp Signals (Green/Magenta Circles)
• Quick reversal opportunities
• VWAP deviation analysis
• Volume surge confirmation
Visual Components:
• VWAP with Standard Deviation Bands
• 50 MA (optional)
• Daily Reference Levels
• Color-coded signals based on strength
• Bar color changes on confirmed signals
Best Practices:
• Most effective on higher timeframes (1H+)
• Use with major pairs/instruments
• Combine signals with support/resistance
• Monitor volume confirmation
• Wait for candle close confirmation
This indicator helps identify institutional order flow and high-probability reversal zones by analyzing volume patterns, price action, and market structure, providing traders with multiple confirmation layers before entry.
Note: Results may vary based on market conditions and timeframe selection. Always use proper risk management.

AlphaSignal | MindMarketAlphaSignal — Smart Indicator for Precise Entries
What does AlphaSignal do?
AlphaSignal looks for moments when the price moves too far from its average, volume spikes, and overall market activity increases. When these things line up, it gives you a clean, high-quality trading signal — either to buy or sell.
How it works :
Activity & Volume Detection
It monitors for sudden bursts in trading volume and volatility — clear signs that something important is happening in the market.
Price Deviation with Nadaraya-Watson Envelope
The indicator uses a smooth curve (called the Nadaraya-Watson estimate) to track the average price. When price drifts too far from this curve, it might be ready to snap back. That’s where AlphaSignal starts paying attention.
Signal Rating System
Each potential trade gets a score based on:
Market activity
Volume deviation
How far price is from the NW envelope
(Optionally) Trend strength and momentum via ADX, RSI, MACD
Only if the total score is high enough — a signal is fired.
Advanced Filters (Optional)
Want more confirmation? Turn on ADX, RSI, and MACD checks to avoid weak setups during choppy, low-trend periods.
Cooldown Logic
To avoid overtrading, AlphaSignal waits a set number of bars between signals — you can customize this.
Trading Suggestions (Signal Panel)
AlphaSignal gives you real-time trading guidance with a simple suggestion box:
BUY NOW / SELL NOW
All conditions are met, rating is strong — take action.
PREPARE BUY / PREPARE SELL
No full confirmation yet, but the price is very close to key levels (within 1.5% of the NW envelope). Get ready — a signal might appear soon.
AWAIT BUY / AWAIT SELL
The market is leaning toward a buy or sell, but price isn’t in a good spot yet. Be patient and watch for better positioning.
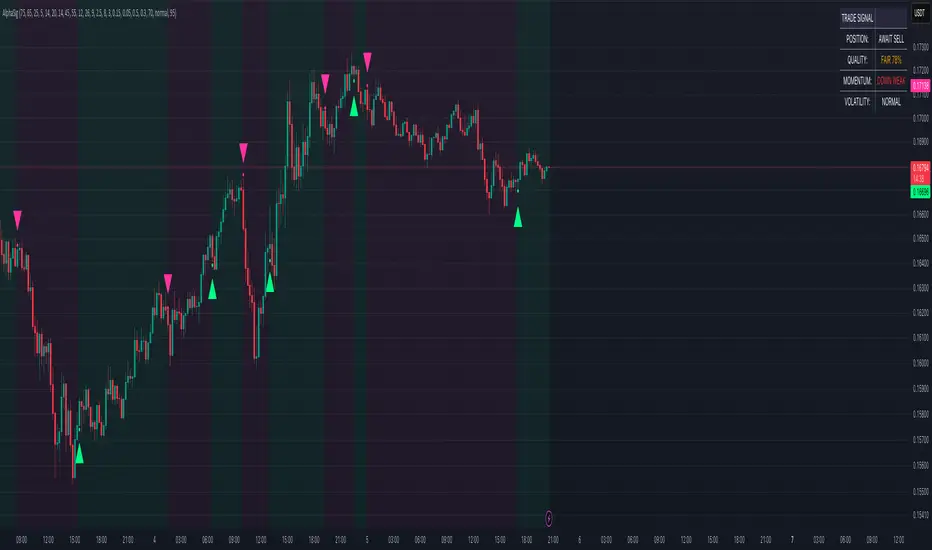
[COG]Adaptive Volatility Bands# Adaptive Volatility Bands (AVB) Indicator Guide for Traders
## Special Acknowledgment 🙌
This script is inspired by and builds upon the foundational work of **DonovanWall**, a respected contributor to the trading community. His innovative approach to adaptive indicators has been instrumental in developing this advanced trading tool.
## What is the Adaptive Volatility Bands Indicator?
The Adaptive Volatility Bands (AVB) is a sophisticated technical analysis tool designed to help traders understand market dynamics by creating dynamic, responsive price channels that adapt to changing market conditions. Unlike traditional static indicators, this script uses advanced mathematical techniques to create flexible bands that adjust to market volatility in real-time.
## Key Features and Inputs
### 1. Price and Filtering Options
- **Price Source**: Determines the base price used for calculations (default is HLC3 - Average of High, Low, and Close)
- **Filter Poles**: Controls the smoothness of the indicator (1-9 poles)
- Lower values: More responsive, more noise
- Higher values: Smoother, but slower to react
### 2. Volatility and Band Settings
- **Sample Length**: Determines how many bars are used to calculate volatility (default 144)
- **Volatility Multiplier**: Adjusts the width of the main bands (default 1.414)
- **Outer Band Multiplier**: Controls the width of the outer bands (default 2.5)
- **Inner Band Ratio**: Positions the inner bands between the center and outer bands (default 0.25)
### 3. Advanced Processing Options
- **Lag Reduction Mode**: Helps reduce indicator delay
- **Fast Response Mode**: Makes the indicator more responsive to recent price changes
### 4. Signal and Visualization Options
- **Show Entry Signals**: Displays buy and sell signals
- **Signal Display Style**: Choose between labels or shapes
- **Range Filter**: Adds an additional filter for signal validation
## How the Indicator Works
The Adaptive Volatility Bands create a dynamic price channel with three key components:
1. **Center Line**: Represents the core trend direction
2. **Inner Bands**: Closer to the center line
3. **Outer Bands**: Wider bands that show broader price potential
### Color Dynamics
- The indicator uses a smart color gradient system
- Colors change based on price position within the bands
- Helps visualize bullish (green/blue) and bearish (red) market conditions
## Trading Strategies for Beginners
### Basic Entry Signals
- **Buy Signal**:
- Price touches the center line from below
- Candle is bullish (closes higher than it opens)
- Price is above the center line
- Trend is upward
- **Sell Signal**:
- Price touches the center line from above
- Candle is bearish (closes lower than it opens)
- Price is below the center line
- Trend is downward
### Risk Management Tips
1. Use the bands to identify:
- Potential trend changes
- Volatility levels
- Support and resistance areas
2. Combine with other indicators for confirmation
3. Always use stop-loss orders
4. Adjust parameters to match your trading style and asset
## When to Use This Indicator
Best suited for:
- Trending markets
- Swing trading
- Identifying potential entry and exit points
- Understanding market volatility
### Recommended Markets
- Stocks
- Forex
- Cryptocurrencies
- Futures
## Customization
The script offers extensive customization:
- Adjust smoothness
- Change band multipliers
- Modify color schemes
- Enable/disable features like lag reduction
## Important Considerations for Beginners
🚨 **Disclaimer**:
- No indicator guarantees profits
- Always practice with a demo account first
- Learn and understand the indicator before live trading
- Market conditions change, so continually adapt your strategy
## Getting Started
1. Add the script to your TradingView chart
2. Experiment with different settings
3. Backtest on historical data
4. Start with small positions
5. Continuously learn and improve
Happy Trading! 📈🔍

Bitcoin Polynomial Regression ModelThis is the main version of the script. Click here for the Oscillator part of the script.
💡Why this model was created:
One of the key issues with most existing models, including our own Bitcoin Log Growth Curve Model , is that they often fail to realistically account for diminishing returns. As a result, they may present overly optimistic bull cycle targets (hence, we introduced alternative settings in our previous Bitcoin Log Growth Curve Model).
This new model however, has been built from the ground up with a primary focus on incorporating the principle of diminishing returns. It directly responds to this concept, which has been briefly explored here .
📉The theory of diminishing returns:
This theory suggests that as each four-year market cycle unfolds, volatility gradually decreases, leading to more tempered price movements. It also implies that the price increase from one cycle peak to the next will decrease over time as the asset matures. The same pattern applies to cycle lows and the relationship between tops and bottoms. In essence, these price movements are interconnected and should generally follow a consistent pattern. We believe this model provides a more realistic outlook on bull and bear market cycles.
To better understand this theory, the relationships between cycle tops and bottoms are outlined below:https://www.tradingview.com/x/7Hldzsf2/
🔧Creation of the model:
For those interested in how this model was created, the process is explained here. Otherwise, feel free to skip this section.
This model is based on two separate cubic polynomial regression lines. One for the top price trend and another for the bottom. Both follow the general cubic polynomial function:
ax^3 +bx^2 + cx + d.
In this equation, x represents the weekly bar index minus an offset, while a, b, c, and d are determined through polynomial regression analysis. The input (x, y) values used for the polynomial regression analysis are as follows:
Top regression line (x, y) values:
113, 18.6
240, 1004
451, 19128
655, 65502
Bottom regression line (x, y) values:
103, 2.5
267, 211
471, 3193
676, 16255
The values above correspond to historical Bitcoin cycle tops and bottoms, where x is the weekly bar index and y is the weekly closing price of Bitcoin. The best fit is determined using metrics such as R-squared values, residual error analysis, and visual inspection. While the exact details of this evaluation are beyond the scope of this post, the following optimal parameters were found:
Top regression line parameter values:
a: 0.000202798
b: 0.0872922
c: -30.88805
d: 1827.14113
Bottom regression line parameter values:
a: 0.000138314
b: -0.0768236
c: 13.90555
d: -765.8892
📊Polynomial Regression Oscillator:
This publication also includes the oscillator version of the this model which is displayed at the bottom of the screen. The oscillator applies a logarithmic transformation to the price and the regression lines using the formula log10(x) .
The log-transformed price is then normalized using min-max normalization relative to the log-transformed top and bottom regression line with the formula:
normalized price = log(close) - log(bottom regression line) / log(top regression line) - log(bottom regression line)
This transformation results in a price value between 0 and 1 between both the regression lines. The Oscillator version can be found here.
🔍Interpretation of the Model:
In general, the red area represents a caution zone, as historically, the price has often been near its cycle market top within this range. On the other hand, the green area is considered an area of opportunity, as historically, it has corresponded to the market bottom.
The top regression line serves as a signal for the absolute market cycle peak, while the bottom regression line indicates the absolute market cycle bottom.
Additionally, this model provides a predicted range for Bitcoin's future price movements, which can be used to make extrapolated predictions. We will explore this further below.
🔮Future Predictions:
Finally, let's discuss what this model actually predicts for the potential upcoming market cycle top and the corresponding market cycle bottom. In our previous post here , a cycle interval analysis was performed to predict a likely time window for the next cycle top and bottom:
In the image, it is predicted that the next top-to-top cycle interval will be 208 weeks, which translates to November 3rd, 2025. It is also predicted that the bottom-to-top cycle interval will be 152 weeks, which corresponds to October 13th, 2025. On the macro level, these two dates align quite well. For our prediction, we take the average of these two dates: October 24th 2025. This will be our target date for the bull cycle top.
Now, let's do the same for the upcoming cycle bottom. The bottom-to-bottom cycle interval is predicted to be 205 weeks, which translates to October 19th, 2026, and the top-to-bottom cycle interval is predicted to be 259 weeks, which corresponds to October 26th, 2026. We then take the average of these two dates, predicting a bear cycle bottom date target of October 19th, 2026.
Now that we have our predicted top and bottom cycle date targets, we can simply reference these two dates to our model, giving us the Bitcoin top price prediction in the range of 152,000 in Q4 2025 and a subsequent bottom price prediction in the range of 46,500 in Q4 2026.
For those interested in understanding what this specifically means for the predicted diminishing return top and bottom cycle values, the image below displays these predicted values. The new values are highlighted in yellow:
And of course, keep in mind that these targets are just rough estimates. While we've done our best to estimate these targets through a data-driven approach, markets will always remain unpredictable in nature. What are your targets? Feel free to share them in the comment section below.

Bitcoin Polynomial Regression OscillatorThis is the oscillator version of the script. Click here for the other part of the script.
💡Why this model was created:
One of the key issues with most existing models, including our own Bitcoin Log Growth Curve Model , is that they often fail to realistically account for diminishing returns. As a result, they may present overly optimistic bull cycle targets (hence, we introduced alternative settings in our previous Bitcoin Log Growth Curve Model).
This new model however, has been built from the ground up with a primary focus on incorporating the principle of diminishing returns. It directly responds to this concept, which has been briefly explored here .
📉The theory of diminishing returns:
This theory suggests that as each four-year market cycle unfolds, volatility gradually decreases, leading to more tempered price movements. It also implies that the price increase from one cycle peak to the next will decrease over time as the asset matures. The same pattern applies to cycle lows and the relationship between tops and bottoms. In essence, these price movements are interconnected and should generally follow a consistent pattern. We believe this model provides a more realistic outlook on bull and bear market cycles.
To better understand this theory, the relationships between cycle tops and bottoms are outlined below:https://www.tradingview.com/x/7Hldzsf2/
🔧Creation of the model:
For those interested in how this model was created, the process is explained here. Otherwise, feel free to skip this section.
This model is based on two separate cubic polynomial regression lines. One for the top price trend and another for the bottom. Both follow the general cubic polynomial function:
ax^3 +bx^2 + cx + d.
In this equation, x represents the weekly bar index minus an offset, while a, b, c, and d are determined through polynomial regression analysis. The input (x, y) values used for the polynomial regression analysis are as follows:
Top regression line (x, y) values:
113, 18.6
240, 1004
451, 19128
655, 65502
Bottom regression line (x, y) values:
103, 2.5
267, 211
471, 3193
676, 16255
The values above correspond to historical Bitcoin cycle tops and bottoms, where x is the weekly bar index and y is the weekly closing price of Bitcoin. The best fit is determined using metrics such as R-squared values, residual error analysis, and visual inspection. While the exact details of this evaluation are beyond the scope of this post, the following optimal parameters were found:
Top regression line parameter values:
a: 0.000202798
b: 0.0872922
c: -30.88805
d: 1827.14113
Bottom regression line parameter values:
a: 0.000138314
b: -0.0768236
c: 13.90555
d: -765.8892
📊Polynomial Regression Oscillator:
This publication also includes the oscillator version of the this model which is displayed at the bottom of the screen. The oscillator applies a logarithmic transformation to the price and the regression lines using the formula log10(x) .
The log-transformed price is then normalized using min-max normalization relative to the log-transformed top and bottom regression line with the formula:
normalized price = log(close) - log(bottom regression line) / log(top regression line) - log(bottom regression line)
This transformation results in a price value between 0 and 1 between both the regression lines.
🔍Interpretation of the Model:
In general, the red area represents a caution zone, as historically, the price has often been near its cycle market top within this range. On the other hand, the green area is considered an area of opportunity, as historically, it has corresponded to the market bottom.
The top regression line serves as a signal for the absolute market cycle peak, while the bottom regression line indicates the absolute market cycle bottom.
Additionally, this model provides a predicted range for Bitcoin's future price movements, which can be used to make extrapolated predictions. We will explore this further below.
🔮Future Predictions:
Finally, let's discuss what this model actually predicts for the potential upcoming market cycle top and the corresponding market cycle bottom. In our previous post here , a cycle interval analysis was performed to predict a likely time window for the next cycle top and bottom:
In the image, it is predicted that the next top-to-top cycle interval will be 208 weeks, which translates to November 3rd, 2025. It is also predicted that the bottom-to-top cycle interval will be 152 weeks, which corresponds to October 13th, 2025. On the macro level, these two dates align quite well. For our prediction, we take the average of these two dates: October 24th 2025. This will be our target date for the bull cycle top.
Now, let's do the same for the upcoming cycle bottom. The bottom-to-bottom cycle interval is predicted to be 205 weeks, which translates to October 19th, 2026, and the top-to-bottom cycle interval is predicted to be 259 weeks, which corresponds to October 26th, 2026. We then take the average of these two dates, predicting a bear cycle bottom date target of October 19th, 2026.
Now that we have our predicted top and bottom cycle date targets, we can simply reference these two dates to our model, giving us the Bitcoin top price prediction in the range of 152,000 in Q4 2025 and a subsequent bottom price prediction in the range of 46,500 in Q4 2026.
For those interested in understanding what this specifically means for the predicted diminishing return top and bottom cycle values, the image below displays these predicted values. The new values are highlighted in yellow:
And of course, keep in mind that these targets are just rough estimates. While we've done our best to estimate these targets through a data-driven approach, markets will always remain unpredictable in nature. What are your targets? Feel free to share them in the comment section below.

Quarterly Theory ICT 03 [TradingFinder] Precision Swing Points🔵 Introduction
Precision Swing Point (PSP) is a divergence pattern in the closing of candles between two correlated assets, which can indicate a potential trend reversal. This structure appears at market turning points and highlights discrepancies between the price behavior of two related assets.
PSP typically forms in key timeframes such as 5-minute, 15-minute, and 90-minute charts, and is often used in combination with Smart Money Concepts (SMT) to confirm trade entries.
PSP is categorized into Bearish PSP and Bullish PSP :
Bearish PSP : Occurs when an asset breaks its previous high, and its middle candle closes bullish, while the correlated asset closes bearish at the same level. This divergence signals weakness in the uptrend and a potential price reversal downward.
Bullish PSP : Occurs when an asset breaks its previous low, and its middle candle closes bearish, while the correlated asset closes bullish at the same level. This suggests weakness in the downtrend and a potential price increase.
🟣 Trading Strategies Using Precision Swing Point (PSP)
PSP can be integrated into various trading strategies to improve entry accuracy and filter out false signals. One common method is combining PSP with SMT (divergence between correlated assets), where traders identify divergence and enter a trade only after PSP confirms the move.
Additionally, PSP can act as a liquidity gap, meaning that price tends to react to the wick of the PSP candle, making it a favorable entry point with a tight stop-loss and high risk-to-reward ratio. Furthermore, PSP combined with Order Blocks and Fair Value Gaps in higher timeframes allows traders to identify stronger reversal zones.
In lower timeframes, such as 5-minute or 15-minute charts, PSP can serve as a confirmation for more precise entries in the direction of the higher timeframe trend. This is particularly useful in scalping and intraday trading, helping traders execute smarter entries while minimizing unnecessary stop-outs.
🔵 How to Use
PSP is a trading pattern based on divergence in candle closures between two correlated assets. This divergence signals a difference in trend strength and can be used to identify precise market turning points. PSP is divided into Bullish PSP and Bearish PSP, each applicable for long and short trades.
🟣 Bullish PSP
A Bullish PSP forms when, at a market turning point, the middle candle of one asset closes bearish while the correlated asset closes bullish. This discrepancy indicates weakness in the downtrend and a potential price reversal upward.
Traders can use this as a signal for long (buy) trades. The best approach is to wait for price to return to the wick of the PSP candle, as this area typically acts as a liquidity level.
f PSP forms within an Order Block or Fair Value Gap in a higher timeframe, its reliability increases, allowing for entries with tight stop-loss and optimal risk-to-reward ratios.
🟣 Bearish PSP
A Bearish PSP forms when, at a market turning point, the middle candle of one asset closes bullish while the correlated asset closes bearish. This indicates weakness in the uptrend and a potential price decline.
Traders use this pattern to enter short (sell) trades. The best entry occurs when price retests the wick of the PSP candle, as this level often acts as a resistance zone, pushing price lower.
If PSP aligns with a significant liquidity area or Order Block in a higher timeframe, traders can enter with greater confidence and place their stop-loss just above the PSP wick.
Overall, PSP is a highly effective tool for filtering false signals and improving trade entry precision. Combining PSP with SMT, Order Blocks, and Fair Value Gaps across multiple timeframes allows traders to execute higher-accuracy trades with lower risk.
🔵 Settings
Mode :
2 Symbol : Identifies PSP and PCP between two correlated assets.
3 Symbol : Compares three assets to detect more complex divergences and stronger confirmation signals.
Second Symbol : The second asset used in PSP and correlation calculations.
Third Symbol : Used in three-symbol mode for deeper PSP and PCP analysis.
Filter Precision X Point : Enables or disables filtering for more precise PSP and PCP detection. This filter only identifies PSP and PCP when the base asset's candle qualifies as a Pin Bar.
Trend Effect : By changing the Trend Effect status to "Off," all Pin bars, whether bullish or bearish, are displayed regardless of the current market trend. If the status remains "On," only Pin bars in the direction of the main market trend are shown.
Bullish Pin Bar Setting : Using the "Ratio Lower Shadow to Body" and "Ratio Lower Shadow to Higher Shadow" settings, you can customize your bullish Pin bar candles. Larger numbers impose stricter conditions for identifying bullish Pin bars.
Bearish Pin Bar Setting : Using the "Ratio Higher Shadow to Body" and "Ratio Higher Shadow to Lower Shadow" settings, you can customize your bearish Pin bar candles. Larger numbers impose stricter conditions for identifying bearish Pin bars.
🔵 Conclusion
Precision Swing Point (PSP) is a powerful analytical tool in Smart Money trading strategies, helping traders identify precise market turning points by detecting divergences in candle closures between correlated assets. PSP is classified into Bullish PSP and Bearish PSP, each playing a crucial role in detecting trend weaknesses and determining optimal entry points for long and short trades.
Using the PSP wick as a key liquidity level, integrating it with SMT, Order Blocks, and Fair Value Gaps, and analyzing higher timeframes are effective techniques to enhance trade entries. Ultimately, PSP serves as a complementary tool for improving entry accuracy and reducing unnecessary stop-outs, making it a valuable addition to Smart Money trading methodologies.

ZenAlgo - BenderThis script combines several volume-based methodologies into a single chart overlay to help traders analyze market participation and volume distribution. It aggregates volume from multiple sources—spot and perpetual markets across different exchanges—and processes it to display various insights directly on the chart.
The script provides a detailed view of both individual-bar volume and broader aggregated trends. It calculates certain values, plots different shapes and overlays, and includes an optional informational table. However, it does not offer financial signals or predict future price movements. Instead, it presents multiple volume and range-related highlights for educational or analytical observations.
Below is a detailed breakdown of the core elements in this script:
Core Data Calculation and Aggregation
To build a comprehensive volume picture, the script retrieves volume data from multiple predefined exchanges for both Spot and Perpetual pairs. The volume for each bar is processed in Aggregated mode , meaning it combines data across selected sources to produce a single composite volume value.
The script applies average-based aggregation to calculate the final volume figures. The total volume is then used as the basis for further calculations, such as buy/sell volume decomposition and Delta analysis.
Buy/Sell Volume Decomposition
Each bar’s total volume is separated into an estimated buy portion and a sell portion. This decomposition uses logic that considers wick length, body size, and whether the bar closed higher or lower than it opened. The script assigns fractions of the total volume to the upper wick, lower wick, and body, then multiplies these by the total aggregated volume to estimate buy and sell volumes.
This breakdown is calculated separately for spot-only volume , perp-only volume , and their aggregated sums, allowing traders to analyze how much of each bar’s volume is estimated as "buy" or "sell."
Delta and Cumulative Delta
The script computes a Delta (buy volume minus sell volume) for each bar. A positive Delta suggests more buying during that bar, while a negative Delta suggests more selling.
It also computes Cumulative Delta , summing this Delta over 14 bars (a fixed period). This allows users to observe how short-term buy/sell imbalances accumulate over time.
Visual Bar Coloring (PVSRA Logic)
The script includes logic based on PVSRA (Price Volume Support Resistance Analysis) , which examines average volume over a recent lookback period to determine whether a bar meets certain "climax" or "above-average" thresholds.
Bars are categorized as:
Climax Up or Climax Down: If a bar meets strong volume and range conditions, it is identified as a high-activity bar.
Neutral Colors: Bars that do not meet the threshold are identified as standard volume bars.
Table Summaries
The script includes an optional Spot vs. Perpetual volume table that provides:
Aggregated Spot vs. Perpetual buy/sell volumes
The net difference between buying and selling
The total sum across all included sources
Percentage breakdown of buying vs. selling
A separate multi-timeframe table calculates volume-related metrics for fixed timeframes (15, 60, and 240 minutes), allowing traders to compare their current timeframe with broader trends.
Highlighted Shapes and Diamonds
The script places shape markers above or below bars when certain conditions are met, including:
Dots (circles): Representing a significant increase in net Delta compared to the previous bar.
Diamonds: Markers that appear when volume-based conditions align with predefined thresholds. These vary in size and include an optional "Hardcore Mode" , which applies stricter filtering.
Crossover Triangles: These appear when the internally computed Delta MA (a moving average of Delta) crosses above or below a predefined EMA.
These markers highlight notable changes in volume, Delta, or price action but do not constitute predictive trading signals.
Delta Averages and Overlaid EMAs
The script plots a histogram of the current net Delta (buy minus sell) . Additionally, a Delta Moving Average (Delta MA) is used for tracking trends. The Delta MA is plotted alongside predefined Exponential Moving Averages (EMAs) , such as:
A Delta MA calculated using an exponential moving average (EMA) over 21 bars.
A set of predefined EMAs (lengths such as 3, 5, 7, 10, 13, 16, 21, 25, etc.) plotted to visualize momentum changes.
Areas between these EMAs can be filled with translucent shading to highlight momentum shifts.
Comparing the Delta MA to the overlaid EMAs helps track changes in Delta momentum over time.
Interpreting the Elements
When using this script, consider the following:
Volume Aggregation: The script aggregates volume across multiple Spot and Perpetual sources to provide a broad market view.
Delta and Cumulative Delta: The Delta histogram may spike positively or negatively, highlighting areas of potential buying or selling pressure.
Table Data: If enabled, the tables display buy/sell volume splits for Spot and Perpetual markets, along with multi-timeframe comparisons.
EMA Overlays on Delta: The stacked EMAs help visualize short-term vs. longer-term Delta changes.
Shape Markers: Dots, diamonds, and triangles emphasize notable shifts in volume or Delta but do not imply recommendations for action.
Usage Tips
Toggle "Hardcore Mode" to apply stricter filtering to highlight conditions.
Enable or disable the Spot vs. Perpetual Table to see if the breakdown of volume sources is useful.
Use the multi-timeframe table to compare intraday data with broader trends.
If the chart appears too cluttered, toggle off features like PVSRA color tints or some EMAs to focus on specific elements.
Final Thoughts
This script integrates multiple volume-based calculations, range analysis, aggregated volume from predefined tickers, and various moving averages for Delta. Its visual layers—color-coded bars, histograms, shape markers, and tables—offer a rich perspective on market activity.
Users can analyze these elements across any timeframe or market combination they prefer. The script does not provide buy/sell signals or make predictions —it is purely an analytical tool for understanding volume-based market dynamics.
Traders should interpret these visual elements according to their own strategy and trading approach.
