KRIPTANO SHORT SNIPERИндикатор для поиска точек входа в SHORT после резких ценовых движений на криптовалютном рынке.
Возможности
Детектор пампа: автоматическое выявление скачков цены на интервалах 15m, 30m, 1h с настраиваемыми порогами
Уровни сопротивления: динамические линии с 7 таймфреймов (5m-1W) с автоудалением после пробития
Volume Profile: распределение объема по ценовым уровням с профилем настроений (бычьи/медвежьи зоны)
KRIPTANO SHORT SNIPER
Indicator for finding SHORT entry points after sharp price movements in the cryptocurrency market.
Features
Pump Detector: automatic detection of price spikes on 15m, 30m, 1h intervals with customizable thresholds
Resistance Levels: dynamic lines from 7 timeframes (5m-1W) with auto-removal after breakout
Volume Profile: volume distribution across price levels with sentiment profile (bullish/bearish zones)
Sentiment

KRIPTANO ISHORT HUNTERИндикатор для поиска точек входа в SHORT после резких ценовых движений на криптовалютном рынке.
Возможности
Детектор пампа: автоматическое выявление скачков цены на интервалах 15m, 30m, 1h с настраиваемыми порогами
Уровни сопротивления: динамические линии с 7 таймфреймов (5m-1W) с автоудалением после пробития
Volume Profile: распределение объема по ценовым уровням с профилем настроений (бычьи/медвежьи зоны)
KRIPTANO SHORT HUNTER
Indicator for finding SHORT entry points after sharp price movements in the cryptocurrency market.
Features
Pump Detector: automatic detection of price spikes on 15m, 30m, 1h intervals with customizable thresholds
Resistance Levels: dynamic lines from 7 timeframes (5m-1W) with auto-removal after breakout
Volume Profile: volume distribution across price levels with sentiment profile (bullish/bearish zones)

MinsenTTS 2.0Minsen Trend Tracking System 2.0 (MinsenTTS 2.0)
明心鉴己 · 顺势而为
-------------------------------
“Minsen (明心道动)” 取自 “明心见性,道动为术”,是我作为一个独立交易者,对自己交易体系的一次完整梳理与输出。
交易做久了,我发现最难的不是技术,而是心性。所谓的 “明心”,不仅仅是看清行情,更是认清自己。是在面对市场的诱惑与恐慌时,能否诚实地执行自己制定好的原则,不侥幸、不自欺欺人。
MinsenTTS 2.0 就是基于这个初衷设计的辅助工具。我希望它能像一面镜子,客观地反映市场的真实状态,帮你在混沌中保持清醒,让你的每一次决策,都符合你内心的原则。
-------------------------------
我的设计理念
这套系统的核心,融合了我对“反者道动,弱者道用”的理解,旨在解决我们在交易中常遇到的三个难题:
1. 关于“明心”(去噪与自律):
市场里充满了噪音,很容易让人迷失。系统通过算法过滤掉了那些无效的波动,只呈现最核心的趋势。这不仅是为了看清盘面,更是为了让你在面对杂乱K线时,能守住自己的交易纪律,不被情绪左右。
2. 关于“顺势”(多维共振):
我们常说顺势,但什么是势?真正的趋势是动能、量能与结构的共鸣。这套系统不依赖单一信号,只有当市场的多个维度达成“共识”时,它才会确认趋势。顺势而为,才能让交易变得简单。
3. 关于“弱者道用”(柔弱与保全):
老子讲“柔弱胜刚强”。在交易中,承认自己的渺小,不与市场硬碰硬,才是长存之道。当行情极度亢奋、看似最强劲时,往往内部结构最为脆弱。系统内置的**“极值防御”**机制,就是帮你避开这种“盛极而衰”的锋芒。我们不争一时的暴利,而是求得资金在长周期里的安稳与复利。
-------------------------------
**特别说明:关于“诚实”与“不重绘”
既然讲“明心”,最基本的就是不自欺,也不欺人。
我特别反感市面上那种为了“好看”而作弊的指标。它们最恶心的地方在于:行情走完之后,回头在历史最高点补一个“卖出”,在最低点补一个“买入”。乍一看简直是神级预测,但在实盘的那个当下,信号根本不存在,你永远无法在那个位置成交。
MinsenTTS 2.0 严守底线,绝不使用未来函数,绝不重绘。 我们拒绝为了美化历史业绩而欺骗用户,更不会为了让指标看起来“神准”而扭曲数据的真实性。
所有的信号一旦在当前K线收盘确认,就永久固定,绝不会消失或漂移。哪怕是错误的信号,也会诚实地留在图表上。因为只有面对真实的(哪怕是不完美的)历史,我们才能进行有效的复盘,做出对自己负责的决策。
-------------------------------
Minsen 指标生态:左侧与右侧的配合
MinsenTTS 2.0 专注于右侧趋势追踪(趋势确立后的跟随)。为了获得更完整的视角,建议结合我的另一款指标 MinsenAMRS 使用:
* MinsenAMRS:负责左侧预警,在趋势反转前夕提供信号。
* MinsenTTS:负责右侧确认,在趋势确立后提供跟随依据。
心得分享:当 AMRS 提示反转风险,随后 TTS 确认趋势进入“萌芽期”或“发展期”,这种“左侧预警 + 右侧确认”的结合,往往能提供更高质量的观察窗口。
-------------------------------
图表元素解读:如何使用这套工具
为了还你一个清爽的盘面,系统将繁杂的数据处理转化为直观的视觉元素。以下是你默认可见的内容,建议按这个顺序来观察市场:
1. 🌊 智能趋势色带 (Smart Trend Band)
这是最直观的视觉参考,代表了市场阻力最小的方向。
颜色:绿色代表多头(上涨),红色代表空头(下跌)。
形态:色带越宽,说明趋势劲头越足;色带变窄,说明动能减弱。
衰竭提示:当色带边缘出现橙色轮廓,意味着趋势进入“衰竭期”。虽然价格可能还在惯性运行,但这提示你内部动能已经背离,这时候应该警惕风险,而不是盲目乐观。
(注:本系统采用国际主流配色:绿涨红跌)
2. 🏷️ 市场状态标记 (State Markers)
系统在关键节点会给出图标,作为你观察行情的窗口。
“多” / “空” 标签:代表市场状态发生了高胜率的切换(比如从震荡转为趋势)。这通常是趋势启动或重启的节点,值得你重点关注。
小三角图标 (△/▽):趋势延续标记。当趋势在发展中出现良性回调,并再次顺势突破时,系统会标记这个图标,提示趋势结构依然完整。
3. 🟨 横盘识别背景 (Consolidation Filter)
视觉表现:图表背景出现淡黄色区域。
含义:系统识别到市场进入了低波动或无序的横盘整理。
建议:在这片区域,趋势策略很容易失效。黄色的背景不仅是警示灯,更是资金的保护罩。它提醒你当前处于“垃圾时间”,避免在无序波动中反复磨损本金。
4. 📊 市场情报面板 (Info Table)
右下角的面板是对当前K线的全方位“体检”,帮你把感性的盘感量化为数据:
趋势 (Trend):强势/中等/弱势。注:此项仅代表动能的级别,不代表涨跌方向。
评分 (Score):0-100分。分数越高,代表动能、量能与结构的共振度越高。
阶段 (Stage):告诉你当前处于“萌芽、发展、加速”还是“衰竭”期。
置信度 (Confidence):算法对当前判断的把握有多大。
方向 (Direction):明确指出是“↗上涨”、“↘下跌”还是“震荡”。
市况 (State):定性判断是“趋势”还是“横盘”。
效率 (Efficiency):“高效”代表K线走得干脆利落;“低效”代表锯齿多、磨人。
5. 🚧 动态支撑与阻力 (Dynamic S/R Lines)
视觉表现:图表中延伸出的红色虚线与绿色虚线。
含义:这是系统自动筛选出的筹码密集区。红色虚线是潜在阻力,绿色虚线是潜在支撑。这些位置往往是价格可能停顿或测试的地方,做交易计划时可以作为客观参考。
-------------------------------
写在最后
工具是死的,人是活的。
MinsenTTS 2.0 只是一个辅助你观察市场的工具,它无法消除市场的不确定性,更不能替你做决定。
真正的交易决策,应该来自于你对自己交易系统的坚持,和对风险的敬畏。希望这个工具能帮你省去繁琐的计算,让你在看盘时,心里更明亮,决策更坚定。
明心鉴己,顺势而为。
-------------------------------
免责声明:本指标仅用于技术分析与市场观察,不构成任何具体的投资建议。金融市场风险巨大,请用户结合自身情况独立决策。
=========English Version=========
Minsen Trend Tracking System 2.0 (MinsenTTS)
Reflect on the Self · Flow with the Trend
-------------------------------
"Minsen" (明心道动) is derived from the philosophy of "Clarifying the Mind to see one's Nature, and acting through the movement of the Tao." It represents a complete consolidation and output of my personal trading system as an independent trader.
After trading for a long time, I realized that the hardest part is not the technique, but the mindset (psychology). "Clarifying the Mind" isn't just about seeing the market clearly; it's about seeing yourself clearly. It is about whether you can honestly execute your principles without luck-seeking or self-deception when facing the market's temptations and panic.
MinsenTTS 2.0 was designed as an auxiliary tool with this original intention. I hope it serves as a mirror, objectively reflecting the true state of the market, helping you stay clear-headed amidst the chaos, ensuring every decision aligns with your inner principles.
-------------------------------
My Design Philosophy
The core of this system integrates my understanding of "Reversal is the movement of the Tao; Weakness is the usage of the Tao." It aims to solve three common challenges we face in trading:
On "Clarifying the Mind" (De-noising & Discipline):
The market is full of noise that leads people astray. The system uses algorithms to filter out invalid fluctuations, presenting only the core trend. This is not just to see the chart clearly, but to help you maintain your trading discipline and remain unaffected by emotions when facing messy price action.
On "Flowing with the Trend" (Multi-dimensional Confluence):
We often talk about following the trend, but what is the "trend"? A true trend is the resonance of Momentum, Volume, and Structure. This system does not rely on a single signal; it only confirms a trend when multiple dimensions of the market reach a "consensus." Following the trend makes trading simple.
On "The Way of Weakness" (Yielding & Preservation):
Laozi said, "The soft and weak overcome the hard and strong." In trading, acknowledging one's insignificance and not fighting the market head-on is the way to survive. When the market is extremely euphoric and appears strongest, its internal structure is often the most fragile. The system's built-in "Extremes Defense" mechanism helps you avoid this "sharp edge" of exhaustion. We do not strive for momentary explosive profits, but seek the safety and compounding of capital over the long cycle.
-------------------------------
Special Note: On "Honesty" & "Non-Repainting"
Since we speak of "Clarifying the Mind," the most basic requirement is not to deceive oneself or others.
I have a strong aversion to indicators on the market that cheat just to "look good." The most disgusting part is how they operate: after the market moves, they go back and paint a "Sell" at the historical high and a "Buy" at the low. At first glance, it looks like a god-tier prediction, but in the reality of live trading, that signal did not exist, and you could never have executed that trade.
MinsenTTS 2.0 strictly holds the line: No Future Functions, No Repainting.
We refuse to deceive users to beautify historical performance, and we certainly will not distort the authenticity of the data just to make the indicator look "magical."
All signals are permanently fixed once the current candle closes. They will never vanish or drift. Even incorrect signals will honestly remain on the chart. Because only by facing real (even if imperfect) history can we conduct effective reviews and make responsible decisions.
-------------------------------
The Minsen Ecosystem: Left & Right Side Synergy
MinsenTTS 2.0 focuses on Right-side Trend Tracking (following after the trend is established). For a more complete perspective, it is recommended to combine it with my other indicator, MinsenAMRS:
MinsenAMRS: Responsible for Left-side Warning, providing signals on the eve of a trend reversal.
MinsenTTS: Responsible for Right-side Confirmation, providing the basis for following the trend after it is established.
Trader's Insight: When AMRS alerts to reversal risks, and subsequently TTS confirms the trend entering the "Germination" or "Development" stage, this combination of "Left-side Warning + Right-side Confirmation" often provides a higher-quality observation window.
-------------------------------
Chart Elements: How to Use This Tool
To return a clean chart to you, the system transforms complex data processing into intuitive visual elements. Here is the default content, and I suggest observing the market in this order:
1. 🌊 Smart Trend Band
This is the most intuitive visual reference, representing the path of least resistance.
Color: Green represents Bulls (Up), Red represents Bears (Down).
Shape: A wider band indicates strong momentum; a narrowing band indicates weakening momentum.
Exhaustion Alert: When an Orange Outline appears on the edge of the band, it means the trend has entered the "Exhaustion Phase." Although the price may still run on inertia, this warns you that internal momentum has diverged. You should be alert to risks rather than blindly optimistic.
(Note: This system uses the international color standard: Green for Up, Red for Down).
2. 🏷️ Market State Markers
The system provides icons at key nodes as windows for observing price action.
"Long" / "Short" Labels: Represent a high-probability switch in market state (e.g., from ranging to trending). These are usually the starting or restarting points of a trend and are worth your focus.
Small Triangle Icons (△/▽): Trend Continuation Markers. When a trend experiences a healthy pullback during development and breaks through again with the trend, the system marks this icon, suggesting the trend structure remains intact.
3. 🟨 Consolidation Filter (Range Background)
Visual: A pale yellow area appears in the chart background.
Meaning: The system has identified that the market has entered low-volatility or disordered sideways consolidation.
Advice: In this area, trend strategies are prone to failure. The yellow background is not just a warning light; it is a Capital Protection Shield. It reminds you that you are in "Junk Time"—avoid grinding down your principal in disordered fluctuations.
4. 📊 Market Info Table
The panel in the bottom right corner performs a comprehensive "Health Check" on the current candle, quantifying intuitive market feel into data:
Trend: Strong / Mid / Weak. Note: This represents the level of momentum, not the direction.
Score: 0-100. The higher the score, the higher the Confluence of momentum, volume, and structure.
Stage: Tells you if the trend is in "Germination," "Development," "Acceleration," or "Exhaustion."
Confidence: How confident the algorithm is in the current judgment.
Direction: Clearly indicates "↗ Up", "↘ Down", or "Range".
State: Qualitative judgment of "Trend" vs. "Consolidation".
Efficiency: "High" means the price action is clean and decisive; "Low" means it is choppy and grinding.
5. 🚧 Dynamic S/R Lines (Support & Resistance)
Visual: Red and Green dashed lines extending from the chart.
Meaning: These are dense volume zones automatically filtered by the system. Red dashed lines are potential Resistance; Green dashed lines are potential Support. These are locations where price is likely to pause or test, serving as objective references for your trading plan.
-------------------------------
Final Words
Tools are static; humans are dynamic.
MinsenTTS 2.0 is merely a tool to assist your market observation. It cannot eliminate market uncertainty, nor can it make decisions for you.
True trading decisions should come from your adherence to your own trading system and your reverence for risk. I hope this tool saves you from tedious calculations, making your mind clearer and your decisions firmer when watching the market.
Reflect on the Self, Flow with the Trend.
-------------------------------
Disclaimer: This indicator is for technical analysis and market observation only and does not constitute specific investment advice. Financial markets carry significant risks; please make independent decisions based on your own circumstances.

Precision Candle (Multi-Asset)This Script Helps in finding a Precision Candle, which signifies a potential crack in correlated assets.
you can choose between 2 or 3 assets.
make sure to use the same time frame across all assets.
Enjoy !

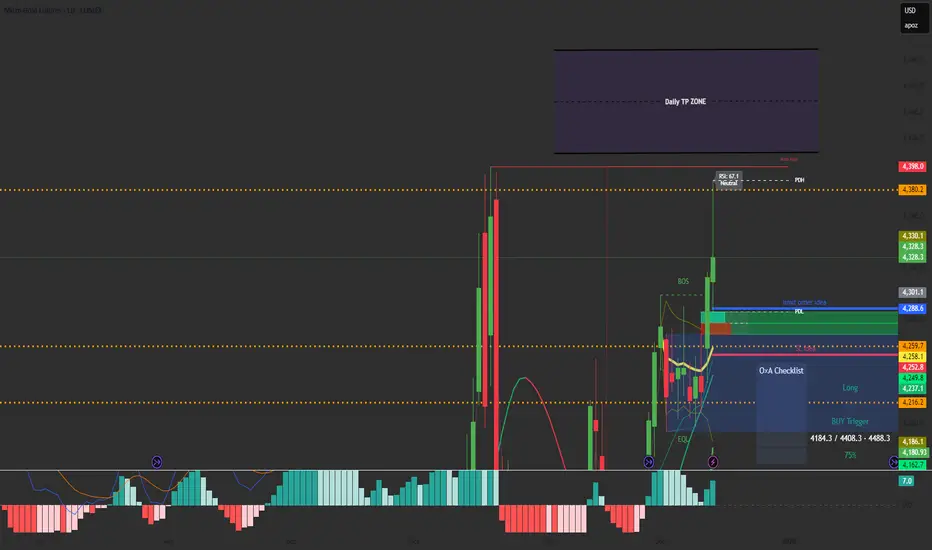
RSI Info WindowRSI Info Window is a minimalist overlay utility that displays the current RSI value and a simple market state label (Overbought, Oversold, or Neutral) directly on the chart. The goal is to provide quick RSI context without using a separate oscillator pane, helping keep the chart clean for price-action, SMC, and structure-based trading.
How it works
Calculates RSI using the selected RSI Length (default 14).
Compares RSI to the Overbought and Oversold thresholds (default 70/30).
Displays a small label on the most recent candle showing:
RSI value
Current state: Overbought / Oversold / Neutral
The label updates in real time as the latest candle forms.
Inputs
RSI Length – Controls RSI sensitivity (default 14)
Overbought Level – RSI threshold for overbought (default 70)
Oversold Level – RSI threshold for oversold (default 30)
How to use
Overbought: RSI above the overbought level — may indicate momentum is extended; watch for continuation vs exhaustion based on your system.
Oversold: RSI below the oversold level — may indicate downside extension; watch for reversal conditions and structure confirmation.
Neutral: RSI between thresholds — often indicates balanced conditions or consolidation.
This indicator is designed as a compact reference tool, not a complete trading system.
Notes
The overlay label is anchored to the most recent candle and refreshes on the last bar.
Intended to save screen space vs. a full RSI subpanel.
Disclaimer
This script is for educational and informational purposes only and does not constitute financial advice. Always use risk management and confirm signals with your broader trading plan.
Quantum X StrategyQuantum X Strategy is a structured market-behavior based trading model developed for Midcap Nifty on the 15-minute timeframe.
It focuses on identifying directional strength, momentum alignment, and price participation using a multi-factor confirmation approach.
Rather than relying on a single indicator, the strategy evaluates multiple dimensions of price movement to determine whether the market environment is favorable for participation. This helps in avoiding random entries during low-quality or sideways conditions.
🔍 Conceptual Framework
The strategy dynamically observes:
Momentum expansion and contraction
Trend participation strength
Directional consistency over recent price action
Each market condition contributes to an internal decision process, allowing trades only when sufficient alignment is present. This approach helps filter out noise and improves trade selectivity.
📊 Trade Execution Philosophy
Trades are initiated only when market structure shows clear directional intent
Both bullish and bearish opportunities are evaluated independently
Positions are exited when momentum balance weakens or returns to a neutral state
No over-trading during indecisive phases
The system is designed to stay inactive during uncertain market conditions, which is a key part of its risk-aware behavior.
🕒 Backtesting Scope
For consistency and reliability, the strategy logic is activated only from January 2024 onward, ensuring analysis is focused on recent market behavior rather than outdated volatility patterns.
⚙️ Usage Guidelines
Instrument: MIDCAPNIFTY
Timeframe: 15 Minutes
Suitable for intraday and short-term positional observation
Works best when combined with disciplined risk management
⚠️ Disclaimer
This strategy is provided strictly for educational and research purposes.
Market conditions change, and past performance does not guarantee future results. Users should always forward-test and apply their own risk management before live use.

Momentum Pulse Pro [MTF]# Momentum Pulse Pro
## What It Does
Detects when price momentum is stretched to extremes. The indicator analyzes momentum and highlights when the market is overextended — either too hot or too cold.
- **Green background** = Low momentum, potential bounce ahead
- **Red background** = High momentum, potential reversal ahead
- **Stronger color** = Stronger signal
## The Panel
Displays a Momentum Index from 0-100:
- **Below 30** = Stretched to the downside
- **30-70** = Neutral zone
- **Above 70** = Stretched to the upside
## How to Use
1. Wait for the background to change color
2. Stronger color = higher probability setup
3. Use as a filter for your strategy — don't trade it alone
## Settings
- **Colors** — Customize green/red
- **Transparency** — Background visibility
- **Confluence Intensity** — How fast color intensifies
- **Panel Position** — Move the info panel
## Alerts
- Momentum enters extreme zone
- Momentum strengthens or weakens inside extreme zone
## Good to Know
- Non-repainting
- Works on any market
- Best on 4H chart or lower

MNQ DP Levels and 1m high frequency HP+MP trading signalsidea to trade off QQQ DPs converted to NQ (dont ask me :) )on 1m chart focusing only on MP,HP triggers and scaling in down to a downside DP as an exit.
Disclaimer: This tool is for educational purposes only and does not constitute financial advice. Past performance does not guarantee future results.

Order Flow Analysis [Master Alert]This script is a custom modification of the original "Order Flow Analysis" indicator by kingthies.
I have taken the original code and engineered a "Master Alert" system into it. Here is the breakdown of what this specific script does:
1. The Core Purpose: "One Ring to Rule Them All"
In the original script, if you wanted to catch every move, you would have to set up separate alerts for Divergences, Absorptions, Crosses, etc. This modified script combines all 8 possible signals into a single "Master Trigger."
2. What triggers the Alert?
The alert will fire if ANY of the following 4 events happen on a candle:
Divergence (The Arrows):
Green Arrow: Price makes lower low, Pressure makes higher low (Bullish).
Red Arrow: Price makes higher high, Pressure makes lower high (Bearish).
Absorption (The Transparent Bars):
Bull Absorption: Huge volume + Price won't drop (Hidden Buying).
Bear Absorption: Huge volume + Price won't rise (Hidden Selling).
Zero Line Crosses (The Sentiment Flip):
Bull Cross: Pressure score flips from Negative to Positive.
Bear Cross: Pressure score flips from Positive to Negative.
Strong Zones (Turbo Mode):
Strong Bull: Pressure score breaks above +50.
Strong Bear: Pressure score breaks below -50.
3. How to Use It
Add the script to your chart.
Create an Alert.
Select "Order Flow Master" as the Condition.
Select "MASTER ALERT (All Signals)".
Now, you will get a notification for every single significant event this indicator detects, without needing multiple alert slots.

Nooner's Heikin-Ashi/Bull-Bear CandlesCandles are colored red and green when Heikin-Ashi and Bull/Bear indicator agree. They are colored yellow when they disagree.

EMA Slope Angle# EMA Slope Angle Indicator
A professional, non-repainting overlay indicator that visualizes EMA slope strength as an angle in degrees, providing instant visual feedback through dynamic EMA coloring and comprehensive trend analysis.
## ORIGINALITY
This indicator is original in its approach to slope measurement:
- **Angle-based calculation**: Uses arctangent to calculate slope as an angle in degrees (not percentage), providing a more intuitive measure of trend strength
- **Dynamic visual feedback**: Combines real-time EMA line coloring with regime detection, creating a continuous visual representation of market conditions
- **Comprehensive analysis**: Integrates angle-based trend shift signals with optional statistical analysis in a single, cohesive tool
- **Non-repainting design**: All calculations use confirmed bars only, ensuring reliable, deterministic output
## HOW IT WORKS
The indicator calculates the EMA slope angle using trigonometric functions:
```
Angle = arctan((EMA_current - EMA_past) / lookback_bars) × 180/π
```
This provides an intuitive measure where:
- **Steep angles** = strong trends (visualized with saturated colors)
- **Shallow angles** = weak trends (visualized with lighter colors)
- **Near-zero angles** = flat/consolidation (visualized in gray)
The EMA line color dynamically reflects:
- **Direction**: Green shades for uptrends, red shades for downtrends
- **Strength**: Color intensity based on normalized angle (stronger slopes = more saturated colors)
- **Regime**: Gray for flat conditions when angle is below threshold
## KEY FEATURES
### Dynamic EMA Coloring
- EMA line color changes continuously based on slope strength
- Color intensity reflects trend strength (50-100% opacity range)
- Instant visual feedback without cluttering the chart
### Regime Detection
- Automatically classifies market conditions: **RISING**, **FALLING**, or **FLAT**
- Configurable angle thresholds for regime classification
- Real-time regime updates on confirmed bars only
### Trend-Shift Signals
- Detects transitions from FLAT to RISING/FALLING regimes
- Visual arrows on chart when significant trend shifts occur
- Prevents signal spam by only triggering from FLAT state
- Configurable trigger thresholds for signal sensitivity
### KPI Dashboard
- Real-time angle display (rounded to 1 decimal place)
- Current regime status with color coding
- Last signal tracking (UP/DOWN/NONE)
- Positioned in top-right corner for easy reference
### Advanced Angle Statistics (Optional)
- Detailed breakdown of angle distribution across 9 granular buckets:
- 0-0.2°, 0.2-0.5°, 0.5-1°, 1-1.5°, 1.5-2°, 2-3°, 3-5°, 5-10°, >10°
- Shows count and percentage for each bucket
- Automatically resets on symbol/timeframe changes
- Useful for analyzing historical slope patterns
## SETTINGS
### Main Settings
- **EMA Length**: Period for exponential moving average (default: 50)
- **Slope Lookback Bars**: Number of bars to compare for slope calculation (default: 5)
### Angle Settings
- **Flat Angle Threshold**: Maximum angle for FLAT regime classification (default: 2.0°)
- **Rising Angle Trigger**: Minimum angle to trigger RISING regime and UP signals (default: 1.0°)
- **Falling Angle Trigger**: Maximum angle to trigger FALLING regime and DOWN signals (default: -1.0°)
- **Max Angle for Color Saturation**: Maximum angle for full color intensity (default: 30.0°)
### Display Options
- **Uptrend Color**: Color for rising trends (default: dark green)
- **Downtrend Color**: Color for falling trends (default: dark red)
- **Flat Color**: Color for flat conditions (default: gray)
- **Show Trend-Shift Signals**: Toggle signal arrows on/off (default: true)
- **Show Angle Statistics**: Toggle statistics dashboard on/off (default: false)
## NON-REPAINTING GUARANTEE
- All calculations use confirmed bars only (`barstate.isconfirmed`)
- No future bar references
- No higher timeframe calls using `request.security()`
- Deterministic output - what you see is what you get
- Reliable for backtesting and live trading
## USE CASES
- **Trend Identification**: Instantly identify trend strength and direction at a glance
- **Reversal Detection**: Spot trend reversals early through regime changes
- **Trade Filtering**: Filter trades based on slope strength and regime
- **Consolidation Monitoring**: Identify flat market conditions for range trading
- **Pattern Analysis**: Study historical angle distributions to understand market behavior
- **Momentum Assessment**: Gauge trend momentum through visual color intensity
## LIMITATIONS
- Angle calculation depends on EMA length and lookback period settings
- Regime classification is based on configurable thresholds - adjust to match your trading style
- Signals only trigger when transitioning from FLAT state to prevent spam
- Statistics reset on symbol/timeframe changes (by design)
- Color intensity is normalized to max angle setting - adjust for your market's typical ranges
## TECHNICAL NOTES
- Uses Pine Script v6
- Overlay indicator (plots on price chart)
- No external dependencies
- Compatible with all TradingView chart types
- Works on all timeframes and symbols
## DISCLAIMER
This indicator is designed for visual trend analysis and educational purposes. Always combine with other technical analysis tools, fundamental analysis, and proper risk management strategies. Past performance does not guarantee future results. Trading involves risk of loss.
---
**Perfect for**: Swing traders, day traders, trend followers, and market analysts seeking intuitive trend strength visualization.

XAUUSD Psychological Key Levels (v6)Unlock the key price levels of XAU/USD with precision! This indicator identifies critical support and resistance zones, helping traders spot high-probability entries and exits. Designed for both swing and intraday trading, it provides clear visual cues to navigate gold’s volatility.

CT ALLrounder PROthis is the pro indicator for almost any symbol ... just change the time period in which you want to trade...

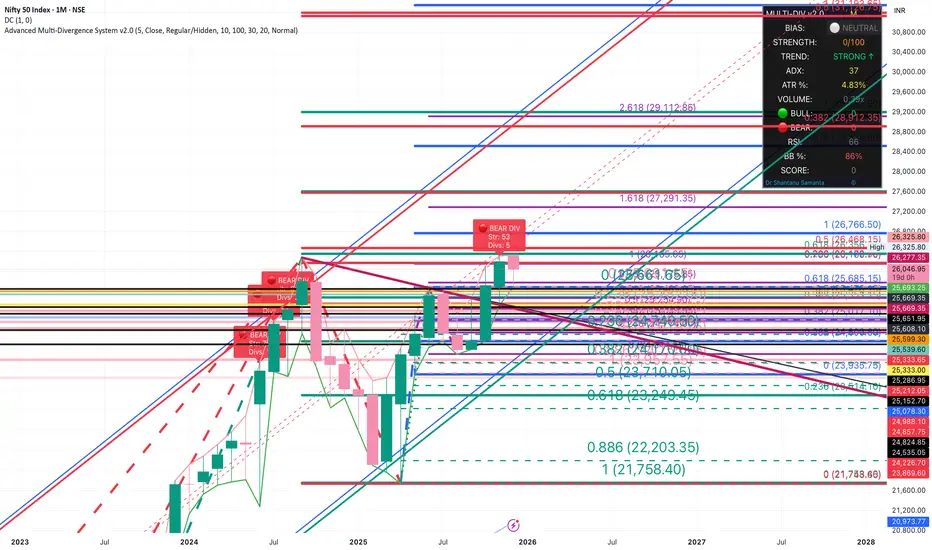
Critical Advanced Multi-Divergence System v2.0Auto calculates 15 indicators , assigns different strength to each and auto adds up to give a Final bias . Auto detects scrip & time frame . Sums up everything in a Dashboard. For educational use only
Macroeconomic Dashboard by DGTMacroeconomic Dashboard is a script tailored for traders and investors using top-down strategies to navigate global markets. It integrates key macroeconomic indicators, such as monetary policy, inflation, yields, and market sentiment, directly into financial charts.
By visualizing real-time macro data alongside asset price movements, this tool bridges the gap between traditional economic metrics and technical analysis. Whether analyzing crypto or traditional markets, users can better contextualize price action within broader economic cycles and trends.
Designed to support macro-informed decision-making, it helps identify shifts in liquidity, policy direction, and risk appetite, enhancing strategic trade entries and portfolio positioning.
KEY FEATURES
⯌ Macro Dashboard
The script provides a macro dashboard that tracks changes across key economic dimensions: monetary policy, inflation and growth, bond markets, and risk indicators. With built-in anomaly detection and trend analysis across short-, mid-, and long-term timeframes, it helps interpret market moves through a macroeconomic lens, whether analyzing equities, commodities, or digital assets.
⯌ Macro on Chart
By visualizing macro data such as M2 money supply, CPI, treasury yields, and volatility indices, users can more easily correlate economic developments with price action, enhancing situational awareness and decision-making.
MACRO METRICS
The script covers five core macroeconomic domains, each with key metrics:
Liquidity & Monetary Policy
Global M2 Money Supply
Federal Funds Rate
Reverse Repo Operations
Inflation & Economic Growth
Consumer Price Index (CPI)
Producer Price Index (PPI)
Real GDP Growth
Yields & Bond Markets
10-Year Treasury Yield
2-Year Treasury Yield
Yield Curve (10Y–2Y Spread)
Global Risk & Currency Indicators
U.S. Dollar Index (DXY)
Volatility Index (VIX)
Economic Policy Uncertainty Index
Equities, Commodities & Crypto
S&P 500 (SPX)
Nasdaq 100 (NDX)
Gold (XAU/USD)
Crude Oil (WTI)
Bitcoin (BTCUSD)
DISCLAIMER
This script is intended for informational and educational purposes only. It does not constitute financial, investment, or trading advice. All trading decisions made based on its output are solely the responsibility of the user.
สคริปต์แบบชำระเงิน

Liquidity Radar by DGTLiquidity Radar is an advanced indicator designed to uncover and visualize critical liquidity zones on the price chart. These zones mark areas where stop orders and limit orders are densely concentrated—price levels where large-scale liquidation events are more likely to occur. Such areas are often targeted by institutional players to spark volatility or to optimize trade execution.
The indicator dynamically draws horizontal levels that reflect real-time liquidity buildup based on volume and price activity. When multiple liquidation levels cluster near the same price, overlapping lines highlight zones of elevated liquidity—helping traders identify potential hotspots for price reactions, reversals, or volatility spikes.
KEY FEATURES
⯌ Magnet Zones
Clusters of liquidation levels may act as magnets for price, pulling market movement toward them. Traders often use these zones to forecast directional bias and identify high-probability setups.
⯌ Support/Resistance Zones
Densely packed liquidity often behaves as dynamic support or resistance. These zones can provide major players with optimal entry or exit points, potentially leading to sharp reactions or market reversals.
⯌ Rapid Move Zones
Areas with sparse liquidity levels often experience faster price movement, as fewer resting orders are available to absorb aggressive taker orders. These zones can lead to quick price sweeps and momentum surges.
INSIGHTS
What Happens After Price Reaches a High Liquidity Zone?
Liquidity is "Grabbed"
These zones are typically filled with stop-losses or resting orders. When price reaches them, large volumes are executed — often suddenly. This is known as a liquidity grab or stop hunt .
Increased Volatility
The execution of clustered orders often triggers bursts of volatility. This can result in large wicks, rapid price movements, or deceptive “fakeouts” around the zone.
Price Reaction Scenarios
Stall or Consolidation : After liquidity is grabbed, price may pause or range, especially if market participants are indecisive.
Reversal : If the liquidity grab flushes out weak hands, price may reverse sharply — often where institutional players are already positioned in the opposite direction.
Continuation : Sometimes, the zone acts as a launchpad — price consumes the liquidity and continues strongly in the same direction.
What Happens When Price Is Between Liquidity Zones?
Faster Price Moves
In areas with fewer clustered liquidity levels, price often moves quicker due to fewer resting orders absorbing aggressive taker orders, enabling market orders to push price rapidly through these zones.
Higher Probability of Market (Taker) Orders
Sparse liquidity encourages taker orders, which “take” liquidity instantly, causing sharp and sometimes unpredictable price swings.
Reduced Support or Resistance
The lack of dense liquidity means fewer natural price barriers, allowing price to sweep through these zones with less friction until it nears the next liquidity cluster.
Increased Volatility and Potential Whipsaws
Rapid movement in low liquidity zones can trigger stop losses or cause fakeouts, resulting in sudden volatility and quick reversals.
Opportunity for Breakouts or Trend Acceleration
Price breaking from a liquidity zone into a sparse area may gain momentum quickly, leading to strong directional moves or trend continuation.
Liquidity zones aren’t just price targets — they’re high-stakes decision points. Once tapped, they often serve as temporary barriers where price may reverse, stall, or continue, depending on the prevailing order flow and participant intent. In leveraged markets, liquidations play a crucial role in shaping price behavior and positioning. The Liquidity Levels indicator helps traders spot where these impactful moments are most likely to occur — enhancing both strategic edge and decision-making confidence.
LIMITATIONS
Due to a technical limitation in Pine Script, a maximum of 500 horizontal levels can be drawn. As a result, some historical liquidity levels from earlier bars may not appear on the chart.
DISCLAIMER
This script is intended for informational and educational purposes only. It does not constitute financial, investment, or trading advice. All trading decisions made based on its output are solely the responsibility of the user.
สคริปต์แบบชำระเงิน

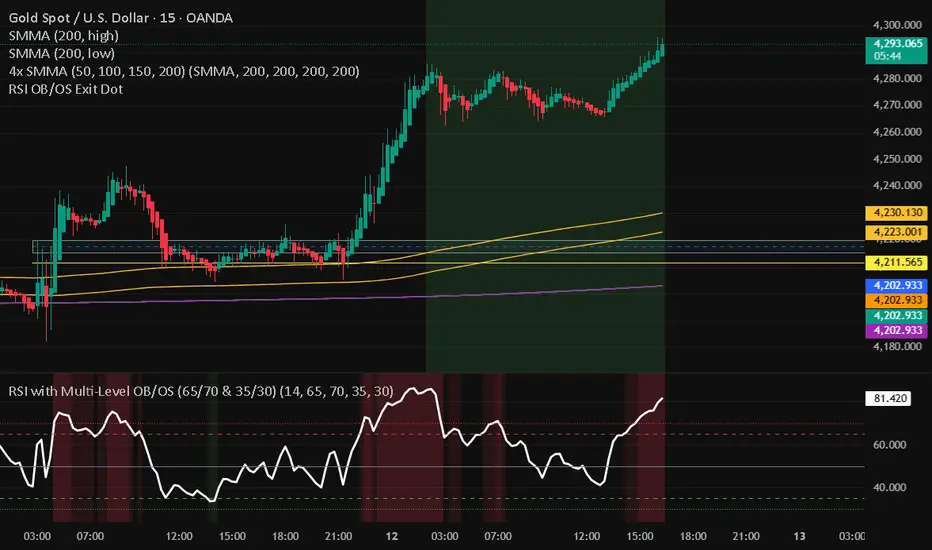
RSI with Multi-Level OB/OS (65/70 & 35/30)With a revised 65 and 35 level for higher probability of winning
MTF Dashboard Pro v4 Institutional EditionMTF Dashboard Pro v4 – 2026
Institutional Multi-Timeframe Bias Engine
A high-performance, professional-grade multi-timeframe dashboard designed for scalpers, intraday traders, and institutional smart-money practitioners.
Version 4 introduces a cleaner architecture, faster execution, and improved signal alignment across all major trend, momentum, and confirmation tools.
Core Features
Multi-Timeframe EMA Trend (9/21) – Fast intraday trend detection
200-MA System with Threshold Logic – Dynamic positional bias
Daily VWAP Engine (Optional Reset)
SuperTrend Engine with Corrected Direction Model
RSI, MACD, ADX, Alligator, Stochastic – Momentum + Confirmation suite
PH/PL Bias (Previous Day High/Low) – Institutional liquidity context
11-Signal Institutional Bias Score
Bias Classification: Strong Bull → Strong Bear
Multi-TF Alerts for Strong Bull / Strong Bear
Optimized HUD Table – Lightweight, fast, and resource-efficient
Who Is This For?
Scalpers, intraday traders, swing traders, and SMC/ICT-based traders who need:
Clear multi-timeframe alignment
Instant trend + momentum confirmation
Market structure bias
Liquidity context (PH/PL)
A single, clean, real-time dashboard
The indicator is designed to support high-speed decision making in volatile conditions and institutional trading environments.
Developed by - Sachin Yashwant Thakare
Author: Sachin Yashwant Thakare
Edition: 2026 Premium Release
Rights: © 2026 All Rights Reserved

Shiori TFGI Lite Technical Fear and Greed Index (Open Source)Shiori’s TFGI Lite
Technical Fear & Greed Index (Open Source)
---
English — Official Description
Shiori’s TFGI Lite is an open-source Technical Fear & Greed Index designed to help traders and investors understand market emotion, not predict price.
Instead of generating buy or sell signals, this indicator focuses on answering a calmer, more important question:
> Is the market emotionally stretched away from its own historical balance?
TFGI Lite combines three well-known technical dimensions — volatility, price deviation, and momentum — and normalizes them into a single, intuitive 0–100 sentiment scale.
What This Indicator Is
* A market context tool, not a trading signal
* A way to observe emotional extremes and misalignment
* Designed for any asset, any timeframe
* Fully open source, transparent and adjustable
Core Components
* Fear Factor: Short-term vs long-term ATR ratio with logarithmic compression
* Greed Factor: Price Z-score with tanh-based normalization
* Momentum Factor: Classic RSI as emotional momentum
These factors are blended and gently smoothed to form the current sentiment level.
Historical Baseline & Deviation
TFGI Lite introduces a historical baseline concept:
* The baseline represents the market’s own emotional equilibrium
* Deviation measures how far current sentiment has drifted from that equilibrium
This allows the indicator to highlight conditions such as:
* 🔥 Overheated: High sentiment + strong positive deviation
* 💎 Undervalued: Low sentiment + strong negative deviation
* ⚠️ Misaligned: Emotionally extreme, but inconsistent with historical behavior
How to Use (Lite Philosophy)
* Use TFGI Lite as a background compass, not a trigger
* Combine it with price structure, risk management, and your own strategy
* Extreme readings suggest emotional tension, not immediate reversal
> Think of TFGI Lite as market weather — it tells you the climate, not when to open or close the door.
About Parameters & Customization
All parameters in TFGI Lite are fully adjustable. Markets have different personalities — volatility, sentiment range, and emotional extremes vary by asset and timeframe.
You are encouraged to:
* Adjust fear/greed thresholds based on the asset you trade
* Tune smoothing and baseline lengths to match your timeframe
* Treat sentiment levels as relative, not universal absolutes
There is no single “correct” setting — TFGI Lite is designed to adapt to your market, not force the market into a fixed model.
Important Notes
* This is a technical sentiment indicator, not financial advice
* No future performance is implied
* Designed to reduce emotional decision-making, not replace it
---
🇹🇼 繁體中文 — 指標說明
Shiori’s TFGI Lite(技術型恐懼與貪婪指數) 是一款開源的市場情緒指標,目的不是預測價格,而是幫助你理解市場當下的「情緒狀態」。
與其問「現在該不該買或賣」,TFGI Lite 更關心的是:
> 市場情緒是否已經偏離了它自己的歷史平衡?
本指標整合三個常見但關鍵的技術面向,並統一轉換為 0–100 的情緒刻度,讓市場狀態一眼可讀。
這個指標是什麼
* 市場情緒與狀態觀察工具(非買賣訊號)
* 用來辨識情緒極端與錯位狀態
* 適用於任何商品與任何週期
* 完全開源,可學習、可調整
核心構成
* 恐懼因子:短期 / 長期 ATR 比例(對數壓縮)
* 貪婪因子:價格 Z-Score(tanh 正規化)
* 動能因子:RSI 作為情緒動量
歷史基準與偏離
TFGI Lite 引入「歷史情緒基準」的概念:
* 基準代表市場長期的情緒平衡
* 偏離值顯示當前情緒與自身歷史的距離
因此可以辨識:
* 🔥 過熱(高情緒 + 正向偏離)
* 💎 低估(低情緒 + 負向偏離)
* ⚠️ 錯位(情緒極端,但不符合歷史行為)
使用建議(Lite 精神)
* 將 TFGI Lite 作為「背景雷達」,而非進出場依據
* 搭配價格結構、風險控管與個人策略
* 情緒極端不等於立刻反轉
> 你可以把它想像成市場的天氣預報,而不是交易指令。
參數調整與個人化說明
本指標中的所有參數皆可調整。不同市場、不同商品,其波動特性與情緒區間並不相同。
建議你:
* 依標的特性自行調整恐懼 / 貪婪門檻
* 依交易週期調整平滑與基準長度
* 將情緒數值視為「相對狀態」,而非固定答案
TFGI Lite 的設計初衷,是讓你定義市場,而不是被單一參數綁住。
溫馨提示
如果你在調整指標參數時遇到不熟悉的項目,請點擊參數旁邊的 「!」圖示,每個設定都有清楚的說明。
本指標設計為可慢慢探索,請依自己的節奏理解市場狀態。
---
🇯🇵 日本語 — インジケーター説明
Shiori’s TFGI Lite は、価格を予測するための指標ではなく、
市場の「感情状態」を可視化するためのオープンソース指標です。
この指標が問いかけるのは、
> 現在の市場感情は、過去のバランスからどれだけ乖離しているのか?
という一点です。
特徴
* 売買シグナルではありません
* 市場心理の極端さやズレを観察するためのツールです
* すべての銘柄・時間軸に対応
* 学習・調整可能なオープンソース
構成要素
* 恐怖要素:ATR 比率(対数圧縮)
* 強欲要素:価格 Z スコア(tanh 正規化)
* モメンタム:RSI
ベースラインと乖離
市場自身の感情的な基準点と、
現在の感情との距離を測定します。
過熱・割安・感情のズレを視覚的に把握できます。
パラメータ調整について
TFGI Lite のすべてのパラメータは調整可能です。市場ごとにボラティリティや感情の振れ幅は異なります。
* 恐怖・強欲の閾値は銘柄に応じて調整してください
* 時間軸に合わせて平滑化やベースライン期間を変更できます
* 数値は絶対値ではなく、相対的な感情状態として捉えてください
この指標は、市場に合わせて柔軟に使うことを前提に設計されています。
フレンドリーヒント
入力項目で分からない設定がある場合は、横に表示されている 「!」アイコン をクリックしてください。各パラメータには分かりやすい説明が用意されています。
このインジケーターは、落ち着いて市場の状態を理解するためのものです。
---
🇰🇷 한국어 — 지표 설명
Shiori’s TFGI Lite는 매수·매도 신호를 제공하는 지표가 아니라,
시장 감정의 상태를 이해하기 위한 기술적 심리 지표입니다.
이 지표의 핵심 질문은 다음과 같습니다.
> 현재 시장 감정은 과거의 균형 상태에서 얼마나 벗어나 있는가?
특징
* 거래 신호 아님
* 시장 심리의 과열·저평가·불일치를 관찰
* 모든 자산, 모든 타임프레임 지원
* 오픈소스 기반
구성 요소
* 공포 요인: ATR 비율 (로그 압축)
* 탐욕 요인: Z-Score (tanh 정규화)
* 모멘텀: RSI
활용 방법
TFGI Lite는 배경 지표로 사용하세요.
가격 구조와 리스크 관리와 함께 사용할 때 가장 효과적입니다.
파라미터 조정 안내
TFGI Lite의 모든 설정 값은 사용자가 직접 조정할 수 있습니다. 자산마다 변동성과 감정 범위는 서로 다릅니다.
* 공포 / 탐욕 기준값은 종목 특성에 맞게 조정하세요
* 타임프레임에 따라 스무딩 및 기준 기간을 변경할 수 있습니다
* 감정 수치는 절대적인 값이 아닌 상대적 상태로 해석하세요
이 지표는 하나의 정답을 강요하지 않고, 시장에 맞춰 적응하도록 설계되었습니다.
친절한 안내
설정 값이 익숙하지 않다면, 항목 옆에 있는 "!" 아이콘을 클릭해 보세요. 각 입력값마다 설명이 제공됩니다.
이 지표는 천천히 시장의 맥락을 이해하도록 설계되었습니다.
---
Educational purpose only. Not financial advice.
---
#FearAndGreed #MarketSentiment #TradingPsychology #TechnicalAnalysis #OpenSourceIndicator #Volatility #RSI #ATR #ZScore #MultiAsset #TradingView #Shiori

Zaka Pro: Clear Structure (HH/LL) + MSS ZonesCertainly! Here is a description of the Pine Script indicator you provided, focusing on its main functions and trading strategy, written in English.
---
## Zaka Pro: Clear Structure (HH/LL) + MSS Zones
This is a technical analysis indicator developed in Pine Script (`//@version=5`) designed to automatically identify and plot key price action structural elements based on the **Zig Zag** method, while incorporating a simplified **Market Structure Shift (MSS)** concept, often used in Smart Money Concepts (SMC) or Wyckoff trading.
### Key Features:
1. **Pivot-Based Structure Identification:**
* The indicator uses the standard **`ta.pivothigh`** and **`ta.pivotlow`** functions, determined by the user-defined `Pivot Length` (`prd`). This forms the foundation of the price "swing" structure.
2. **Structural Labeling (HH/LL/LH/HL):**
* It automatically labels the resulting swing points to clearly show the prevailing trend:
* **HH (Higher High):** Continuation of an uptrend.
* **LL (Lower Low):** Continuation of a downtrend.
* **LH (Lower High):** A potential reversal or weakening of an uptrend.
* **HL (Higher Low):** A potential reversal or weakening of a downtrend.
3. **Zig Zag Plotting:**
* The indicator connects the identified pivot points with a **gray line** to visually represent the market swings.
4. **Market Structure Shift (MSS) Strategy:**
* The core strategy detects a potential **trend reversal** when the price breaks the most recent structural pivot:
* **Buy MSS Trigger:** Detected when the price breaks **above the last High** (`last_high`) while the market was in a confirmed **downtrend** (forming Lower Lows).
* **Sell MSS Trigger:** Detected when the price breaks **below the last Low** (`last_low`) while the market was in a confirmed **uptrend** (forming Higher Highs).
5. **Order Block / Entry Zone Plotting:**
* Upon detection of a confirmed MSS (reversal), the indicator plots a colored **Box** representing a potential re-entry zone:
* **BUY ZONE (Green Box):** Plotted after a Buy MSS (breakout to the upside). The zone is defined by the **High and Low of the two candles preceding the last swing Low** (`ob_low_top`, `ob_low_btm`). This acts as a simplified "Order Block" for potential long entries.
* **SELL ZONE (Red Box):** Plotted after a Sell MSS (breakout to the downside). The zone is defined by the **High and Low of the two candles preceding the last swing High** (`ob_high_top`, `ob_high_btm`). This acts as a simplified "Order Block" for potential short entries.
6. **Alerts:**
* Custom alerts are included to notify the user immediately when a Buy or Sell MSS (Market Structure Shift) is detected.
In summary, the indicator is a visual tool that simplifies price action analysis by drawing structure and highlights potential reversal points (MSS) by painting corresponding re-entry zones (Order Blocks) on the chart.

Fixed $200 Risk Futures Position Sizer (2R Target)This indicator is designed for traders who want to follow a strict, professional-style risk model identical to the rules used in funded futures trading programs. Instead of risking a percentage of the account, the indicator always risks a fixed $200 per trade, regardless of contract or market volatility. This allows traders to simulate evaluation accounts and maintain perfect risk discipline.
The tool works across a wide range of futures markets — including micro, mini, and continuous contracts (MES, MNQ, MNQ1!, MYM, M2K, MCL, MGC, ES1!, NQ1!, GC1!) — and automatically loads the correct tick size and tick value for each contract. This ensures that stop distance and risk calculations are always accurate, even when switching between index futures, metals, or energy markets.
You simply enter your Entry Price and Stop Loss Price, and the indicator calculates:
The stop distance in points and ticks
The exact dollar risk per contract
The maximum number of contracts allowed while staying under a fixed $200 risk
A fully automated 2R take-profit target (equivalent to $400 profit per trade)
Expected profit per contract
Total projected profit based on allowed size
Full long/short direction detection
This makes position sizing effortless and completely rule-based. If the chosen stop-loss distance requires more than $200 of risk per contract, the indicator will automatically show 0 contracts allowed, preventing invalid trades and helping maintain consistency.
For clarity and execution, the indicator also plots:
A green Entry Line
A red Stop-Loss Line
A blue 2R Take-Profit Line
This produces a visual, easy-to-understand risk-to-reward layout directly on the chart.
This tool is ideal for traders preparing for funded account challenges, traders practicing mechanical risk systems, or anyone who wants to enforce a strict, repeatable risk framework. It eliminates guesswork, improves consistency, and helps traders build discipline by sizing every trade according to a fixed dollar risk with a precise 2R reward objective.

Crypto Leverage Index(OI Norm. + FR)Crypto Leverage Index (OI Z-Score + Funding Rate Signals)
(A tool for detecting speculative extremes and leverage load in crypto derivatives markets.)
Hello, fellow traders around the globe!
In today's crypto futures market, often perceived as a 'playground for large players' (whales/smart money), catching extreme leverage behavior is crucial for survival. I wanted to come up with an indicator to quickly identify such market extremes by focusing on the two most potent indicators of leveraged action: Open Interest (OI) and Funding Rate (FR). The goal is to ride on the shoulders of the market movers by anticipating their next liquidity-driven actions. hope this helps.
❗ IMPORTANT NOTE: This indicator works exclusively on Perpetual Futures or Swap Charts that provide Open Interest (OI) data.
⚪ Overview
This indicator provides a standardized view of speculative activity by calculating the Open Interest (OI) Z-Score . This score reveals when the current level of open leverage is abnormally high (premium) or low (discount) relative to its historical mean and volatility. The index is also augmented with Extreme Funding Rate Signals , which plot simple White Dots on the chart when derivative positioning (long or short bias) reaches an unsustainable, overheated level. The combination of OI volume and positioning bias offers a good method to identify potential market reversal zones driven by leverage liquidation risks (short/long squeezes).
⚪ Score Components
Open Interest Z-Score (Leverage Load)
The primary component standardizes the Open Interest value over a defined lookback `Period` (default 50). This calculation reveals the statistical deviation of current leverage from the norm.
OI Z-Score = (OI - Mean(OI)) / StDev(OI)
Funding Rate (Positioning Bias)
Calculates the approximate funding rate using a TWAP (Time-Weighted Average Price) of the Perpetual Futures Premium, combined with the standard 0.01% Interest Rate.
⚪ Extreme Condition Detection
OI Z-Score Extremes
* Premium Zone (Red Fill) : OI Z-Score is above the user-defined `Threshold` (default 2.0). Indicates high/overstretched leverage.
* Discount Zone (Green Fill) : OI Z-Score is below the user-defined negative threshold (default -2.0). Indicates low/unwinded leverage.
Funding Rate Extreme Signals (White Dots)
These appear as small White Dots ( · ) plotted at fixed levels within the indicator pane. The position indicates the bias:
* Top Dot (Excessive Longs) : Triggered when Funding Rate is greater than Abnormal Funding Rate Threshold (e.g. 0.03%). Indicates excessive Long positioning/greed and potential for a short-term reversal (Long Squeeze risk). The dot is plotted at the positive `FR Signal Plot Level`.
* Bottom Dot (Excessive Shorts) : Triggered when Funding Rate is lower than -Abnormal Funding Rate Threshold(e.g. -0.03%). Indicates excessive Short positioning/fear and potential for a short-term reversal (Short Squeeze risk). The dot is plotted at the negative `FR Signal Plot Level`.
⚪ Leverage Case Scenarios (Price, OI Dynamics & Context)
The OI Z-Score reflects the premium/discount state of *leverage* (Open Interest) , not the price. The price may not be in a premium or discount area simply because the OI is. OI only indicates the volume of outstanding futures positions. You must observe price action and candlestick patterns alongside the OI movements to determine the true contextual hint. Understanding the relationship between price and Open Interest (OI) change is key to interpreting market movements. The cases listed below represent the most common and thinkable patterns, but do not exhaust all possible market behaviors.
1. Long Build-Up (Price ▲, OI ▲): New long positions enter, confirming the rising trend.
2. Short Build-Up (Price ▼, OI ▲): New short positions enter, confirming the falling trend. Due to the inherently long-biased nature of the crypto market, this scenario is less frequently observed than Long Build-Up.
3. Long Covering/liquidation (Price ▼, OI ▼): Existing longs are closed/liquidated. This activity usually results from Panic Selling or forced long liquidation.
4. Short Covering (Price ▲, OI ▼): Existing shorts are forced to close (Short Squeeze).
5. Long Trap (Price ▲, OI ▲ or ▼): Price rises, but OI suggests new positioning that might be trapping longs. Bearish candle pattern can be often shown with the sweep.
6. Short Trap (Price ▼, OI ▲ or ▼): Warning Sign - Price falls, but OI suggests new positioning that might be trapping shorts.
⚪ Key Input Parameters
OI Z-Score
* Period (Default: 50)
Determines how many recent bars are used to calculate the rolling mean and volatility (standard deviation) of the Open Interest data.
* Z-Score Threshold (Default: 2.0)
The critical level that the OI Z-Score must cross to be considered 'extreme' (overstretched leverage).
Funding Rate
* Abnormal FR Threshold (Default: 0.03)
The absolute percentage value (e.g., 0.03%) that the Funding Rate must exceed or fall below to trigger an extreme signal dot.
* FR Signal Plot Level (Default: 4.0)
Sets the fixed vertical position (Y-level) on the Z-Score chart where the Funding Rate signal dots will appear. (e.g., 4.0 plots the dot at the Z-Score +-4.0 level).
Disclaimer
This script is for educational and informational purposes only and does not constitute financial advice or investment recommendations. Trading cryptocurrencies involves significant risk and you are solely responsible for your own investment decisions, based on your financial situation, objectives, and risk tolerance. The author assumes no liability for losses arising from the use of this indicator.

GIX Analizor strategiiGIX Analyzer – Intelligent Time Filters + X Strategy
This script combines the X Strategy with an advanced system for filtering trades based on time intervals. The strategy allows:
Filtering by preset trading hours (active sessions )
Filtering by a fully customizable time interval (hour + minute, Romania time )
Filtering by calendar range (Start Date → End Date)
Simultaneous activation of both time-filter modes for maximum control
Trading only within valid time ranges, while keeping all logic unchanged
This indicator provides high flexibility for testing and optimizing trading entries based on hours, minutes, and calendar periods—while preserving the simplicity and efficiency of any strategy
