MA Study: Different Types and More [NeoButane]A study of moving averages that utilizes different tricks I've learned to optimize them. Included is Bollinger Bands, Guppy (GMMA) and Super Guppy.
The method used to make it MtF should be more precise and smoother than regular MtF methods that use the security function. For intraday timeframes, each number represents each hour, with 24 equal to 1 day. For daily, 3 is 3 day, for weekly, 4 is the 4 weekly, etc. If you're on a higher timeframe than the one selected, the length will not change.
Log-space is used to make calculations work on many cryptos. The rules for color changing Guppy is changed to make it not as choppy on MAs other than EMA. Note that length does not affect SWMA and VWAP and source does not affect VWAP.
A short summary of each moving average can be found here: medium.com
List of included MAs:
ALMA: Arnaud Legoux
Double EMA
EMA: Exponential
Hull MA
KAMA: Kaufman Adaptive
Linear Regression Curve
LSMA: Least Squares
SMA: Simple
SMMA/RMA: Smoothed/Running
SWMA: Symm. Weighted
TMA: Triangular
Triple EMA
VWMA: Volume Weighted
WMA: Weighted
ZLEMA: Zero Lag
VWAP: Vol Weighted Average
Welles Wilder MA
ค้นหาในสคริปต์สำหรับ "weekly"

Inverted Yield Curve with VIX Fear IndexUS 2 year and US 10 year comparison, inverted yield curve with VIX. I use this on a weekly chart with 2 moving averages, the 40 week (ma200 daily) and the 520 week (10 year median).
The bottom histogram is the VIX and the plot is the yield curve. When the VIX is above a certain level (you can set it in settings) and the ýield curve is close to or at inversion the background goes red.
The last seven recessions were preceded by an inverted yield curve. Here I combined the two main fear indexes, the VIX and the run for safe US treasuries (Inverted Yield Curve).
This is preset to the 2 year and 10 year US bond, weekly, and the normal VIX ticker but you can set it to whatever you like.
Published with source code for anyone to modify. Please comment below if you do so! This is the second in a series of indicators I intend to publish as a package of economic recoverty/recession symptom indicators.
Follow me for updates, next one up is commodities with dr Copper and oil!

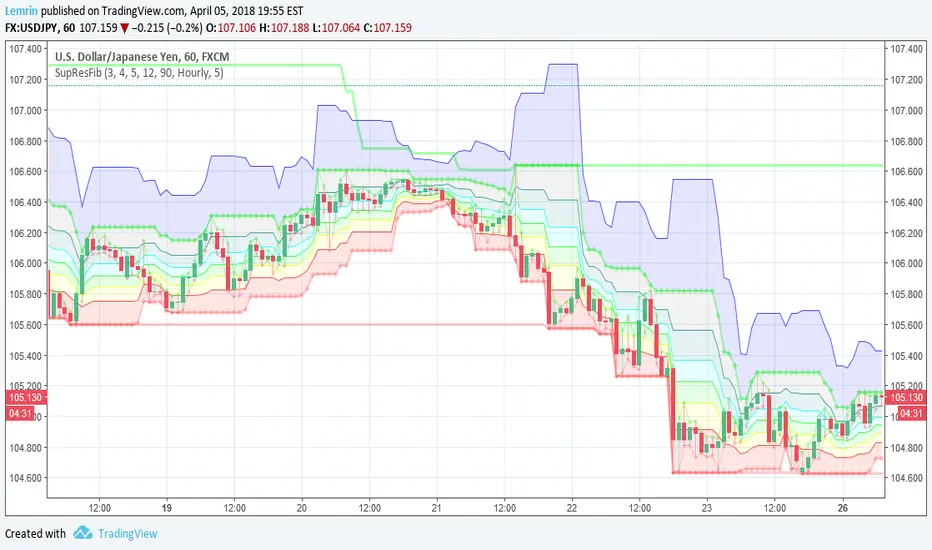
Automatic Support, Resistance, Fibonacci LevelsThis indicator plots absolute high and low values for up to five completely adjustable time periods (in months, weeks, days, hours, minutes) and optionally calculates the Fibonacci levels on the pair of absolutes of your choice, ascending or descending, and mimics the shading available in the built-in Fib charting tools (e.g. retracement).
Here are a few screenshots of the same chart with various options selected.
3-Month, 4-Week, and 5-Day absolutes with 3-Monthly Fib plotted:
The same chart with 4-Weekly Fib:
The same chart with 5-Daily Fib:
5-Day, 12-Hour, 90-Minute absolutes with 12-Hourly Fib:
Zoomed in, on a 30-minute interval, with 90-minute Fib:
With descending ("inverted") 90-minute Fib:
I started putting this together for Vazzyb, who was looking for a way to automate plotting horizontal support and resistance levels for monthly, weekly, and daily extremes, and then I added additional features as they occurred to me. Special thanks to Paaax, who suggested I add Fib levels.
I am leaving the code open, so you may feel free to grab snippets you like and use them for your own purposes. Of particular interest may be my custom "calc_fib()" function, which accepts any series pair, as well as a Boolean indicating whether to invert, and returns an array with each of the major Fibonacci levels: .
If anyone likes this enough to feel generous, please feel free:
BTC
3KmFchJ18QvMzAJKDcFQXvyK9p1EHWQdhP
BCH
qqtrw64ptuwprk5vtj3z8qwkvh3v0jawxq7khqng7x
ETH
0x9b51361A278910Ba3945C7519C9f0FA8a77df18d
LTC
MDeWWsP7XCG2zQuZ2dYALZXQ52u2qkc8fh
P.S. If you want the time lengths to be as close to accurate as possible, don't forget to change the number of days per week when using for cryptocurrency!
Dual Timeframe SMA Ribbon CrossoverCopyright by RJ 3/2018
Should be used with lower timeframe and higher timeframe charts
First set your chart to the lower timeframe you'd like to analyze
see f.bpcdn.co
For this method, low timeframe/high suitable timeframe pairs are:
5min with 30min parent
15min with 1hr parent
30min with 4hr parent
4hr with daily parent
daily with weekly parent
weekly with monthly parent
On lower timeframe chart - Plot of 2 smas length 6, 1 Offset
If smas cross - and bar crosses the sma convergence, and full body of bar crosses SMAs - then this is a buy or sell opportunity
For confirmation - on the higher timeframe chart, check if bar is above or below the smas for that day

Auto DayWeekMonth Fib Levels R2 by JustUncleLThis indicator automatically draws up to Three Sets of Fibonacci Pivot levels based on the previous Candle period's Range (High-Low). The HLC3 is used as the default Pivotal level. Only the most Recent period Candle Levels are displayed. The longer Weekly and Monthly sets are particularly useful in finding long term Supply and Demand levels.
The three sets of selectable periods are spit into the following sets:
Daily Set (1,2,3,4,5,7,10 or 14 Days)
Weekly Set (1,2,3,4,5,10, or 13 Weeks)
Monthly Set (1,2,3,4,5,6,9 or 12 months)
Each set has the option to display Extension levels.
The Pivotal Level HLC3 and Range = (High - Low), are extracted from previous Period Candle.
FIB LEVELS Colours (same in each period set):
Yellow = Pivot and Pivot Zone (HLC3 by default)
Fuchsia = R1,S1 Levels 0.368 * Range
Lime = R2,S2 Levels 0.618 * Range
Red = R3,S3 Levels 0.786 * Range
Aqua = R4,S4 Levels 1.000 * Range
Green = R5,S5 Levels 1.236 * Range
Orange = R6,S6 Levels 1.382 * Range
Black = R7,S7 Levels 1.618 * Range
Maroon = R8,S8 Levels 2.000 * Range

Pullback Trading Tool R5-65 by JustUncleLBy request this is an updated version of the "PullBack Trading Tool": removes experimental "OCC" channel, added option to display ribbons or just single moving average lines, added alert arrows for "PB" exits, added alertcondition for TV alarm subsystem, added some extract options for Pivot points and general cleanup of code.
Description:
This project incorporates the majority of the indicators needed to analyse and trade Trends for Pullbacks, swings and reversals.
Incorporated within this tool are the following indicators:
1. Major industry (Banks) recognised important EMAs in an EMA Ribbon:
Lime = EMA5 (Optional Display)
DodgerBlue = EMA12 (Optional Display)
Red = EMA36 (Optional display)
Green = EMA89
Blue = EMA200
Black = EMA633
2. The 5 EMA (default) High/Low/Close Price Action Channel (PAC), the PAC channel display is disabled by default.
3. Optionally display Fractals and optional Fractal levels
4. Optional HH, LH, LL, HL finder.
5. Optional Buy/Sell "PB" exit Alerts with Optional 200EMA filter.
6. Coloured coded Bar high lighting based on the PAC:
blue = bar closed above PAC
red = bar closed below PAC
gray = bar closed inside PAC
7. Alert condition sent to TradingView's Alarm subsystem for PB exits.
8. Pivot points with optional labels.
9. EMA5-12 Ribbon is displayed by default.
10.EMA12-36 Ribbon is displayed by default
Set up and hints:
I am unable to provide a full description here, as Pullback Trading incorporates a full trading Methodology, there are a number of articles and books written on the subject.
Set the chart to Heikin Ashi Candles (optional).
I also add a "Sweetspot Gold R3" indicator to the chart as well to help with support and resistance finding and shows where the important "00" lines are.
First on a weekly basis say Sunday night or Monday morning, analyse the Daily and Weekly charts to establish overall trends, and support/resistant levels. Draw significant mini trend lines (2/3 TL), vertical trend lines (VTL) and S/R levels. Can use the Pivots points to guide VTL drawing and Fractals to help guide 2/3 TL drawing.
Once the trend direction and any potential major reversals highlighted, drop down to lower timeframe chart and draw appropriate mini Trend line (2/3 TL) matching the established momentum direction. Take note of potential pull backs from and of the EMAs, in particular the EMA5-12 ribbon, EMA12-36 Ribbon and the 200EMA. Can use the Pivots and/or Fractals points to guide your 2/3 TL drawing.
Set a TradingView alarm on the "PBTOOL alert", with the default settings this normally occurs before or during the Break of the manually drawn TL lines.
Once alerted check to see if the TL is broken and is returning to trend away from the EMA lines, this is indicated by bar colour change to trend directional colour.
You can trade that alert or drop down to even lower time frames and perform the same TL analysis there to find trades at the lower TF. Trading at lower TF you will allow tighter Stop loss settings.
Other than the "SweetSpot Gold R3" indicator, you should not need any other indicator to successfully trade trends for Pullbacks and reversals. If you really want another indicator I suggest a momentum one for example: AO ( Awesome Oscillator ), MACD or Squeeze Momentum.

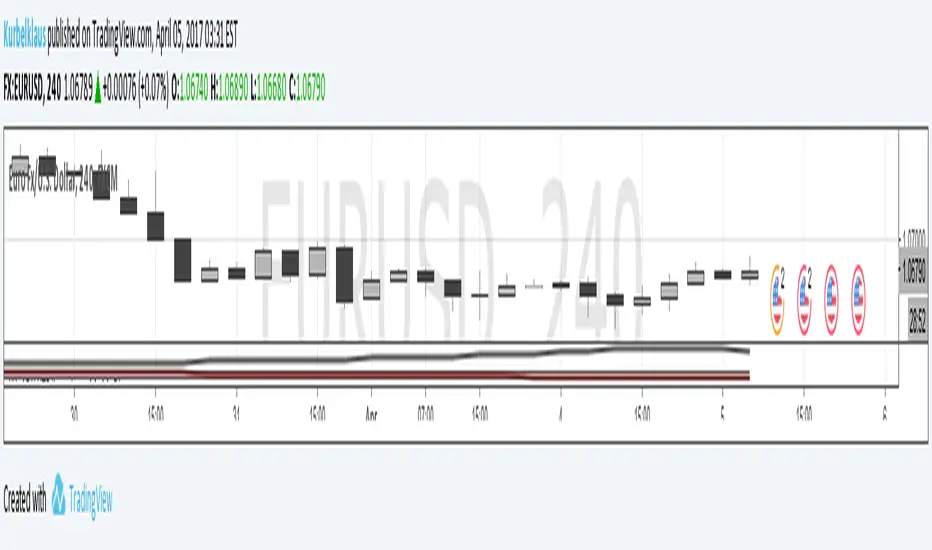
KK_Average Directional Index (ADX) Higher TFHey guys,
sometimes you just want to plot an Indicator value from a higher Timeframe on your Chart. For most Indicators this is pretty straightforward however there is one Indicator that has been giving me quite a headache while trying to do this: The Average Directional Index . Anyway after going through almost 200 versions of this script I finally found a solution that works and thought I would share this with you, since I'm sure some of you have encountered the same problem.
How it works
Go to your desired Instrument/Timeframe and add the Script
Under Settings in the field for "Higher ADX TF" put the Timeframe-code you want to pull the ADX Values from.
- Codes: Monthly - M, Weekly W, Daily - D
- Codes Intraday: The amount of hours in minutes, e.g. if you want to pull values from the 4h-Chart the code is 240 (60 for 1h, 15 for 15m ...)
In some cases (see below) the calculation might not be correct. So make sure the values are correct:
a) Write down the latest ADX of the higher TF while you are on the lower TF
b) Switch the Resolution to the higher TF
c) Compare the value you have just written down to the next to last value. They should be the same.
d) Switch back the Resolution to the lower TF and you're good to go.
Limitations
You can only pull values from higher Timeframes, e.g. you're on a 4h Chart, so you can only pull values from the Daily, Weekly and Monthly Chart. You can't pull values from the 1h Chart.
You can only pull values from Timeframes, where the higher Timeframe Close always has a corresponding Close on the lower Timeframe, e.g. you can't pull values from the 3h Chart when you are on a 2h Chart. This should be pretty rare.
The Script needs a certain amount of Data from the Higher TF before the calculated values are correct. I have tested this on several Instruments and the Script usually needs approximately 100 Bars on the higher Timeframe (often less) for the values to be correct (error < 1%).
So when the difference between your lower Timeframe and you higher Timeframe is large, e.g. you want to pull the Daily ADX value on a 15m-Chart, the calculation can be wrong. This can lead to errors in 2 Cases:
a) Backtesting: When you go over old data and get close to the last available Bar the Data will be wrong. This will limit the amount of data you can backtest.
b) Live values: When the difference between the two Timeframes is too large, it is possible that even live values are wrong, e.g. this will be the case when you are trying to pull the Daily ADX value on a 5 minute Chart. Always check if the calculation works with your desired combination of Timeframes before using it (see above).
I hope this is useful for you and whish all of you successful trading!
Best regards
Kurbelklaus
Range Delta Heiken Ashi Bollinger|Buy/Sell |OB & OS CandlesPurpose: Mathematically represent buying and selling zones for Daily/ Weekly Traders
Indicator: Calculates moving average of the candle's body with respect to the daily trading range
Buy and Sell Signals: Calculates Bollinger Range with Max/Min and Buy/Sell Bollinger signals
Overbought and Oversold Signals: Candlesticks show overbought and oversold conditions
Level of Difficulty: This indicator was written to make life easier. Follow the Rules and anyone can use it.
Rule 1: Buy when candlestick is below "purple" line
Rule 2: Sell when candlestick is above "blue" line
Rule 3: Add bollinger bands to your currency chart
Rule 4: Confirm indicator bollinger bands with currency chart's bollinger bands
Rule 5: Trade in direction of trend
Rule 6: As with all trading; no indicators are fool proof. Please trade responsibly.
****Full Customization for you****
Suggestion 1: Add bollinger bands to currency chart to improve probability
Suggestion 2: Trade the direction of Trend
Suggestion 3: This indicator works very well with Ranged Markets (or use Suggestion 2)
Disclaimer 1: This Indicator words best on Daily and Weekly time frames
Disclaimer 2: Enjoy the Indicator and feel free to ADD COMMENTS; I worked very hard for you and me :)

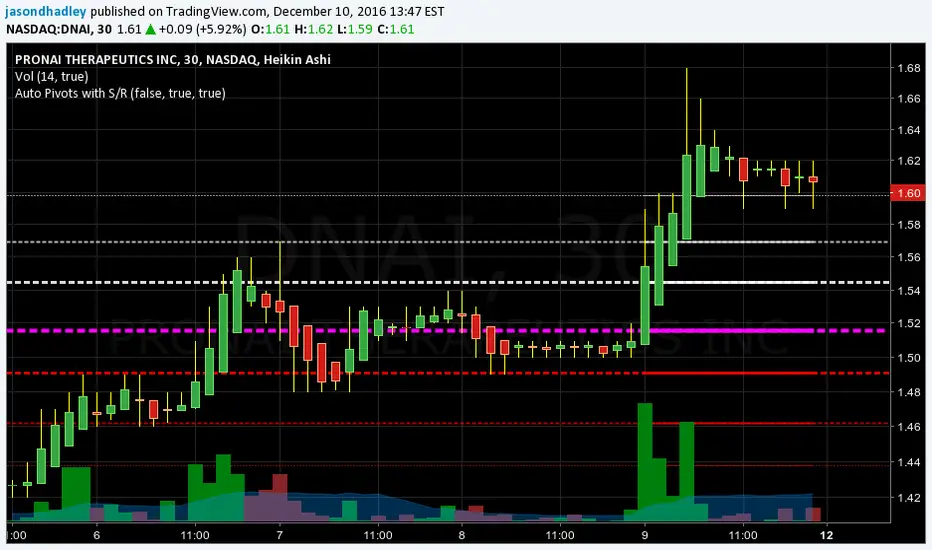
Auto Pivots with S/R LevelsPlots out the pivot point with corresponding Support / Resistance levels.
It will automatically determine the time frame to calculate pivots based on the current view resolution.
Monthly resolution will pull a yearly pivot
Weekly resolution will pull a monthly pivot
Daily view will pull a weekly pivot
Intraday view will pull a daily pivot.
You have the choice of using Standard pivots or Fibonacci pivots
You can choose to only display the most recent pivot or all pivots
You can chose to extend the most recent pivot across the whole chart as a price line
TODO:
- Add in the ability to choose how far back historically to display pivots
- Add in calculations for smaller resolutions to calculate off lower time frames. EX: minute resolution should pull hour time frame to calculate pivots.
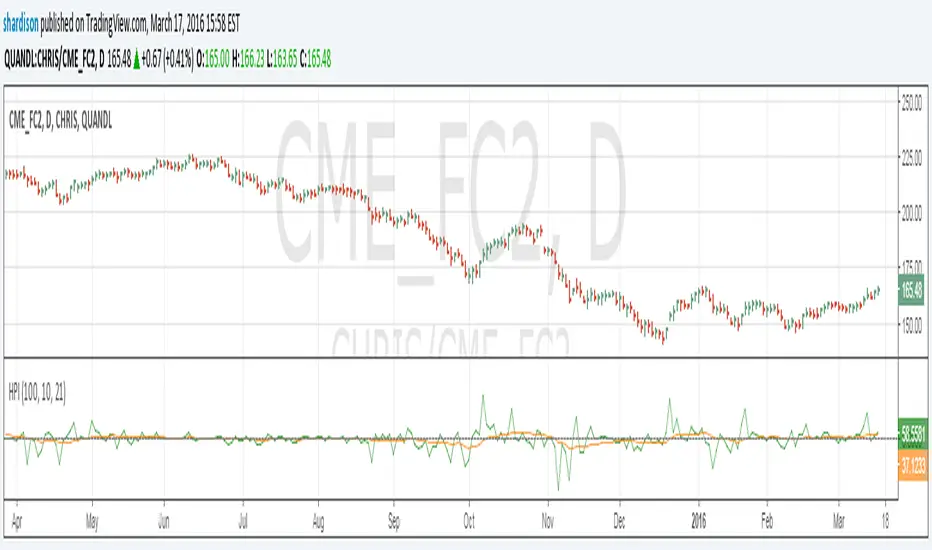
Herrick Payoff Index for Quandl DataUpdate to my previous Herrick Payoff Index script. This script pulls Quandl futures data with daily open interest. The prior version only used the weekly Commitment of Traders open interest data so could only be used on weekly bars. Note: Must use Quandl Symbol methodology in chart (i.e. enter symbol as QUANDL:CHRIS/CME_FC2, QUANDL:CME/FCX2016, ect.). Unfortunately, I haven't been able to program this to pull from the embedded futures data.
UCS_S_Stochastic Pop and Drop StrategyMy Contribution to Jake Bernstein Educational Series, Initiated by Chris Moody.
The Stochastic Pop was developed by Jake Bernstein and modified by David Steckler. Bernstein's original Stochastic Pop is a trading strategy that identifies price pops when the Stochastic Oscillator surges above 80. Steckler modified this strategy by adding conditional filters using the Average Directional Index (ADX) and the weekly Stochastic Oscillator.
Modifications
1. Weekly Stochastic Oscillator for Trading Bias = 5* Daily Stochastic
2. Optional Volume Confirmation, Custom Average Volume Length
Future Plans
1. Adding Triggers for Entry, Stops and Target. - This will be release when we have ability to code the complete Strategy. Although it can be done with the current pinescript options, it would be far more easier if we have strategy ability.
Link for Educational Purpose
stockcharts.com
-
Good Luck Trading
UCSgears

Levels & Plans - by TenAMTrader📍 Levels & Plans — by TenAMTrader
Successful trading is rarely about predicting — it’s about preparing.
Levels & Plans is designed to bridge the gap between analysis and execution by forcing clarity before the trade ever happens. Instead of reacting to price in real time, this tool encourages traders to define their plan, map their key levels, and then simply trade what they already decided.
🧠 Why Planning Matters
Most trading mistakes don’t come from bad analysis — they come from abandoning a plan mid-trade. Emotions take over when levels aren’t clearly defined ahead of time.
This indicator is built around a simple philosophy:
Make the plan first. Trade the plan second.
By writing your thesis directly into the indicator and visually anchoring it to price, you remove ambiguity and hesitation when the market starts moving.
📊 What This Indicator Does
Converts your written trade plan or market outlook into clearly plotted price levels
Automatically identifies:
Pivot level (key decision point)
Resistance levels (above pivot)
Support levels (below pivot)
Displays contextual notes directly on the chart so you always remember why a level matters
Keeps your focus on execution, not interpretation.
✍️ How to Use It
Paste your daily or weekly plan into the Input your Plan/Levels box
Let the script extract and plot the levels automatically
Observe how price behaves around predefined zones
Execute only what aligns with your original plan
No guesswork. No moving targets.
🎯 Designed For
Traders who value structure and discipline
Futures, index, and equity traders who trade key levels
Traders focused on process over prediction
Trade prepared. Trade disciplined.
"Plan your trade, trade your plan."
— TenAMTrader
⚠️ Important Disclaimer
This indicator is provided for educational and informational purposes only and does not constitute financial advice, investment advice, or a recommendation to buy or sell any security, futures contract, or financial instrument.
Trading involves substantial risk and is not suitable for all investors. Past performance is not indicative of future results. All trading decisions, risk management, and position sizing are the sole responsibility of the user.
By using this indicator, you acknowledge that TenAMTrader assumes no liability for any losses, damages, or decisions made based on its use.

[AlscapeLabs] HTF Candle Stack (Multi-Timeframe)
Overview
The HTF Candle Stack (Multi-TF) indicator is a powerful visualization tool designed to overlay high-timeframe (HTF) price action directly onto your current chart, independent of the chart's price scale. This gives traders a clear, aligned, and non-overlapping view of simultaneous price movements across customizable timeframes.
By stacking the candles horizontally next to the chart's price action, the indicator allows for quick identification of multi-timeframe correlation, trend confluence, and key levels without switching chart timeframes.
Key Features
6 Independent Stacks: Configure up to 6 separate timeframes (e.g., 5m, 15m, 1H, 4H, Daily, Weekly) to view the complete market fractals from micro to macro.
Price-Aligned Visualization : All HTF candle stacks are perfectly aligned with the main chart's vertical price axis
Replay Mode Safe : Includes dedicated logic to prevent "duplicate candles" during Bar Replay, ensuring accurate backtesting and historical analysis.
Toggleable Stacks : Each stack can be individually enabled or disabled via input settings
Dynamic Spacing : The distance between active stacks is automatically calculated and adjusted based on the visibility of the preceding stack.
Settings Guide
Stack Configuration (1 - 6)
Each of the six stacks has identical controls:
Show/Hide : Enable or disable this specific stack.
Timeframe : The specific HTF to display (e.g., "60" for 1 Hour, "D" for Daily).
[*} Count : How many candles to show in this stack (Current Active Candle + Past Closed Candles). Tip: Use higher counts (10-12) for lower TFs (Stack 1-2) and lower counts (2-4) for higher TFs (Stack 5-6)
Candle Color
Controls global coloring
Bullish / Bearish : Customize the body colors.
Wick : Separate control for wick color and transparency
Layout
Distance from Chart : How far (in bars) to the right the first stack begins
Space between Stacks : The gap (in bars) between each active stack.
Candle Width : The thickness of the HTF candles.
Labels
Displays a time-frame next to the active (live) candle in each stack
Show TF Labels : Enable or disable labels through all stacks
Text Color : Label text color
Background : Label background color
Style : Label position (Left, Down)
Size : Label text size (Tiny, Small, Normal, Large, Huge)
Developed by AlscapeLabs

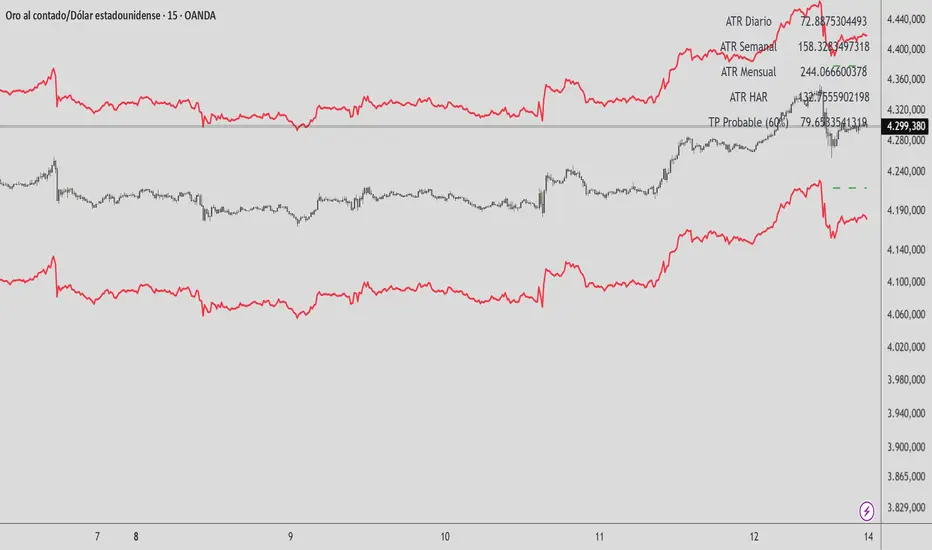
HAR Volatility ATR (Multi-Asset) - Andreus VillalobosIndicator based on the HAR (Hyper-Realized Volatility) model.
Combines daily, weekly, and monthly ATRs to project:
– Most probable price range (90%)
– Most probable take profit (60%)
Does not generate entry signals.
Designed for use in conjunction with:
market structure, liquidity, and price action.
Works on Forex, Indices, Gold, and Cryptocurrencies.

HAR Volatility ATR v1.0 (Andreus Villalobos)
Indicator based on the HAR (Hyper-Realized Volatility) model.
Combines daily, weekly, and monthly ATRs to project:
– Most probable price range (90%)
– Most probable take profit (60%)
Does not generate entry signals.
Designed for use in conjunction with:
market structure, liquidity, and price action.
Works on Forex, Indices, Gold, and Cryptocurrencies.
Market Regime# MARKET REGIME IDENTIFICATION & TRADING SYSTEM
## Complete User Guide
---
## 📋 TABLE OF CONTENTS
1. (#overview)
2. (#regimes)
3. (#indicator-usage)
4. (#entry-signals)
5. (#exit-signals)
6. (#regime-strategies)
7. (#confluence)
8. (#backtesting)
9. (#optimization)
10. (#examples)
---
## OVERVIEW
### What This System Does
This is a **complete market regime identification and trading system** that:
1. **Identifies 6 distinct market regimes** automatically
2. **Adapts trading tactics** to each regime
3. **Provides high-probability entry signals** with confluence scoring
4. **Shows optimal exit points** for each trade
5. **Can be backtested** to validate performance
### Two Components Provided
1. **Indicator** (`market_regime_indicator.pine`)
- Visual regime identification
- Entry/exit signals on chart
- Dynamic support/resistance
- Info tables with live data
- Use for manual trading
2. **Strategy** (`market_regime_strategy.pine`)
- Fully automated backtestable version
- Same logic as indicator
- Position sizing and risk management
- Performance metrics
- Use for backtesting and automation
---
## THE 6 MARKET REGIMES
### 1. 🟢 BULL TRENDING
**Characteristics:**
- Strong uptrend
- Price above SMA50 and SMA200
- ADX > 25 (strong trend)
- Higher highs and higher lows
- DI+ > DI- (bullish momentum)
**What It Means:**
- Market has clear upward direction
- Buyers in control
- Pullbacks are buying opportunities
- Strongest regime for long positions
**How to Trade:**
- ✅ **BUY dips to EMA20 or SMA20**
- ✅ Enter when RSI < 60 on pullback
- ✅ Hold through minor corrections
- ❌ Don't short against the trend
- ❌ Don't sell too early
**Expected Behavior:**
- Pullbacks are shallow (5-10%)
- Bounces are strong
- Support at moving averages holds
- Volume increases on rallies
---
### 2. 🔴 BEAR TRENDING
**Characteristics:**
- Strong downtrend
- Price below SMA50 and SMA200
- ADX > 25 (strong trend)
- Lower highs and lower lows
- DI- > DI+ (bearish momentum)
**What It Means:**
- Market has clear downward direction
- Sellers in control
- Rallies are selling opportunities
- Strongest regime for short positions
**How to Trade:**
- ✅ **SELL rallies to EMA20 or SMA20**
- ✅ Enter when RSI > 40 on bounce
- ✅ Hold through minor bounces
- ❌ Don't buy against the trend
- ❌ Don't cover shorts too early
**Expected Behavior:**
- Rallies are weak (5-10%)
- Selloffs are strong
- Resistance at moving averages holds
- Volume increases on declines
---
### 3. 🔵 BULL RANGING
**Characteristics:**
- Bullish bias but consolidating
- Price near or above SMA50
- ADX < 20 (weak trend)
- Trading in range
- Choppy price action
**What It Means:**
- Uptrend is pausing
- Accumulation phase
- Support and resistance zones clear
- Lower volatility
**How to Trade:**
- ✅ **BUY at support zone**
- ✅ Enter when RSI < 40
- ✅ Take profits at resistance
- ⚠️ Smaller position sizes
- ⚠️ Tighter stops
**Expected Behavior:**
- Range-bound oscillations
- Support bounces repeatedly
- Resistance rejections common
- Eventually breaks higher (usually)
---
### 4. 🟠 BEAR RANGING
**Characteristics:**
- Bearish bias but consolidating
- Price near or below SMA50
- ADX < 20 (weak trend)
- Trading in range
- Choppy price action
**What It Means:**
- Downtrend is pausing
- Distribution phase
- Support and resistance zones clear
- Lower volatility
**How to Trade:**
- ✅ **SELL at resistance zone**
- ✅ Enter when RSI > 60
- ✅ Take profits at support
- ⚠️ Smaller position sizes
- ⚠️ Tighter stops
**Expected Behavior:**
- Range-bound oscillations
- Resistance holds repeatedly
- Support bounces are weak
- Eventually breaks lower (usually)
---
### 5. ⚪ CONSOLIDATION
**Characteristics:**
- No clear direction
- Range compression
- Very low ADX (< 15 often)
- Price inside tight range
- Neutral sentiment
**What It Means:**
- Market is coiling
- Building energy for next move
- Indecision between buyers/sellers
- Calm before the storm
**How to Trade:**
- ✅ **WAIT for breakout direction**
- ✅ Enter on high-volume breakout
- ✅ Direction becomes clear
- ❌ Don't trade inside the range
- ❌ Avoid choppy scalping
**Expected Behavior:**
- Narrow range
- Low volume
- False breakouts possible
- Explosive move when it breaks
---
### 6. 🟣 CHAOS (High Volatility)
**Characteristics:**
- Extreme volatility
- No clear direction
- Erratic price swings
- ATR > 2x average
- Unpredictable
**What It Means:**
- Market panic or euphoria
- News-driven moves
- Emotion dominates logic
- Highest risk environment
**How to Trade:**
- ❌ **STAY OUT!**
- ❌ No positions
- ❌ Wait for stability
- ✅ Protect existing positions
- ✅ Reduce risk
**Expected Behavior:**
- Large intraday swings
- Gaps up/down
- Stop hunts
- Whipsaws
- Eventually calms down
---
## INDICATOR USAGE
### Visual Elements
#### 1. Background Colors
- **Light Green** = Bull Trending (go long)
- **Light Red** = Bear Trending (go short)
- **Light Teal** = Bull Ranging (buy dips)
- **Light Orange** = Bear Ranging (sell rallies)
- **Light Gray** = Consolidation (wait)
- **Purple** = Chaos (stay out!)
#### 2. Regime Labels
- Appear when regime changes
- Show new regime name
- Positioned at highs (bullish) or lows (bearish)
#### 3. Entry Signals
- **Green "LONG"** labels = Buy here
- **Red "SHORT"** labels = Sell here
- Number shows confluence score (X/5 signals)
- Hover for details (stop, target, RSI, etc.)
#### 4. Exit Signals
- **Orange "EXIT LONG"** = Close long position
- **Orange "EXIT SHORT"** = Close short position
- Shows exit reason in tooltip
#### 5. Support/Resistance Lines
- **Green line** = Dynamic support (buy zone)
- **Red line** = Dynamic resistance (sell zone)
- Adapts to regime automatically
#### 6. Moving Averages
- **Blue** = SMA 20 (short-term trend)
- **Orange** = SMA 50 (medium-term trend)
- **Purple** = SMA 200 (long-term trend)
### Information Tables
#### Top Right Table (Main Info)
Shows real-time market conditions:
- **Current Regime** - What regime we're in
- **Bias** - Long, Short, Breakout, or Stay Out
- **ADX** - Trend strength (>25 = strong)
- **Trend** - Strong, Moderate, or Weak
- **Volatility** - High or Normal
- **Vol Ratio** - Current vs average volatility
- **RSI** - Momentum (>70 overbought, <30 oversold)
- **vs SMA50/200** - Price position relative to MAs
- **Support/Resistance** - Exact price levels
- **Long/Short Signals** - Confluence scores (X/5)
#### Bottom Right Table (Regime Guide)
Quick reference for each regime:
- What action to take
- What strategy to use
- Color-coded for quick identification
---
## ENTRY SIGNALS EXPLAINED
### Confluence Scoring System (5 Factors)
Each entry signal is scored 0-5 based on how many factors align:
#### For LONG Entries:
1. ✅ **Regime Alignment** - In Bull Trending or Bull Ranging
2. ✅ **RSI Pullback** - RSI between 35-50 (not overbought)
3. ✅ **Near Support** - Price within 2% of dynamic support
4. ✅ **MACD Turning Up** - Momentum shifting bullish
5. ✅ **Volume Confirmation** - Above average volume
#### For SHORT Entries:
1. ✅ **Regime Alignment** - In Bear Trending or Bear Ranging
2. ✅ **RSI Rejection** - RSI between 50-65 (not oversold)
3. ✅ **Near Resistance** - Price within 2% of dynamic resistance
4. ✅ **MACD Turning Down** - Momentum shifting bearish
5. ✅ **Volume Confirmation** - Above average volume
### Confluence Requirements
**Minimum Confluence** (default = 2):
- 2/5 = Entry signal triggered
- 3/5 = Good signal
- 4/5 = Strong signal
- 5/5 = Excellent signal (rare)
**Higher confluence = Higher probability = Better trades**
### Specific Entry Patterns
#### 1. Bull Trending Entry
```
Requirements:
- Regime = Bull Trending
- Price pulls back to EMA20
- Close above EMA20 (bounce)
- Up candle (close > open)
- RSI < 60
- Confluence ≥ 2
```
#### 2. Bear Trending Entry
```
Requirements:
- Regime = Bear Trending
- Price rallies to EMA20
- Close below EMA20 (rejection)
- Down candle (close < open)
- RSI > 40
- Confluence ≥ 2
```
#### 3. Bull Ranging Entry
```
Requirements:
- Regime = Bull Ranging
- RSI < 40 (oversold)
- Price at or below support
- Up candle (reversal)
- Confluence ≥ 1 (more lenient)
```
#### 4. Bear Ranging Entry
```
Requirements:
- Regime = Bear Ranging
- RSI > 60 (overbought)
- Price at or above resistance
- Down candle (rejection)
- Confluence ≥ 1 (more lenient)
```
#### 5. Consolidation Breakout
```
Requirements:
- Regime = Consolidation
- Price breaks above/below range
- Volume > 1.5x average (explosive)
- Strong directional candle
```
---
## EXIT SIGNALS EXPLAINED
### Three Types of Exits
#### 1. Regime Change Exits (Automatic)
- **Long Exit**: Regime changes to Bear Trending or Chaos
- **Short Exit**: Regime changes to Bull Trending or Chaos
- **Reason**: Market character changed, strategy no longer valid
#### 2. Support/Resistance Break Exits
- **Long Exit**: Price breaks below support by 2%
- **Short Exit**: Price breaks above resistance by 2%
- **Reason**: Key level violated, trend may be reversing
#### 3. Momentum Exits
- **Long Exit**: RSI > 70 (overbought) AND down candle
- **Short Exit**: RSI < 30 (oversold) AND up candle
- **Reason**: Overextension, take profits
### Stop Loss & Take Profit
**Stop Loss** (Automatic in strategy):
- Placed at Entry - (ATR × 2)
- Adapts to volatility
- Protected from whipsaws
- Typically 2-4% for stocks, 5-10% for crypto
**Take Profit** (Automatic in strategy):
- Placed at Entry + (Stop Distance × R:R Ratio)
- Default 2.5:1 reward:risk
- Example: $2 risk = $5 reward target
- Allows winners to run
---
## TRADING EACH REGIME
### BULL TRENDING - Most Profitable Long Environment
**Strategy: Buy Every Dip**
**Entry Rules:**
1. Wait for pullback to EMA20 or SMA20
2. Look for RSI < 60
3. Enter when candle closes above MA
4. Confluence should be 2+
**Stop Loss:**
- Below the recent swing low
- Or 2 × ATR below entry
**Take Profit:**
- At previous high
- Or 2.5:1 R:R minimum
**Position Size:**
- Can use full size (2% risk)
- High win rate regime
**Example Trade:**
```
Price: $100, pulls back to $98 (EMA20)
Entry: $98.50 (close above EMA)
Stop: $96.50 (2 ATR)
Target: $103.50 (2.5:1)
Risk: $2, Reward: $5
```
---
### BEAR TRENDING - Most Profitable Short Environment
**Strategy: Sell Every Rally**
**Entry Rules:**
1. Wait for bounce to EMA20 or SMA20
2. Look for RSI > 40
3. Enter when candle closes below MA
4. Confluence should be 2+
**Stop Loss:**
- Above the recent swing high
- Or 2 × ATR above entry
**Take Profit:**
- At previous low
- Or 2.5:1 R:R minimum
**Position Size:**
- Can use full size (2% risk)
- High win rate regime
**Example Trade:**
```
Price: $100, rallies to $102 (EMA20)
Entry: $101.50 (close below EMA)
Stop: $103.50 (2 ATR)
Target: $96.50 (2.5:1)
Risk: $2, Reward: $5
```
---
### BULL RANGING - Buy Low, Sell High
**Strategy: Range Trading (Long Bias)**
**Entry Rules:**
1. Wait for price at support zone
2. Look for RSI < 40
3. Enter on reversal candle
4. Confluence should be 1-2+
**Stop Loss:**
- Below support zone
- Tighter than trending (1.5 ATR)
**Take Profit:**
- At resistance zone
- Don't hold through resistance
**Position Size:**
- Reduce to 1-1.5% risk
- Lower win rate than trending
**Example Trade:**
```
Range: $95-$105
Entry: $96 (at support, RSI 35)
Stop: $94 (below support)
Target: $104 (at resistance)
Risk: $2, Reward: $8 (4:1)
```
---
### BEAR RANGING - Sell High, Buy Low
**Strategy: Range Trading (Short Bias)**
**Entry Rules:**
1. Wait for price at resistance zone
2. Look for RSI > 60
3. Enter on rejection candle
4. Confluence should be 1-2+
**Stop Loss:**
- Above resistance zone
- Tighter than trending (1.5 ATR)
**Take Profit:**
- At support zone
- Don't hold through support
**Position Size:**
- Reduce to 1-1.5% risk
- Lower win rate than trending
**Example Trade:**
```
Range: $95-$105
Entry: $104 (at resistance, RSI 65)
Stop: $106 (above resistance)
Target: $96 (at support)
Risk: $2, Reward: $8 (4:1)
```
---
### CONSOLIDATION - Wait for Breakout
**Strategy: Breakout Trading**
**Entry Rules:**
1. Identify consolidation range
2. Wait for VOLUME SURGE (1.5x+ avg)
3. Enter on close outside range
4. Direction must be clear
**Stop Loss:**
- Opposite side of range
- Or 2 ATR
**Take Profit:**
- Measure range height, project it
- Example: $10 range = $10 move expected
**Position Size:**
- Reduce to 1% risk
- 50% false breakout rate
**Example Trade:**
```
Consolidation: $98-$102 (4-point range)
Breakout: $102.50 (high volume)
Entry: $103
Stop: $100 (back in range)
Target: $107 (4-point range projected)
Risk: $3, Reward: $4
```
---
### CHAOS - STAY OUT!
**Strategy: Preservation**
**What to Do:**
- ❌ NO new positions
- ✅ Close existing positions if near entry
- ✅ Tighten stops on profitable trades
- ✅ Reduce position sizes dramatically
- ✅ Wait for regime to stabilize
**Why It's Dangerous:**
- Stop hunts are common
- Whipsaws everywhere
- News-driven volatility
- No technical reliability
- Even "perfect" setups fail
**When Does It End:**
- Volatility ratio drops < 1.5
- ADX starts rising (direction appears)
- Price respects support/resistance again
- Usually 1-5 days
---
## CONFLUENCE SYSTEM
### How It Works
The system scores each potential entry on 5 factors. More factors aligning = higher probability.
### Confluence Requirements by Regime
**Trending Regimes** (strictest):
- Minimum 2/5 required
- 3/5 = Good
- 4-5/5 = Excellent
**Ranging Regimes** (moderate):
- Minimum 1-2/5 required
- 2/5 = Good
- 3+/5 = Excellent
**Consolidation** (breakout only):
- Volume is most critical
- Direction confirmation
- Less confluence needed
### Adjusting Minimum Confluence
**If too few signals:**
- Lower from 2 to 1
- More trades, lower quality
**If too many false signals:**
- Raise from 2 to 3
- Fewer trades, higher quality
**Recommendation:**
- Start at 2
- Adjust based on win rate
- Aim for 55-65% win rate
---
## STRATEGY BACKTESTING
### Loading the Strategy
1. Copy `market_regime_strategy.pine`
2. Open Pine Editor in TradingView
3. Paste and "Add to Chart"
4. Strategy Tester tab opens at bottom
### Initial Settings
```
Risk Per Trade: 2%
ATR Stop Multiplier: 2.0
Reward:Risk Ratio: 2.5
Trade Longs: ✓
Trade Shorts: ✓
Trade Trending Only: ✗ (test both)
Avoid Chaos: ✓
Minimum Confluence: 2
```
### What to Look For
**Good Results:**
- Win Rate: 50-60%
- Profit Factor: 1.8-2.5
- Net Profit: Positive
- Max Drawdown: <20%
- Consistent equity curve
**Warning Signs:**
- Win Rate: <45% (too many losses)
- Profit Factor: <1.5 (barely profitable)
- Max Drawdown: >30% (too risky)
- Erratic equity curve (unstable)
### Testing Different Regimes
**Test 1: Trending Only**
```
Trade Trending Only: ✓
Result: Higher win rate, fewer trades
```
**Test 2: All Regimes**
```
Trade Trending Only: ✗
Result: More trades, potentially lower win rate
```
**Test 3: Long Only**
```
Trade Longs: ✓
Trade Shorts: ✗
Result: Works in bull markets
```
**Test 4: Short Only**
```
Trade Longs: ✗
Trade Shorts: ✓
Result: Works in bear markets
```
---
## SETTINGS OPTIMIZATION
### Key Parameters to Adjust
#### 1. Risk Per Trade (Most Important)
- **0.5%** = Very conservative
- **1.0%** = Conservative (recommended for beginners)
- **2.0%** = Moderate (recommended)
- **3.0%** = Aggressive
- **5.0%** = Very aggressive (not recommended)
**Impact:** Higher risk = higher returns BUT bigger drawdowns
#### 2. Reward:Risk Ratio
- **2:1** = More wins needed, hit target faster
- **2.5:1** = Balanced (recommended)
- **3:1** = Fewer wins needed, hold longer
- **4:1** = Very patient, best in trending
**Impact:** Higher R:R = can have lower win rate
#### 3. Minimum Confluence
- **1** = More signals, lower quality
- **2** = Balanced (recommended)
- **3** = Fewer signals, higher quality
- **4** = Very selective
- **5** = Almost never triggers
**Impact:** Higher = fewer but better trades
#### 4. ADX Thresholds
- **Trending: 20-30** (default 25)
- Lower = detect trends earlier
- Higher = only strong trends
- **Ranging: 15-25** (default 20)
- Lower = identify ranging earlier
- Higher = only weak trends
#### 5. Trend Period (SMA)
- **20-50** = Short-term trends
- **50** = Medium-term (default, recommended)
- **100-200** = Long-term trends
**Impact:** Longer period = slower regime changes, more stable
### Optimization Workflow
**Step 1: Baseline**
- Use all default settings
- Test on 3+ years
- Record: Win Rate, PF, Drawdown
**Step 2: Risk Optimization**
- Test 1%, 1.5%, 2%, 2.5%
- Find best risk-adjusted return
- Balance profit vs drawdown
**Step 3: R:R Optimization**
- Test 2:1, 2.5:1, 3:1
- Check which maximizes profit factor
- Consider holding time
**Step 4: Confluence Optimization**
- Test 1, 2, 3
- Find sweet spot for win rate
- Aim for 55-65% win rate
**Step 5: Regime Filter**
- Test with/without trend filter
- Test with/without chaos filter
- Find what works for your asset
---
## REAL TRADING EXAMPLES
### Example 1: Bull Trending - SPY
**Setup:**
- Regime: BULL TRENDING
- Price pulls back from $450 to $445
- EMA20 at $444
- RSI drops to 45
- Confluence: 4/5
**Entry:**
- Price closes at $445.50 (above EMA20)
- LONG signal appears
- Enter at $445.50
**Risk Management:**
- Stop: $443 (2 ATR = $2.50)
- Target: $451.75 (2.5:1 = $6.25)
- Risk: $2.50 per share
- Position: 80 shares (2% of $10k = $200 risk)
**Outcome:**
- Price rallies to $452 in 3 days
- Target hit
- Profit: $6.50 × 80 = $520
- Return: 2.6 × risk (excellent)
---
### Example 2: Bear Ranging - AAPL
**Setup:**
- Regime: BEAR RANGING
- Range: $165-$175
- Price rallies to $174
- Resistance at $175
- RSI at 68
- Confluence: 3/5
**Entry:**
- Rejection candle at $174
- SHORT signal appears
- Enter at $173.50
**Risk Management:**
- Stop: $176 (above resistance)
- Target: $166 (support)
- Risk: $2.50
- Position: 80 shares
**Outcome:**
- Price drops to $167 in 2 days
- Target hit
- Profit: $6.50 × 80 = $520
- Return: 2.6 × risk
---
### Example 3: Consolidation Breakout - BTC
**Setup:**
- Regime: CONSOLIDATION
- Range: $28,000 - $30,000
- Compressed for 2 weeks
- Volume declining
**Breakout:**
- Price breaks $30,000
- Volume surges 200%
- Close at $30,500
- LONG signal
**Entry:**
- Enter at $30,500
**Risk Management:**
- Stop: $29,500 (back in range)
- Target: $32,000 (range height = $2k)
- Risk: $1,000
- Position: 0.2 BTC ($200 risk on $10k)
**Outcome:**
- Price runs to $33,000
- Target exceeded
- Profit: $2,500 × 0.2 = $500
- Return: 2.5 × risk
---
### Example 4: Avoiding Chaos - Tesla
**Setup:**
- Regime: BULL TRENDING
- LONG position from $240
- Elon tweets something crazy
- Regime changes to CHAOS
**Action:**
- EXIT signal appears
- Close position immediately
- Current price: $242 (small profit)
**Outcome:**
- Next 3 days: wild swings
- High $255, Low $230
- By staying out, avoided:
- Potential stop out
- Whipsaw losses
- Stress
**Result:**
- Small profit preserved
- Capital protected
- Re-enter when regime stabilizes
---
## ALERTS SETUP
### Available Alerts
1. **Bull Trending Regime** - Market goes bullish
2. **Bear Trending Regime** - Market goes bearish
3. **Chaos Regime** - High volatility, stay out
4. **Long Entry Signal** - Buy opportunity
5. **Short Entry Signal** - Sell opportunity
6. **Long Exit Signal** - Close long
7. **Short Exit Signal** - Close short
### How to Set Up
1. Click **⏰ (Alert)** icon in TradingView
2. Select **Condition**: Choose indicator + alert type
3. **Options**: Popup, Email, Webhook, etc.
4. **Message**: Customize notification
5. Click **Create**
### Recommended Alert Strategy
**For Active Traders:**
- Long Entry Signal
- Short Entry Signal
- Long Exit Signal
- Short Exit Signal
**For Position Traders:**
- Bull Trending Regime (enter longs)
- Bear Trending Regime (enter shorts)
- Chaos Regime (exit all)
**For Conservative:**
- Only regime change alerts
- Manually review entries
- More selective
---
## TIPS FOR SUCCESS
### 1. Start Small
- Paper trade first
- Then 0.5% risk
- Build to 1-2% over time
### 2. Follow the Regime
- Don't fight it
- Adapt your style
- Different tactics for each
### 3. Trust the Confluence
- 4-5/5 = Best trades
- 2-3/5 = Good trades
- 1/5 = Skip unless desperate
### 4. Respect Exits
- Don't hope and hold
- Cut losses quickly
- Take profits at targets
### 5. Avoid Chaos
- Seriously, just stay out
- Protect your capital
- Wait for clarity
### 6. Keep a Journal
- Record every trade
- Note regime and confluence
- Review weekly
- Learn patterns
### 7. Backtest Thoroughly
- 3+ years minimum
- Multiple market conditions
- Different assets
- Walk-forward test
### 8. Be Patient
- Best setups are rare
- 1-3 trades per week is normal
- Quality over quantity
- Compound over time
---
## COMMON QUESTIONS
**Q: How many trades per month should I expect?**
A: Depends on timeframe and settings. Daily chart: 5-15 trades/month. 4H chart: 15-30 trades/month.
**Q: What's a good win rate?**
A: 55-65% is excellent. 50-55% is good. Below 50% needs adjustment.
**Q: Should I trade all regimes?**
A: Beginners: Only trending. Intermediate: Trending + ranging. Advanced: All except chaos.
**Q: Can I use this on any timeframe?**
A: Best on Daily and 4H. Works on 1H with more noise. Not recommended <1H.
**Q: What if I'm in a trade and regime changes?**
A: Exit immediately (if using indicator) or let strategy handle it automatically.
**Q: How do I know if I'm over-optimizing?**
A: If results are perfect on one period but fail on another. Use walk-forward testing.
**Q: Should I always take 5/5 confluence trades?**
A: Yes, but they're rare (1-2/month). Don't wait only for these.
**Q: Can I combine this with other indicators?**
A: Yes, but keep it simple. RSI, MACD already included. Maybe add volume profile.
**Q: What assets work best?**
A: Liquid stocks, major crypto, futures. Avoid forex spot (use futures), penny stocks.
**Q: How long to hold positions?**
A: Trending: Days to weeks. Ranging: Hours to days. Breakout: Days. Let the regime guide you.
---
## FINAL THOUGHTS
This system gives you:
- ✅ Clear market context (regime)
- ✅ High-probability entries (confluence)
- ✅ Defined exits (automatic signals)
- ✅ Adaptable tactics (regime-specific)
- ✅ Backtestable results (strategy version)
**Success requires:**
- 📚 Understanding each regime
- 🎯 Following the signals
- 💪 Discipline to wait
- 🧠 Emotional control
- 📊 Proper risk management
**Start your journey:**
1. Load the indicator
2. Watch for 1 week (no trading)
3. Identify regime patterns
4. Paper trade for 1 month
5. Go live with small size
6. Scale up as you gain confidence
**Remember:** The market will always be here. There's no rush. Master one regime at a time, and you'll be profitable in all conditions!
Good luck! 🚀
