Intraday Rising & Reversal ScannerPine Script Description: Intraday Rising & Reversal ScannerThis Pine Script is a TradingView indicator designed to identify stocks with intraday (1-hour timeframe) potential for bullish (rising) or bearish (reversal) movements. It scans for stocks based on user-defined technical criteria, including price change, relative volume, RSI, EMA, ATR, and VWAP. The script plots signals on the chart, displays a summary table, and triggers alerts when conditions are met.FeaturesBullish Signal (Rising Stocks):1H Price Change: > 1% (configurable, e.g., >2% for volatile markets).
Relative Volume: > 2.0 (volume is at least twice the 20-period average).
RSI (14): Between 50 and 70 (strong but not overbought momentum).
Price vs EMA 13: Price above the 13-period EMA (confirms short-term uptrend).
ATR (14): Current ATR above its 20-period average (indicates volatility).
VWAP: Price above VWAP (optional, shown on chart for manual confirmation).
Bearish Signal (Reversal Stocks):1H Price Change: < -1% (configurable, e.g., <-2% for stronger reversals).
Relative Volume: > 2.0 (high volume confirms selling pressure).
RSI (14): > 70 (overbought, increasing reversal likelihood).
Price vs EMA 13: Price below the 13-period EMA (confirms short-term downtrend).
ATR (14): Current ATR above its 20-period average (indicates volatility).
VWAP: Price below VWAP (optional, shown on chart for manual confirmation).
Visualization:Bullish Signal: Green triangle below the bar.
Bearish Signal: Red triangle above the bar.
VWAP: Plotted as a blue line for manual verification.
Table: Displays real-time metrics (Change %, Relative Volume, RSI, Price vs EMA, ATR, VWAP) in the top-right corner, color-coded (green for bullish, red for bearish).
Alerts:Separate alerts for bullish ("Intraday Bullish Signal") and bearish ("Intraday Bearish Signal") conditions.
Customizable alert messages include parameter values for easy tracking.
How It WorksThe script runs on the 1-hour (1H) timeframe, ensuring all calculations are based on hourly data.
Indicators are computed:Change %: Percentage price change over the last hour.
Relative Volume: Current volume divided by the 20-period SMA of volume.
RSI: 14-period Relative Strength Index.
EMA 13: 13-period Exponential Moving Average.
ATR: 14-period Average True Range, compared to its 20-period SMA.
VWAP: Volume Weighted Average Price, plotted for visual confirmation.
Signals are generated when all conditions for either bullish or bearish criteria are met.
A table summarizes key metrics, and alerts can be set up for real-time notifications.
Usage InstructionsApply the Script:Open TradingView’s Pine Editor.
Copy and paste the script.
Click "Add to Chart" and set the chart to the 1-hour (1H) timeframe.
Set Up Alerts:Right-click on the chart > "Add Alert".
Select "Intraday Bullish Signal" or "Intraday Bearish Signal" as the condition.
Configure notifications (e.g., SMS, email, or TradingView alerts).
Manual VWAP Check:VWAP is plotted as a blue line. Verify that the price is above VWAP for bullish signals or below for bearish signals using the table or chart.
To make VWAP a mandatory filter, uncomment the VWAP conditions in the bull_signal and bear_signal definitions.
ค้นหาในสคริปต์สำหรับ "vwap"

USD Session 8FX - LDN & NY (TF-invariant, Live + Table)What it is
A USD strength/weakness meter for the London (08:00–08:45) or New York (15:30–16:00/16:15) session. It blends the movement of 8 markets—EURUSD, GBPUSD, AUDUSD, NZDUSD, USDCHF, USDCAD, USDJPY, XAUUSD—into one Score that is timeframe-invariant (it uses a 1-minute “boundary TF” under the hood so changing chart TF doesn’t change the math).
Core logic (simple)
During the chosen session window, it records each symbol’s start and live end prices, computes returns, optionally normalizes by ATR (volatility), applies your weights, and averages anti-USD (EUR/GBP/AUD/NZD/XAU) vs USD-base (CHF/CAD/JPY) groups.
The final Score is the normalized sum of weighted contributions:
Score > 0 → “USD Strong”
Score < 0 → “USD Weak”
At the session close it freezes (“Locked”) the results so you can review them later.
What you see
Main plot: the USD Score line (with a 0 baseline).
Optional lines: Anti-USD average vs USD-base average (post-normalization, pre-weights).
Session background shading (London silver, New York aqua).
Live table with:
Each symbol’s % change, its weight, and its contribution to the Score.
TOP badges for the two biggest drivers (by absolute contribution).
A Side column (only for the two TOPs) showing BUY/SELL aligned with the USD verdict (e.g., if USD Strong → SELL anti-USD pairs like EURUSD, BUY USD-base like USDCHF).
Verdict row with USD Strong/Weak, the Score value, the window text, and whether you’re LIVE / CLOSED / FROZEN.
Trade Gate panel:
Shows Verdict (USD Strong/Weak), Bias OK/weak (|Score| vs your threshold), Top-1/Top-2 VWAP checks, an overall GATE: OK/NO, and an Entry hint string (e.g., “SELL EURUSD, BUY USDCHF”) when conditions align.
VWAP “Trade Gate”
It confirms alignment between the USD bias and price vs VWAP for the top movers:
If USD Strong: anti-USD symbols should be below VWAP (short bias), USD-base symbols above VWAP (long bias).
If USD Weak: the opposite.
Gate = OK only if |Score| ≥ minAbsScore and at least one of the two TOP symbols is on the correct side of VWAP.
Tip: set vwapTF to an intraday value (“1”, “5”, “15”) for reliable VWAP on higher-TF charts.
Alerts
At session close: “USD Strong/Weak – session close”.
Live threshold: alerts when |Score| crosses your intraday threshold up/down.
Entry hint (Gate OK): triggers when the Gate flips from NO → OK inside the window.
If you create an alert of type “Any alert() function call”, you also get a dynamic message like:
ENTRY HINT • Hint: SELL EURUSD, BUY USDCHF
Key inputs you can tweak
Session: London vs New York; NY end time 16:00 or 16:15.
Timezone: default Europe/Tirane.
Boundary TF: default “1” (keeps the indicator TF-invariant).
minAbsScore: sensitivity threshold for “Bias OK”.
ATR normalization (len): stabilizes comparisons across different volatility regimes.
VWAP settings: toggle panel and set vwapTF.
How to use (playbook)
Choose the session (e.g., New York 15:30–16:15), keep Boundary TF = 1.
If you’re on a higher-TF chart, set vwapTF = "1" or "5".
Watch Score and Verdict; when |Score| ≥ minAbsScore, bias is meaningful.
Check Top-1/Top-2 and the Trade Gate:
If Gate = OK, use the Entry hint (e.g., “SELL EURUSD, BUY USDCHF”) as the aligned idea.
Use your own execution rules (e.g., structure, risk, stops) on the suggested symbols.
After close, review the Frozen table to validate behavior and refine thresholds/weights.
Notes & edge cases
If some markets are illiquid/holiday, a few returns may be na; the script handles that gracefully.
If ta.vwap is na on high TFs, the Gate will simply not confirm—set vwapTF intraday.
You can customize weights (e.g., reduce XAUUSD to -0.3 or similar) to suit your basket philosophy.
If you want, I can add toggles to show Side for all 8 symbols, or print a one-line summary (e.g., “USD Strong • Score 0.23 • Gate OK • SELL EURUSD, BUY USDCHF”) in the top-left of the pane.

imbalances bandsThis indicator is designed to identify imbalances based on the calculation of the average of the highest and lowest prices. It forms a kind of band indicating correction points.
This indicator uses a total of 4 modified VWAPs, separated into 2 options that the user can activate or deactivate by checking or unchecking the options "Show imbalances bands VWAP 1" or "Show imbalances bands VWAP 2".
Let's talk about the first option, "Show imbalances bands VWAP 1". This displays 2 modified VWAPs on the screen, one in green and one in red, forming a kind of band that indicates possible points of imbalance in the market, signaling increased volatility between buying and selling. When the price tests the bands, it can be useful as there is a probability of a correction in the movement.
This can be particularly useful for those who trade using a scalping style, as it helps analyze when the price tests the bands. It can also be beneficial for trend traders because when the price tests one of the bands, there is a probability of a movement correction.
Now let's talk about the option "Show imbalances bands VWAP 2". It contains two modified VWAPs, one in purple and one in blue, which also form a kind of band. These bands also indicate the probability of a movement correction.
What is the difference between the Show imbalances bands VWAP 1 option and the Show imbalances bands VWAP 2 option?
The option "Show imbalances bands VWAP 2" consists of 2 modified volume-weighted moving averages that have a calculation checking the increase in volatility between the highest and lowest prices. One modified moving average is in purple, and the other modified moving average is in blue, forming a kind of two modified VWAPs.
The option "Show Imbalance Bands VWAP 1" consists of two modified moving averages using the absolute difference between the closing price and the moving average instead of the volume. This is particularly useful for assets where the volume is not a good indicator or is not available.
The option "Show Imbalance Bands VWAP 1" also has a calculation that checks for increased volatility between the highest and lowest prices. It features two modified moving averages, one in green and one in red.
This indicator can be adjusted according to the preferences and characteristics of the specific asset or market. It provides clear visual information and can be used as a complementary tool for technical analysis in trading strategies.
and Interesting period 5,20,50,80,200
Interesting imbalance setting 2.4, 3.3 ,4.2
Analysis Ideas: If you are following a trend, you can use this indicator to analyze how the price behaves around the bands. Since the imbalance bands indicate a probability of correction, it can be useful for identifying protection points or moments to be cautious, as there might be a probability of increased volatility.
Analysis Ideas2:For those trading using a scalping style, observe how the price behaves when it tests the imbalance band, as there may be a probability of increased volatility.
Please note that this indicator is designed for educational and informational purposes. Always conduct your own analysis and consider risk management strategies before making trading decisions.

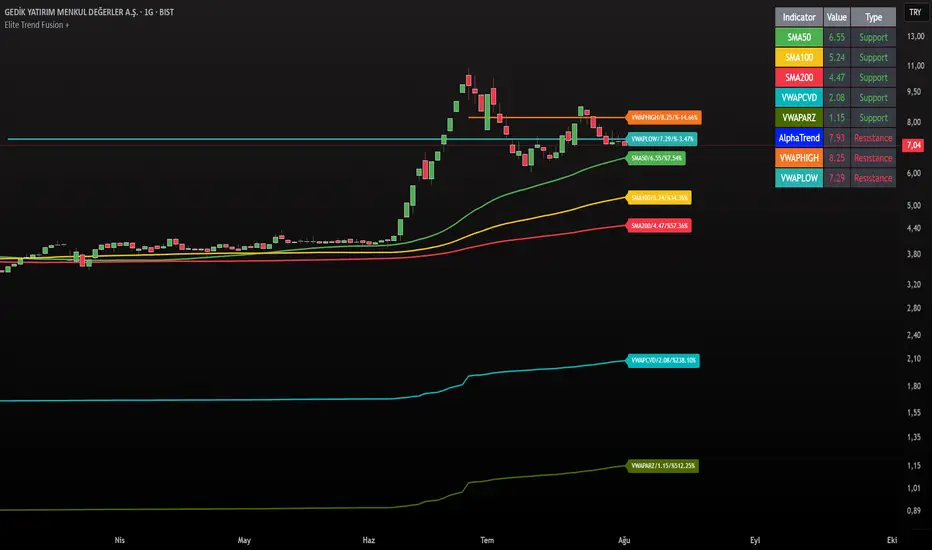
Elite Trend FusionThis indicator combines multiple technical analysis tools to assist traders in identifying trends, support/resistance levels, and potential trading opportunities. Developed by @IQ-TRADER with contributions to the Alpha Section by @KivancOzbilgic, this script overlays the following components on your chart:
EMA1: A customizable Exponential Moving Average for short-term trend analysis.
SMA Cluster (50, 100, 200): Simple Moving Averages on daily timeframes to identify long-term trends and key support/resistance zones.
Anchored VWAP x2 (VWAPCVD & VWAPARZ): Two Volume Weighted Average Price lines anchored to user-defined dates, providing insights into price levels relative to volume from specific points in time.
AlphaTrend: A custom trend-following indicator based on ATR and MFI, helping to gauge market direction and volatility.
Usage InstructionsInstallation:
Copy and paste the script into the Pine Script editor on TradingView, then add it to your chart.
Customization:Adjust the periods for EMA, SMA50, SMA100, and SMA200 under the "Inputs" tab.
Set the anchor dates for VWAPCVD and VWAPARZ to analyze specific historical periods.
Enable or disable individual components (EMA1, SMA50, SMA100, SMA200, VWAPCVD, VWAPARZ, AlphaTrend) and toggle labels via the settings.
Customize colors and line thickness to suit your preferences.
Modify the AlphaTrend multiplier and period for tailored sensitivity.
Interpretation:
Use the EMA1 for short-term momentum and crossovers with SMAs.
Monitor SMA crossovers (e.g., SMA50 crossing SMA200) for trend changes.
The Anchored VWAPs act as dynamic support/resistance levels based on the selected anchor dates.
AlphaTrend provides a visual guide for trend direction; use it alongside other indicators for confirmation.
Labels on the last bar show the current value and percentage distance from the price for each enabled indicator.
Pine Screener Module Usage:
Add this indicator to the Pine Screener to filter stocks, forex pairs, or other instruments based on the calculated distances (in percentage) between the close price and SMA50, SMA100, SMA200, VWAPCVD, and VWAPARZ.
In the Screener, use the "SMA50 Distance (%)", "SMA100 Distance (%)", "SMA200 Distance (%)", "VWAPCVD Distance (%)", and "VWAPARZ Distance (%)" columns to identify overbought/oversold conditions or potential reversal points.
Example filters: Set conditions like "SMA50 Distance (%) > 5" to find stocks trading significantly above the 50-day SMA, or "VWAPCVD Distance (%) < -2" to spot assets below the anchored VWAP, indicating potential support levels.
Combine multiple conditions (e.g., SMA50 Distance (%) > 5 AND AlphaTrend > previous AlphaTrend) to refine your scan for bullish trends.
Note: Ensure the indicator is applied to the chart or screener with the desired timeframe for accurate results.
Notes
This is an overlay indicator, meaning it plots directly on the price chart.
The script uses daily SMA calculations for consistency across timeframes.
Labels appear only on the last bar and are customizable.
This tool is for educational and informational purposes only. Trading involves risks, and it is recommended to consult a financial advisor before making decisions.
The script is credited to @IQ-TRADER with acknowledgment to @KivancOzbilgic for the Alpha Section contribution, adhering to intellectual property guidelines.
No Financial Advice: The description explicitly states that the indicator is for educational use and not financial advice, complying with TradingView's policy against promoting trading signals as guarantees.
Clear Usage: Step-by-step instructions are provided to ensure users can apply the indicator effectively, including screener usage.
No External Links or Promotions: No external links or promotional content is included, aligning with platform rules.
Momentum Day Trading ToolkitMomentum Day Trading Toolkit
Complete User Guide
Table of Contents
Overview
Quick Start
The Dashboard
Module 1: 5 Pillars Screener
Module 2: Gap & Go
Module 3: Bull Flag / Flat Top
Module 4: Float Rotation
Module 5: R2G / G2R
Module 6: Micro Pullback
Signal Reference
Quality Score
Settings Guide
Alerts Setup
Trading Workflows
Troubleshooting
Overview
The Momentum Day Trading Toolkit combines 6 powerful indicators into one unified system for day trading momentum stocks.
ModulePurpose① 5 PillarsConfirms stock is "in play"② Gap & GoPre-market levels & gap analysis③ Bull Flag / Flat TopClassic breakout patterns④ Float RotationMeasures true interest level⑤ R2G / G2RTracks prior close crosses⑥ Micro PullbackPrecision continuation entries
All modules work together - the dashboard shows you everything at a glance, and you can enable/disable any module you don't need.
Quick Start
Step 1: Add to Chart
Add the indicator to any stock chart
Recommended timeframes: 1-minute, 5-minute, or 15-minute
Step 2: Check the Dashboard (Top Right)
Look for:
Status = Current state (Scanning, Entry Signal, etc.)
Quality Score = Setup rating out of 10
Green checkmarks (✓) = Criteria passing
Step 3: Watch for Entry Signals
Triangles, circles, diamonds below bars = Entry signals
Arrows = R2G/G2R crosses
Step 4: Set Alerts
Right-click chart → Add Alert
Select "Momentum Day Trading Toolkit"
Choose your alert condition
The Dashboard
The dashboard in the top-right corner gives you instant analysis:
┌─────────────────────────────┐
│ MOMENTUM TOOLKIT │
├─────────────────────────────┤
│ Status │ 🎯 ENTRY SIGNAL │
│ Day │ 🟢 GREEN │
│ Gap │ +8.5% 🔥 │
│ RVol │ 3.2x ✓ │
│ Rotation │ 1.45x 🔥 │
│ Float │ 5.2M 🔥 │
│ Change │ +12.3% ✓ │
│ Pattern │ BULL FLAG! │
│ EMA 9/20 │ Above Both ✓ │
│ VWAP │ Above ✓ │
│ Prior Cl │ 5.91 │
│ PM High │ 9.11 ✓ │
│ Price │ 9.46 ✓ │
└─────────────────────────────┘
Dashboard Row Reference
RowWhat It ShowsGood ValuesStatusCurrent state🎯 ENTRY SIGNALDayGreen/Red vs prior close🟢 GREENGapGap % from prior close🔥 (5%+) or 🔥🔥 (10%+)RVolRelative volume✓ (2x+) or ✓✓ (5x+)RotationFloat rotation🔥 (1x) or 🔥🔥 (2x+)FloatFloat in millions🔥 (<5M) or Low (<10M)ChangeDaily % change✓ (meets minimum)PatternPattern statusBREAKOUT!EMA 9/20Trend positionAbove Both ✓VWAPVWAP positionAbove ✓Prior CloseKey R2G levelReference pricePM HighPre-market high✓ = Above itPriceCurrent price✓ = In range
Status Messages
StatusMeaningActionScanning...Looking for setupsWait✅ ALL PILLARSStock qualifiesWatch for pattern⏳ PATTERN FORMINGSetup developingGet ready🎯 ENTRY SIGNALSignal triggeredExecute trade
Module 1: 5 Pillars Screener
What It Does
Confirms the stock meets basic criteria to be worth trading.
The 5 Pillars
PillarDefaultWhy It MattersRelative Volume2x+ (5x for "strong")Confirms unusual interestDaily Change5%+Stock is movingPrice Range$1-$20Sweet spot for momentumFloat Size<20M sharesLower float = bigger moves
Visual Indicator
Green background appears when ALL pillars pass
Dashboard Shows
Individual pillar status with ✓ checkmarks
Quality score includes pillar factors
Settings
SettingDefaultDescriptionMin RVol2.0xMinimum relative volumeStrong RVol5.0xVolume for full qualificationMin Change5%Minimum daily moveMin Price$1Minimum stock priceMax Price$20Maximum stock priceMax Float20MMaximum float size
Module 2: Gap & Go
What It Does
Analyzes pre-market gaps and displays key price levels.
Key Levels Displayed
LevelColorDescriptionPrior CloseOrangeYesterday's close - THE key levelPM HighGreenPre-market high - breakout levelPM LowRedPre-market low - support
Gap Classification
Gap SizeRatingMeaning5-9.9%🔥 QualifyingWorth watching10%+🔥🔥 StrongHigh priority
Entry Signal
Small green triangle = PM High Breakout
How to Trade
Stock gaps up in pre-market
Wait for market open
Look for break above PM High
Enter on breakout with stop below PM Low
Settings
SettingDefaultDescriptionMin Gap %5%Qualifying gap thresholdStrong Gap %10%Strong gap thresholdShow PM LevelsONDisplay PM high/low lines
Module 3: Bull Flag / Flat Top
What It Does
Detects classic continuation patterns and signals breakouts.
Bull Flag Pattern
▲ BREAKOUT (Entry Signal)
│
┌────┴────┐
│ Pullback │ ← 2-5 red candles
│ (flag) │ Max 50% retrace
└─────────┘
│
┌────┴────┐
│ Pole │ ← 3+ green candles
│ (move) │ Strong momentum
└─────────┘
Flat Top Pattern
═══════════════ Resistance (2+ touches)
│
▲ BREAKOUT above resistance
Entry Signals
SignalShapeColorPatternBull Flag Breakout▲ TriangleLimeFlag breaks upFlat Top Breakout◆ DiamondAquaResistance breaks
How to Trade Bull Flag
See 3+ green candles (the pole)
Price pulls back 2-5 red candles
Pullback stays above 50% of move
Enter on break above pullback high
Stop below pullback low
Settings
SettingDefaultDescriptionMin Pole Candles3Green candles neededMax Pullback5Max red candles allowedMax Retrace50%Max pullback depthFT Touches2Resistance touches neededFT Lookback10Bars to check for resistance
Module 4: Float Rotation
What It Does
Tracks how many times the entire float has traded hands today.
The Formula
Rotation = Cumulative Day Volume ÷ Float
Rotation Levels
RotationEmojiMeaning0.5x—Half float traded1.0x🔥FULL rotation - significant!2.0x🔥🔥Double rotation - extreme3.0x+🔥🔥🔥Triple rotation - rare event
Why It Matters
High rotation = Extreme interest
Everyone who owns shares has likely traded
Often precedes explosive moves
Shows "real" demand beyond just volume
Dashboard Shows
Current rotation level
Fire emojis for milestones
Settings
SettingDefaultDescriptionFloat SourceAutoAuto-detect or manualManual Float10MIf auto fails, use thisAlert Level1.0xAlert when rotation hits this
Module 5: R2G / G2R
What It Does
Tracks when price crosses the prior day's close - a key psychological level.
Red to Green (R2G) 🟢
Prior Close ─────────────────
↗ CROSS TO GREEN
↗
(opened red)
Stock opened below prior close (red)
Crosses above prior close (green)
BULLISH signal
Green to Red (G2R) 🔴
(opened green)
↘
↘ CROSS TO RED
Prior Close ─────────────────
Stock opened above prior close (green)
Crosses below prior close (red)
BEARISH signal
Entry Signals
SignalShapeColorMeaningR2G↑ ArrowLimeCrossed to greenG2R↓ ArrowRedCrossed to red
Why R2G Matters
Bears who shorted get squeezed
Creates FOMO buying
Prior close becomes support
Momentum often continues
Dashboard Shows
Current day status (🟢 GREEN / 🔴 RED)
Whether R2G or G2R occurred (R2G ✓ or G2R ✓)
Settings
SettingDefaultDescriptionRequire Opposite OpenONR2G needs red openShow Prior CloseONDisplay the line
Module 6: Micro Pullback
What It Does
Finds precision entries on brief 1-3 candle pullbacks after strong moves.
The Pattern
▲ ENTRY (break pullback high)
│
┌──┴───┐
│ 1-3 │ ← Micro pullback (brief!)
│ red │ Stop = low of this
└──────┘
│
┌──┴───┐
│ 3+ │ ← Strong move
│green │ Momentum building
└──────┘
Why Micro Pullbacks Work
Tight stop = Pullback low is close
Momentum intact = Only paused briefly
Early entry = Catch continuation early
Clear trigger = Break of pullback high
Entry Signal
SignalShapeColorMicro Pullback Entry● CircleYellow
How to Trade
See 3+ green candles (strong move)
1-3 red candles (brief pause)
Pullback stays above 50% retrace
Enter when green candle breaks pullback high
Stop at pullback low
Settings
SettingDefaultDescriptionMin Green Candles3Candles before pullbackMax Pullback3Max red candlesMax Retrace50%Max pullback depth
Signal Reference
All Entry Signals (Below Bar)
ShapeColorSignalModule▲ Large TriangleLimeBull Flag BreakoutPatterns◆ DiamondAquaFlat Top BreakoutPatterns● CircleYellowMicro Pullback EntryMicro PB▲ Small TriangleGreenPM High BreakoutGap & Go↑ ArrowLimeRed to GreenR2G/G2R
Warning Signals (Above Bar)
ShapeColorSignalModule↓ ArrowRedGreen to RedR2G/G2R
Optional Forming Signals (Disabled by Default)
ShapeColorSignal🚩 FlagFaded LimeBull Flag Forming● CircleFaded YellowMicro PB Forming
Enable "Show 'Forming' Markers" in settings to see these
Quality Score
The quality score (0-10) rates the overall setup strength.
Scoring Breakdown
FactorPointsRVol 5x++2RVol 2x++1Daily change 5%++1Low float (<20M)+1Strong gap (10%+)+2Qualifying gap (5%+)+1Rotation 1x++2Rotation 0.5x++1Above EMA 20+1
Score Interpretation
ScoreGradeAction8-10A+Best setups - full position6-7AGood setups - standard size4-5BAverage - reduced size0-3CWeak - skip or paper trade
Settings Guide
Module Toggles
Turn each module ON/OFF:
SettingDefaultDescription① 5 Pillars ScreenerONStock qualification② Gap & Go AnalysisONGap & level analysis③ Bull Flag / Flat TopONPattern detection④ Float RotationONRotation tracking⑤ R2G / G2R TrackerONPrior close crosses⑥ Micro PullbackONPullback entries
Visual Settings
SettingDefaultDescriptionShow DashboardONDisplay info tableTable SizeNormalSmall/Normal/LargeShow Entry SignalsONDisplay entry shapesShow 'Forming' MarkersOFFShow pattern formingShow Key LevelsONPrior close, PM levelsShow EMA 9/20ONTrend EMAsShow VWAPONVWAP line
Recommended Presets
Minimal (Clean Chart)
Show Dashboard: ON
Show Entry Signals: ON
Show 'Forming' Markers: OFF
Show Key Levels: OFF
Show EMA: OFF
Show VWAP: OFF
Standard (Balanced)
All defaults
Full Analysis
All settings ON
Alerts Setup
Available Alerts
AlertTriggerAny Bullish EntryAny entry signal firesBull Flag BreakoutBull flag breaks outFlat Top BreakoutFlat top breaks outMicro Pullback EntryMicro PB triggersPM High BreakoutBreaks above PM highRed to GreenR2G crossGreen to RedG2R crossFloat RotationHits rotation level5 Pillars PassAll pillars qualifyPattern FormingPattern starts formingHigh Quality EntryEntry with score 7+/10
How to Set Alerts
Right-click on chart
Select "Add Alert"
Condition: "Momentum Day Trading Toolkit"
Select alert type from dropdown
Set expiration and notifications
Click "Create"
Recommended Alerts
For Active Trading:
Any Bullish Entry
High Quality Entry
For Watchlist Monitoring:
5 Pillars Pass
Float Rotation
Trading Workflows
Workflow 1: Full Qualification
Step 1: 5 PILLARS
└─→ Wait for "✅ ALL PILLARS" status
Step 2: CHECK SETUP
└─→ Quality score 6+?
└─→ Above EMA and VWAP?
Step 3: WAIT FOR ENTRY
└─→ Bull Flag, Flat Top, or Micro PB signal
Step 4: EXECUTE
└─→ Enter on signal
└─→ Stop below pattern low
└─→ Target 2:1 minimum
Workflow 2: Gap & Go
Step 1: PRE-MARKET
└─→ Stock gaps 5%+ (shows in Gap row)
Step 2: MARKET OPEN
└─→ Note PM High level (green line)
Step 3: WAIT FOR BREAK
└─→ PM High Breakout signal (small triangle)
Step 4: CONFIRM
└─→ R2G if opened red (double confirmation)
└─→ RVol 2x+
Step 5: EXECUTE
└─→ Enter on PM High break
└─→ Stop below PM Low
Workflow 3: Micro Pullback Scalp
Step 1: FIND MOMENTUM
└─→ Stock moving, 3+ green candles
Step 2: WAIT FOR PAUSE
└─→ 1-3 red candles (brief pullback)
Step 3: ENTRY
└─→ Yellow circle signal appears
Step 4: QUICK TRADE
└─→ Enter at signal
└─→ Tight stop at pullback low
└─→ Quick target (1:1 to 2:1)
Troubleshooting
Q: Lines are moving/jumping on real-time chart?
A: This was fixed in latest version. Make sure you have the newest code. Lines now lock in place at market open.
Q: Too many signals, chart is cluttered?
A:
Turn off "Show 'Forming' Markers"
Disable modules you don't need
Use "Minimal" visual preset
Q: No signals appearing?
A:
Check if "Show Entry Signals" is ON
Make sure relevant module is enabled
Stock may not meet pattern criteria
Q: Dashboard shows wrong float?
A:
TradingView float data isn't available for all stocks
Switch Float Source to "Manual"
Enter correct float in millions
Q: PM High/Low not showing?
A:
Only appears during market hours
Needs pre-market data to calculate
Check if "Show Key Levels" is ON
Q: Quality score seems wrong?
A:
Score updates in real-time
Check individual factors in dashboard
RVol and rotation change throughout day
Q: Alert not triggering?
A:
Make sure alert is set on correct symbol
Check alert hasn't expired
Verify condition is set correctly
Quick Reference Card
Entry Signals
▲ Lime Triangle = Bull Flag Breakout
◆ Aqua Diamond = Flat Top Breakout
● Yellow Circle = Micro Pullback
▲ Green Triangle = PM High Break
↑ Lime Arrow = R2G (bullish)
↓ Red Arrow = G2R (bearish)
Dashboard Quick Read
🎯 = Entry signal active
✅ = All pillars pass
🟢 = Day is green
🔥 = Strong (gap/rotation)
✓ = Criteria met
✗ = Criteria failed
Quality Score
8-10 = A+ (Best)
6-7 = A (Good)
4-5 = B (Average)
0-3 = C (Weak)
Key Levels
Orange Line = Prior Close (R2G level)
Green Line = PM High (breakout level)
Red Line = PM Low (support)
Purple Line = VWAP
Yellow/Orange = EMA 9/20
Happy Trading! 🎯📈
For questions or issues, use TradingView's comment section on the indicator page.

(JS) Checklist SignalsWhat if I told you that you could use over 10 indicators at once without having a single one of them on you chart? Enter the Checklist Signals. This is probably the most complex yet simple indicator I've ever done.
What you get is 6 rows (if you want them all) of labels that hover at the top of your screen with a ton of extremely useful information. I will go down the list of options in the indicator settings and explain how it all works.
So the label placement is based on ATR. You choose your X Axis and Y Axis starting point then adjust the lookback period. Default lookback is 600 bars. What that means is, the indicator finds the highest high in the last 600 bars, then begins to place the labels above that zone based on the ATR of the chart. Different timeframes require very different combinations so it's all customizable. Sometimes if labels overlap you need to adjust the X Axis starting point, or the spread on either axis.
The next set of options allows you to decide what you'd prefer to be set on or off. Let's start with ATR and VWAP. I have added bands for both of these. When price is below the mean (which is the 21 ema by default), then the labels show you the next 5 standard deviations of ATR going down. When under one of these levels the label turns red. The opposite is true when above the mean and in those instances the labels will be green. It is the same with the VWAP, though instead of using the mean we use the daily VWAP as the starting point. If you choose to have levels switched on then you can see the actual values of each standard deviation level. Down lower in the options you can change the resolution and source used for VWAP.
The next option is "Trending". This creates a moving average using the length of the Trending Lookback Period (default is 5) and then tells you using arrows in the label which direction the trend of the indicator is going.
The next area let's you specify the information you receive in the Squeeze labels. By default all options are one - and this tells you if there's a Squeeze, what type of Squeeze there is, and how many bars the Squeeze has been building up or since it fired. These labels are color coded to correspond with the Squeeze type as well.
Then we get to another one of my indicators, the Ballista. One of the main signals is the "Inverted Squeeze" where the short term momentum inverts against the long term momentum. Here I have the distance between the two oscillators in the first label, and then the second label tells you if there's an Inverted Squeeze signal, if there's potential entry, confirmed entry, or how many bars its been since the last entry signal.
The next feature is off by default, but it will add arrows to your chart based on a simple lower highs and higher lows signals. Turning arrows on will place them right on your chart above or below each bar.
The rest of it is customizable settings of all the other indicators that are shown. Now looking at the labels themselves, starting in the top left corner:
First Row-
ADX + DMI: These labels show the ADX, DI+, & DI- values in each label. Whenever the DI+ or DI- is above the other then their respective label will light up. Also, when the ADX is above 20 (confirming the trend) it lights up in the same color as well.
Squeeze: I described how this worked above, the labels tell you if there's a Squeeze, how long there's been one, and how long since it fired, all while also changing to color of the associated Squeeze type.
Second Row -
Stacked EMAs: The top label looks at the EMA values using the numbers of the Fibonacci sequence. It looks at the EMA 8, 21, 34, 55, 89, & 233 and tells you if they're all stacked in the same direction (Stacked Bear meaning they're all crossed down in order, Stacked Bull meaning they're all crossed up in order). If the EMAs are all stacked but 1 or 2 it will say Stacked -1 or Stacked -2. When they're all over the place it will say they aren't stacked at all.
BB%: This tells you the value of the Bollinger Band %. If this is negative then you know that price is currently below the lower Bollinger Band, and if it is above 100% it is above the upper Bollinger Band.
RSI: This tells you the value of the RSI and the label changes colors based on the value.
Stoch: This tells you the Stochastic value and changes colors based on the value, same as the RSI.
Third Row -
The Mean: This tells you the numerical value of whatever you have the mean set as (21 ema by default). The label changes colors based on price being above or below the mean.
One ATR: This was something I added for those looking to plan their trades out. This tells you the value of one ATR so you can have a better idea of how to plan your trades based on this distance.
VIX: This tells you the current value of the VIX, and color changes based on being green or red on the day.
Ballista: I explained this above, it tells you the distance between the two oscillators and changes colors based on the trend being above or below 0. When there's an Inverted Squeeze this label is gray.
Inverted Squeeze: This label tells you if there's an inverted squeeze as well as if it is showing an entry or how many bars since the last entry signal. This label turns fuchsia on a bear signal and lime on a bull signal.
Fourth Row -
ATR Bands: As I explained above, this plots each standard deviation using ATR and changes colors based on price's relationship to each one.
Fifth Row -
VWAP: The three labels here show the daily, weekly, and monthly VWAP values, and color changes based on price's relationship to each one.
Sixth Row -
VWAP Bands: These are the standard deviation levels of the VWAP resolution of your choosing (as explained above), and just as the others, colors change based on price's relationship to each one.
I thought this was a really cool indicator that could be used for people like me who like knowing the right information, but HATE having their charts clustered with a ton of stuff. Hope you all like it, enjoy!

Trend Engine [MMT]The Trend Engine is a versatile Pine Script indicator designed to identify trend direction, potential reversals, and key price levels using a combination of Exponential Moving Averages (EMAs), and Anchored Volume-Weighted Average Price (VWAP). This indicator provides traders with a clear visual representation of market bias, momentum, and key support/resistance levels, making it suitable for both trend-following and pullback trading strategies.
Key Features:
1. EMA Cloud System:
- Displays three customizable EMAs (Fast, Pullback, and Slow) with configurable lengths and visibility.
- Creates two cloud fills:
- Fast Cloud : Between the Fast EMA (default: 8) and Pullback EMA (default: 13).
- Slow Cloud : Between the Pullback EMA and Slow EMA (default: 21).
- Clouds are color-coded (green for bullish, red for bearish) based on EMA alignment, with adjustable transparency for clarity.
2. Bias EMA:
- A longer-term EMA (default: 35) indicates the overall market bias.
- Changes color based on whether the regular candle close is above (green) or below (red) the Bias EMA, providing a clear trend direction signal.
3. Heikin Ashi Signals:
- Utilizes Heikin Ashi candles to detect strong bullish or bearish momentum.
- Generates buy/sell signals when a Heikin Ashi candle confirms a trend (bullish HA candle closing above Bias EMA for buy, bearish HA candle closing below for sell).
- Signal arrows are currently disabled but can be enabled via settings for visual confirmation.
4. Anchored VWAP and Standard VWAP:
- Plots both a standard VWAP and an Anchored VWAP (anchored to the US RTH session, 09:30–16:00 EST).
- Customizable line styles (solid, cross, or circles) and colors for both VWAPs, aiding in identifying dynamic support/resistance levels.
5. Background and Candle Coloring:
- Optional background coloring reflects the market bias (green for bullish, red for bearish) based on the regular close relative to the Bias EMA.
- Optional Heikin Ashi candle coloring to visually distinguish bullish and bearish market conditions.
6. Regular Candle Close:
- Option to plot the regular (non-Heikin Ashi) close price with customizable styles (line, circles, or cross) for reference.
7. Alerts:
- Built-in alert conditions for bullish and bearish signals, allowing traders to receive notifications when a Heikin Ashi candle confirms a trend relative to the Bias EMA.
How to Use:
- Trend Identification : Use the Bias EMA and background color to determine the overall market direction.
- Pullback Trading : Monitor the EMA clouds for alignment (bullish or bearish) and use the Pullback EMA for entries during retracements.
- Support/Resistance : Leverage the VWAP and Anchored VWAP as dynamic levels for trade entries or exits.
- Signal Confirmation : Enable signal arrows (when fixed) to spot high-probability trend continuation or reversal setups.
- Customization : Adjust EMA lengths, colors, transparency, and visibility to suit your trading style and timeframe.
Settings:
- EMA Cloud : Customize lengths (default: 8, 13, 21), visibility, and cloud colors/transparency.
- Bias EMA : Adjust length (default: 35) and colors for above/below states.
- VWAP : Toggle standard and Anchored VWAP, with customizable styles and colors.
- Background/Candles : Enable/disable background and candle coloring for visual clarity.
- Regular Close : Show/hide the regular close price with style options.
Notes:
- Designed for use on any timeframe, but most effective on intraday (e.g., 5m, 15m) or daily charts.
- Best used in conjunction with other technical analysis tools for confirmation.
- Anchored VWAP is tailored for US markets (RTH session) but can be adjusted for other sessions by modifying the anchor time in the code.
Ideal For:
- Day traders and swing traders looking for trend direction and pullback opportunities.
- Traders using VWAP-based strategies for intraday support/resistance.
- Those seeking a clean, customizable visual aid for market bias and momentum.
This indicator is a powerful tool for traders aiming to capture trends and manage risk effectively, with extensive customization to adapt to various markets and trading styles.

Volume Climax Reversal (VCR) — Catch Exhaustion Tops & BottomsNew! VCR spots exhaustion spikes at highs/lows using volume extremes + price action + VWAP context.
If you trade parabolic runners, indices, or mean-reversion edges, VCR helps you time the backside (shorts) and fade capitulation (longs) with clean, rule-based signals.
What it does
Detects volume climax: current volume > SMA(len) × multiplier and a new volume high in the lookback.
Confirms price context: makes a higher high (for tops) or lower low (for bottoms).
Filters with VWAP (optional): bearish signals only below VWAP, bullish signals only above VWAP.
Optional wick filter: requires an exhaustion wick > body to reduce chop.
Why traders like it
Clear entries: “VCR↓” (bearish) at exhaustion tops, “VCR↑” (bullish) at washout lows.
Fewer false signals: VWAP gating + wick filter focus on true climaxes.
Built-in alerts: set once, get notified on your phone/desktop when a setup appears.
How I trade it (simple playbook)
Bearish reversal (short / puts)
Wait for VCR↓ (exhaustion at/near HH).
Look for a lower high that fails to reclaim the signal candle high.
Enter on the break of that lower-high candle low.
Stop above the signal wick high.
Covers/targets: VWAP first; then 20–30% fade from the local top / prior demand.
Bullish reversal (long / calls)
Wait for VCR↑ (capitulation at/near LL).
Look for a higher low that holds above the signal candle low.
Enter on the break of the HL candle high.
Stop below the signal wick low.
Targets: VWAP first; then prior supply/MA bands.
Tip for small-cap/“Dux” style: VCR pairs perfectly with a gap + high USD-rotation scan. Let them blow off, then use VCR for the timing.
Inputs (tune to your market)
Volume SMA Length (default 20)
Volume Spike Multiplier (default 2.0)
Lookback High / Low (default 10 / 10)
Require VWAP confirmation? (on)
Use wick filter? (on)
Works on stocks, indices, futures, crypto.
Timeframes: 1–15m for day trading; 1h–4h–D for swing.
Alerts
Set one (or both) alerts and forget it:
Bearish Volume Climax — VCR↓
Bullish Volume Climax — VCR↑
You’ll get instant notifications when a qualified top/bottom prints.
Best practices
Don’t countertrend the first front-side ramp—wait for the VCR and a lower-high/higher-low.
Respect VWAP: it’s your first profit-taking and a bias filter.
Size small into volatility; widen stops in fast markets.
Combine with your watchlist filters (gap %, float/O/S, USD rotation, session timing).
What’s included
Clean visual signals (triangles + subtle background shading)
Session-anchored VWAP
Alert conditions that appear in TradingView’s alert menu
Sensible defaults + clear docs (this post)
FAQ
Q: Does it repaint?
No. VCR uses completed-bar data; signals print end-of-bar.
Q: Which markets?
Anything with volume: US equities, futures, crypto, indices.
Q: Can I use it for scalps?
Yes—1–5m with wick filter on and VWAP required works well.
Get more / upgrades
I’m iterating fast (MTF filter, heatmap panel, combined “one-alert” mode).
Want the pro template with dashboard & combined alerts? Message me on TV or DM / email you@domain.com
.
Risk Notice
This is educational research, not financial advice. Markets carry risk—always manage position size and use stops.
If this helped you, smash the 👍 and ⭐ — it really helps!
#volume #vwap #reversal #exhaustion #trendreversal #smallcaps #scalping #daytrading #swingtrading #stocks #futures #crypto #indicator

Session Open Range, Breakout & Trap Framework - TrendPredator OBSession Open Range, Breakout & Trap Framework — TrendPredator Open Box
Stacey Burke’s trading approach combines concepts from George Douglas Taylor, Tony Crabel, Steve Mauro, and Robert Schabacker. His framework focuses on reading price behaviour across daily templates and identifying how markets move through recurring cycles of expansion, contraction, and reversal. While effective, much of this analysis requires real-time interpretation of session-based behaviour, which can be demanding for traders working on lower intraday timeframes.
The TrendPredator indicators formalize parts of this methodology by introducing mechanical rules for multi-timeframe bias tracking and session structure analysis. They aim to present the key elements of the system—bias, breakouts, fakeouts, and range behaviour—in a consistent and objective way that reduces discretionary interpretation.
The Open Box indicator focuses specifically on the opening behaviour of major trading sessions. It builds on principles found in classical Open Range Breakout (ORB) techniques described by Tony Crabel, where a defined time window around the session open forms a structural reference range. Price behaviour relative to this range—breaking out, failing back inside, or expanding—can highlight developing session bias, potential trap formation, and directional conviction.
This indicator applies these concepts throughout the major equity sessions. It automatically maps the session’s initial range (“Open Box”) and tracks how price interacts with it as liquidity and volatility increase. It also incorporates related structural references such as:
* the first-hour high and low of the futures session
* the exact session open level
* an anchored VWAP starting at the session open
* automated expansion levels projected from the Open Box
In combination, these components provide a unified view of early session activity, including breakout attempts, fakeouts, VWAP reactions, and liquidity targeting. The Open Box offers a structured lens for observing how price transitions through the major sessions (Asia → London → New York) and how these behaviours relate to higher-timeframe bias defined in the broader TrendPredator framework.
Core Features
Open Box (Session Structure)
The indicator defines an initial session range beginning at the selected session open. This “Open Box” represents a fixed time window—commonly the first 30 minutes, or any user-defined duration—that serves as a structural reference for analysing early session behaviour.
The range highlights whether price remains inside the box, breaks out, or rejects the boundaries, providing a consistent foundation for interpreting early directional tendencies and recognising breakout, continuation, or fakeout characteristics.
How it works:
* At the session open, the indicator calculates the high and low over the specified time window.
* This range is plotted as the initial structure of the session.
* Price behaviour at the boundaries can illustrate emerging bias or potential trap formation.
* An optional secondary range (e.g., 15-minute high/low) can be enabled to capture early volatility with additional precision.
Inputs / Options:
* Session specifications (Tokyo, London, New York)
* Open Box start and end times (e.g., equity open + first 30 minutes, or any custom length)
* Open Box colour and label settings
* Formatting options for Open Box high and low lines
* Optional secondary range per session (e.g., 15-minute high/low)
* Forward extension of Open Box high/low lines
* Number of historic Open Boxes to display
Session VWAPs
The indicator plots VWAPs for each major trading session—Asia, London, and New York—anchored to their respective session opens. These session-specific VWAPs assist in tracking how value develops through the day and how price interacts with session-based volume distributions.
How it works:
* At each session open, a VWAP is anchored to the open price.
* The VWAP updates throughout the session as new volume and price data arrive.
* Deviations above or below the VWAP may indicate balance, imbalance, or directional control.
* Viewed together, session VWAPs help identify transitions in value across sessions.
Inputs / Options:
* Enable or disable VWAP per session
* Adjustable anchor and end times (optionally to end of day)
* Line styling and label settings
* Number of historic VWAPs to draw
First Hour High/Low Extensions
The indicator marks the high and low formed during the first hour of each session. These reference points often function as early control levels and provide context for assessing whether the session is establishing bias, consolidating, or exhibiting reversal behaviour.
How it works:
* After the session starts, the indicator records the highest and lowest prices during the first hour.
* These levels are plotted and extended across the session.
* They provide a visual reference for observing reactions, targets, or rejection zones.
Inputs / Options:
* Enable or disable for each session
* Line style, colour, and label visibility
* Number of historic sessions displayed
EQO Levels (Equity Open)
The indicator plots the opening price of each configured session. These “Equity Open” levels represent short-term reference points that can attract price early in the session.
Once the level is revisited after the Open Box has formed, it is automatically cut to avoid clutter. If not revisited, the line remains as an untested reference, similar to a naked point of control.
How it works:
* At session open, the open price is recorded.
* The level is plotted as a local reference.
* If price interacts with the level after the Open Box completes, the line is cut.
* Untested EQOs extend forward until interacted with.
Inputs / Options:
* Enable/disable per session
* Line style and label settings
* Optional extension into the next day
* Option for cutting vs. hiding on revisit
* Number of historic sessions displayed
OB Range Expansions (Automatic)
Range expansions are calculated from the height of the Open Box. These levels provide structured reference zones for identifying potential continuation or exhaustion areas within a session.
How it works:
* After the Open Box is formed, multiples of the range (e.g., 1×, 2×, 3×) are projected.
* These expansion levels are plotted above and below the range.
* Price reactions near these areas can illustrate continuation, hesitation, or potential reversal.
Inputs / Options:
* Enable or disable per session
* Select number of multiples
* Line style, colour, and label settings
* Extension length into the session
Stacey Burke 12-Candle Window Marker
The indicator can highlight the 12-candle window often referenced in Stacey Burke’s session methodology. This window represents the key active period of each session where breakout attempts, volatility shifts, and reversal signatures often occur.
How it works:
* A configurable window (default 12 candles) is highlighted from each session open.
* This window acts as a guide for observing active session behaviour.
* It remains visible throughout the session for structural context.
Inputs / Options:
* Enable/disable per session
* Configurable window duration (default: 3 hours)
* Colour and transparency controls
Concept and Integration
The Open Box is built around the same multi-timeframe logic that underpins the broader TrendPredator framework.
While higher-timeframe tools track bias and setups across the H8–D–W–M levels, the Open Box focuses on the H1–M30 domain to define session structure and observe how early intraday behaviour aligns with higher-timeframe conditions.
The indicator integrates with the TrendPredator FO (Breakout, Fakeout & Trend Switch Detector), which highlights microstructure signals on lower timeframes (M15/M5). Together they form a layered workflow:
* Higher timeframes: context, bias, and developing setups
* TrendPredator OB: intraday and intra-session structure
* TrendPredator FO: microstructure confirmation (e.g., FOL/FOH, switches)
This alignment provides a structured way to observe how daily directional context interacts with intraday behaviour.
See the public open source indicator TP FO here (click on it for access):
Practical Application
Before Session Open
* Review previous session Open Box, Open level, and VWAPs
* Assess how higher-timeframe bias aligns with potential intraday continuation or reversal
* Note untested EQO levels or VWAPs that may function as liquidity attractors
During Session Open
* Observe behaviour around the first-hour high/low and higher-timeframe reference levels
* Monitor how the M15 and 30-minute ranges close
* Track reactions relative to the session open level and the session VWAP
After the Open Box completes
* Assess price interaction with Open Box boundaries and first-hour levels
* Use microstructure signals (e.g., FOH/FOL, switches) for potential confirmation
* Refer to expansion levels as reference zones for management or target setting
After Session
* Review how price behaved relative to the Open Box, EQO levels, VWAPs, and expansion zones
* Analyse breakout attempts, fakeouts, and whether intraday structure aligned with the broader daily move
Example Workflow and Trade
1. Higher-timeframe analysis signals a Daily Fakeout Low Continuation (bullish context).
2. The New York session forms an Open Box; price breaks above and holds above the first-hour high.
3. A Fakeout Low + Switch Bar appears on M5 (via FO), after retesting the session VWAP triggering the entry.
4. 1x expansion level serves as reference targets for take profit.
Relation to the TrendPredator Ecosystem
The Open Box is part of the TrendPredator Indicator Family, designed to apply multi-timeframe logic consistently across:
* higher-timeframe context and setups
* intraday and session structure (OB)
* microstructure confirmation (FO)
Together, these modules offer a unified structure for analysing how daily and intraday cycles interact.
Disclaimer
This indicator is for educational purposes only and does not guarantee profits.
It does not provide buy or sell signals but highlights structural and behavioural areas for analysis.
Users are solely responsible for their trading decisions and outcomes.

Combined EMA Technical AnalysisThis script is written in Pine Script (version 5) for TradingView and creates a comprehensive technical analysis indicator called "Combined EMA Technical Analysis." It overlays multiple technical indicators on a price chart, including Exponential Moving Averages (EMAs), VWAP, MACD, PSAR, RSI, Bollinger Bands, ADX, and external data from the S&P 500 (SPX) and VIX indices. The script also provides visual cues through colors, shapes, and a customizable table to help traders interpret market conditions.
Here’s a breakdown of the script:
---
### **1. Purpose**
- The script combines several popular technical indicators to analyze price trends, momentum, volatility, and market sentiment.
- It uses color coding (green for bullish, red for bearish, gray/white for neutral) and a table to display key information.
---
### **2. Custom Colors**
- Defines custom RGB colors for bullish (`customGreen`), bearish (`customRed`), and neutral (`neutralGray`) signals to enhance visual clarity.
---
### **3. User Inputs**
- **EMA Colors**: Users can customize the colors of five EMAs (8, 20, 9, 21, 50 periods).
- **MACD Settings**: Adjustable short length (12), long length (26), and signal length (9).
- **RSI Settings**: Adjustable length (14).
- **Bollinger Bands Settings**: Length (20), multiplier (2), and proximity threshold (0.1% of band width).
- **ADX Settings**: Adjustable length (14).
- **Table Settings**: Position (e.g., "Bottom Right") and text size (e.g., "Small").
---
### **4. Indicator Calculations**
#### **Exponential Moving Averages (EMAs)**
- Calculates five EMAs: 8, 20, 9, 21, and 50 periods based on the closing price.
- Used to identify short-term and long-term trends.
#### **Volume Weighted Average Price (VWAP)**
- Resets daily and calculates the average price weighted by volume.
- Color-coded: green if price > VWAP (bullish), red if price < VWAP (bearish), white if neutral.
#### **MACD (Moving Average Convergence Divergence)**
- Uses short (12) and long (26) EMAs to compute the MACD line, with a 9-period signal line.
- Displays "Bullish" (green) if MACD > signal, "Bearish" (red) if MACD < signal.
#### **Parabolic SAR (PSAR)**
- Calculated with acceleration factors (start: 0.02, increment: 0.02, max: 0.2).
- Indicates trend direction: green if price > PSAR (bullish), red if price < PSAR (bearish).
#### **Relative Strength Index (RSI)**
- Measures momentum over 14 periods.
- Highlighted in green if > 70 (overbought), red if < 30 (oversold), white otherwise.
#### **Bollinger Bands (BB)**
- Uses a 20-period SMA with a 2-standard-deviation multiplier.
- Color-coded based on price position:
- Green: Above upper band or close to it.
- Red: Below lower band or close to it.
- Gray: Neutral (within bands).
#### **Average Directional Index (ADX)**
- Manually calculates ADX to measure trend strength:
- Strong trend: ADX > 25.
- Very strong trend: ADX > 50.
- Direction: Bullish if +DI > -DI, bearish if -DI > +DI.
#### **EMA Crosses**
- Detects bullish (crossover) and bearish (crossunder) events for:
- EMA 9 vs. EMA 21.
- EMA 8 vs. EMA 20.
- Visualized with green (bullish) or red (bearish) circles.
#### **SPX and VIX Data**
- Fetches daily closing prices for the S&P 500 (SPX) and VIX (volatility index).
- SPX trend: Bullish if EMA 9 > EMA 21, bearish if EMA 9 < EMA 21.
- VIX levels: High (> 25, fear), Low (< 15, stability).
- VIX color: Green if SPX bullish and VIX low, red if SPX bearish and VIX high, white otherwise.
---
### **5. Visual Outputs**
#### **Plots**
- EMAs, VWAP, and PSAR are plotted on the chart with their respective colors.
- EMA crosses are marked with circles (green for bullish, red for bearish).
#### **Table**
- Displays a summary of indicators in a customizable position and size.
- Indicators shown (if enabled):
- EMA 8/20, 9/21, 50: Green dot if bullish, red if bearish.
- VWAP: Green if price > VWAP, red if price < VWAP.
- MACD: Green if bullish, red if bearish.
- MACD Zero: Green if MACD > 0, red if MACD < 0.
- PSAR: Green if price > PSAR, red if price < PSAR.
- ADX: Arrows for very strong trends (↑/↓), dots for weaker trends, colored by direction.
- Bollinger Bands: Arrows (↑/↓) or dots based on price position.
- RSI: Numeric value, colored by overbought/oversold levels.
- VIX: Numeric value, colored based on SPX trend and VIX level.
---
### **6. Alerts**
- Triggers alerts for EMA 8/20 crosses:
- Bullish: "EMA 8/20 Bullish Cross on Candle Close!"
- Bearish: "EMA 8/20 Bearish Cross on Candle Close!"
---
### **7. Key Features**
- **Flexibility**: Users can toggle indicators on/off in the table and adjust parameters.
- **Visual Clarity**: Consistent use of green (bullish), red (bearish), and neutral colors.
- **Comprehensive**: Combines trend, momentum, volatility, and market sentiment indicators.
---
### **How to Use**
1. Add the script to TradingView.
2. Customize inputs (colors, lengths, table position) as needed.
3. Interpret the chart and table:
- Green signals suggest bullish conditions.
- Red signals suggest bearish conditions.
- Neutral signals indicate indecision or consolidation.
4. Set up alerts for EMA crosses to catch trend changes.
This script is ideal for traders who want a multi-indicator dashboard to monitor price action and market conditions efficiently.

NasyI## NasyI - Multi-Timeframe Technical Analysis Toolkit
### English Description
**NasyI** is a comprehensive technical analysis indicator designed to provide traders with a complete view of market dynamics across multiple timeframes. This indicator combines the power of Exponential Moving Averages (EMAs), Simple Moving Averages (MAs), Volume Weighted Average Price (VWAP), and key support/resistance levels to help traders identify trend direction, potential reversal points, and optimal entry/exit opportunities.
#### Key Features
1. **Multi-Timeframe Analysis System**
- 2-minute EMAs (13, 48) for ultra-short-term trend identification
- 5-minute EMAs (9, 13, 21, 48, 200) for short-term trend confirmation
- Daily EMAs (5, 13, 21, 48, 100, 200) and MAs (20, 50, 100, 200) for longer-term perspective
- Color-coded bands between key EMAs to visually identify trend strength and direction
2. **Advanced VWAP Integration**
- Daily VWAP for intraday support/resistance
- Weekly VWAP for medium-term price reference
- Monthly VWAP for long-term institutional price levels
- All VWAPs properly reset at their respective time period boundaries
3. **Critical Price Level Identification**
- Previous day high/low lines for identifying key breakout and breakdown levels
- Pre-market high/low tracking to identify potential intraday support/resistance zones
- All levels displayed with distinct line styles for easy identification
4. **Dynamic Trend Analysis**
- Color-coded bands between EMAs display trend strength and direction:
- Green bands indicate uptrend conditions (9 EMA > 21 EMA > 48 EMA)
- Red bands indicate downtrend conditions (9 EMA < 21 EMA < 48 EMA)
- Yellow bands indicate neutral/confused market conditions
- Visual representation makes trend changes immediately apparent
5. **Comprehensive Customization Options**
- Fully customizable colors for all indicators and bands
- Adjustable transparency settings for visual clarity
- Optional price labels with customizable placement and appearance
- Ability to show/hide specific components based on trading preferences
#### Trading Applications
This indicator is particularly valuable for:
1. **Day Trading & Scalping**: The 2-minute and 5-minute EMAs with color bands provide clear short-term trend direction and potential reversal signals.
2. **Swing Trading**: Daily EMAs and MAs offer perspective on the larger trend, helping to align short-term trades with the broader market direction.
3. **Gap Trading**: Previous day and pre-market levels help identify potential gap fill scenarios and breakout/breakdown opportunities.
4. **VWAP Trading Strategies**: Multiple timeframe VWAPs allow for identifying institutional participation levels and potential reversal zones.
5. **EMA Cross Systems**: The various EMAs can be used to identify golden crosses and death crosses across multiple timeframes.
#### How the Components Work Together
The power of NasyI comes from the integration of these different technical elements:
1. The short-timeframe EMAs (2m, 5m) provide immediate trend information, while the daily EMAs/MAs provide context about the larger market structure.
2. The color bands between EMAs offer instant visual confirmation of trend alignment or divergence across timeframes.
3. Previous day and pre-market levels add horizontal support/resistance zones to complement the dynamic moving averages.
4. Multiple timeframe VWAPs provide additional confirmation of institutional activity levels and potential reversal points.
By combining these elements, traders can develop a comprehensive market view that integrates price action, trend direction, and key support/resistance levels all in one indicator.
#### Usage Instructions
1. Apply the NasyI indicator to your chart (works best on intraday timeframes from 1-minute to 30-minute).
2. Observe the relationship between price and the various EMAs:
- Price above the 2m/5m EMAs with green bands indicates bullish short-term conditions
- Price below the 2m/5m EMAs with red bands indicates bearish short-term conditions
3. Use the daily EMAs/MAs and VWAPs as targets for potential price movements and reversal zones.
4. Previous day and pre-market high/low lines provide key levels to watch for breakouts or breakdowns.
5. Customize the appearance according to your preferences using the extensive settings options.
This indicator represents a unique approach to technical analysis by combining multiple timeframe perspectives into a single, visually intuitive display that helps traders make more informed decisions based on a comprehensive view of market conditions.
### 中文描述
**NasyI** 是一个全面的技术分析指标,旨在为交易者提供跨多个时间周期的完整市场动态视图。该指标结合了指数移动平均线(EMA)、简单移动平均线(MA)、成交量加权平均价格(VWAP)和关键支撑/阻力水平的力量,帮助交易者识别趋势方向、潜在反转点和最佳进出场机会。
#### 主要特点
1. **多时间周期分析系统**
- 2分钟EMAs(13,48)用于超短期趋势识别
- 5分钟EMAs(9,13,21,48,200)用于短期趋势确认
- 日线EMAs(5,13,21,48,100,200)和MAs(20,50,100,200)用于更长期的视角
- 关键EMAs之间的彩色带状区域直观显示趋势强度和方向
2. **高级VWAP整合**
- 日内VWAP作为日内支撑/阻力
- 周内VWAP作为中期价格参考
- 月内VWAP作为长期机构价格水平
- 所有VWAP在各自的时间周期边界正确重置
3. **关键价格水平识别**
- 前一交易日高点/低点线用于识别关键突破和跌破水平
- 盘前高点/低点跟踪用于识别潜在的日内支撑/阻力区域
- 所有水平以不同的线条样式显示,便于识别
4. **动态趋势分析**
- EMAs之间的彩色带状区域显示趋势强度和方向:
- 绿色带状区域表示上升趋势(9 EMA > 21 EMA > 48 EMA)
- 红色带状区域表示下降趋势(9 EMA < 21 EMA < 48 EMA)
- 黄色带状区域表示中性/混乱市场条件
- 视觉表示使趋势变化立即显现
5. **全面的自定义选项**
- 所有指标和带状区域的颜色完全可定制
- 可调节的透明度设置,提高视觉清晰度
- 可选的价格标签,带有可定制的位置和外观
- 能够根据交易偏好显示/隐藏特定组件
#### 交易应用
此指标对以下方面特别有价值:
1. **日内交易和短线交易**:2分钟和5分钟EMAs与色带提供清晰的短期趋势方向和潜在反转信号。
2. **摇摆交易**:日线EMAs和MAs提供对更大趋势的视角,帮助将短期交易与更广泛的市场方向对齐。
3. **缺口交易**:前一日和盘前水平帮助识别潜在的缺口填充情况和突破/跌破机会。
4. **VWAP交易策略**:多时间周期VWAP允许识别机构参与水平和潜在反转区域。
5. **EMA交叉系统**:各种EMAs可用于识别跨多个时间周期的黄金交叉和死亡交叉。
#### 组件如何协同工作
NasyI的强大之处在于这些不同技术元素的集成:
1. 短时间周期EMAs(2m,5m)提供即时趋势信息,而日线EMAs/MAs提供关于更大市场结构的背景。
2. EMAs之间的色带提供趋势对齐或跨时间周期分歧的即时视觉确认。
3. 前一日和盘前水平添加水平支撑/阻力区域,补充动态移动平均线。
4. 多时间周期VWAP提供机构活动水平和潜在反转点的额外确认。
通过结合这些元素,交易者可以发展出全面的市场视图,整合价格行动、趋势方向和关键支撑/阻力水平于一个指标中。
#### 使用说明
1. 将NasyI指标应用到您的图表上(最适合1分钟至30分钟的日内时间周期)。
2. 观察价格与各种EMAs之间的关系:
- 价格位于2m/5m EMAs之上,带有绿色带状区域,表示看涨的短期条件
- 价格位于2m/5m EMAs之下,带有红色带状区域,表示看跌的短期条件
3. 使用日线EMAs/MAs和VWAPs作为潜在价格移动和反转区域的目标。
4. 前一日和盘前高点/低点线提供需要关注的突破或跌破的关键水平。
5. 使用广泛的设置选项根据您的偏好自定义外观。
这个指标代表了一种独特的技术分析方法,将多个时间周期的视角结合到一个单一的、视觉直观的显示中,帮助交易者基于对市场条件的全面视图做出更明智的决策。

Volume Weighted Median Price (VWMP)The volume is indeed crucial for confirming price moves and understanding market conviction. While many traders are familiar with VWAP (Volume Weighted Average Price), this indicator introduces a lesser-known but powerful cousin: the Volume Weighted Median Price (VWMP).
What is VWMP?
Unlike VWAP, which calculates the average price weighted by volume over a period, VWMP identifies the median price level weighted by volume.
Think of it this way: If you line up all the trades within a specific lookback period, sorted by price, and then start accumulating the volume traded at each price level, the VWMP is the price level where 50% of the total volume occurred below it, and 50% occurred above it.
It essentially finds the "middle ground" of trading activity based on where the bulk of the volume actually traded, not just the average price.
Key Difference: VWMP vs. VWAP
VWAP: Volume Weighted Average Price. Sensitive to outliers (single large trades at extreme prices can skew the average).
VWMP: Volume Weighted Median Price. More robust to outliers. It represents the price that splits the period's volume distribution in half.
Because it uses the median, VWMP can sometimes provide a more stable or representative level of the "typical" price where significant volume is changing hands, especially in volatile markets or when large, anomalous trades occur.
How to Interpret and Use VWMP in trading
The VWMP plots as a line on your chart, similar to a moving average or VWAP. Here are a few ways traders might use it:
Dynamic Support and Resistance:
Like VWAP, the VWMP line can act as a dynamic level of interest.
Watch how price interacts with the VWMP. Consistent acceptance above VWMP might suggest bullish control and potential support.
Consistent rejection or acceptance below VWMP might indicate bearish control and potential resistance.
Trend Filter / Confirmation:
Uptrend: Look for price consistently staying above the VWMP line. Pullbacks to the VWMP that hold could offer entry opportunities.
Downtrend: Look for price consistently staying below the VWMP line. Rallies to the VWMP that fail could present shorting opportunities.
Use it to filter trades: Only take long trades if price is above VWMP, and short trades if below.
Mean Reversion Potential (Use with Caution):
When price extends significantly far away from the VWMP, some traders might look for potential reversion back towards this volume-based median level.
Important: This should not be used in isolation. Always look for confirmation from other indicators (like RSI, Stochastics, or candlestick patterns) before trading counter-trend reversions.
Confluence with Other Indicators:
VWMP works best when combined with other analysis tools.
Look for confluence: Does the VWMP align with a key Fibonacci level, a standard moving average, or a prior support/resistance zone? This confluence strengthens the level's potential significance.
Considerations
Lookback Period: The length input is crucial. A shorter period makes VWMP more responsive to recent action; a longer period makes it smoother and reflects longer-term volume distribution. Experiment to find what suits your timeframe and trading style.
Lagging Nature: Like all indicators based on past data, VWMP is inherently lagging. It reflects past volume distribution, not the future.
Market Context: Its effectiveness can vary depending on the market conditions (trending vs. ranging) and the asset being traded.

Danger Signals from The Trading MindwheelThe " Danger Signals " indicator, a collaborative creation from the minds at Amphibian Trading and MARA Wealth, serves as your vigilant lookout in the volatile world of stock trading. Drawing from the wisdom encapsulated in "The Trading Mindwheel" and the successful methodologies of legends like William O'Neil and Mark Minervini, this tool is engineered to safeguard your trading journey.
Core Features:
Real-Time Alerts: Identify critical danger signals as they emerge in the market. Whether it's a single day of heightened risk or a pattern forming, stay informed with specific danger signals and a tally of signals for comprehensive decision-making support. The indicator looks for over 30 different signals ranging from simple closing ranges to more complex signals like blow off action.
Tailored Insights with Portfolio Heat Integration: Pair with the "Portfolio Heat" indicator to customize danger signals based on your current positions, entry points, and stops. This personalized approach ensures that the insights are directly relevant to your trading strategy. Certain signals can have different meanings based on where your trade is at in its lifecycle. Blow off action at the beginning of a trend can be viewed as strength, while after an extended run could signal an opportunity to lock in profits.
Forward-Looking Analysis: Leverage the 'Potential Danger Signals' feature to assess future risks. Enter hypothetical price levels to understand potential market reactions before they unfold, enabling proactive trade management.
The indicator offers two different modes of 'Potential Danger Signals', Worst Case or Immediate. Worst Case allows the user to input any price and see what signals would fire based on price reaching that level, while the Immediate mode looks for potential Danger Signals that could happen on the next bar.
This is achieved by adding and subtracting the average daily range to the current bars close while also forecasting the next values of moving averages, vwaps, risk multiples and the relative strength line to see if a Danger Signal would trigger.
User Customization: Flexibility is at your fingertips with toggle options for each danger signal. Tailor the indicator to match your unique trading style and risk tolerance. No two traders are the same, that is why each signal is able to be turned on or off to match your trading personality.
Versatile Application: Ideal for growth stock traders, momentum swing traders, and adherents of the CANSLIM methodology. Whether you're a novice or a seasoned investor, this tool aligns with strategies influenced by trading giants.
Validation and Utility:
Inspired by the trade management principles of Michael Lamothe, the " Danger Signals " indicator is more than just a tool; it's a reflection of tested strategies that highlight the importance of risk management. Through rigorous validation, including the insights from "The Trading Mindwheel," this indicator helps traders navigate the complexities of the market with an informed, strategic approach.
Whether you're contemplating a new position or evaluating an existing one, the " Danger Signals " indicator is designed to provide the clarity needed to avoid potential pitfalls and capitalize on opportunities with confidence. Embrace a smarter way to trade, where awareness and preparation open the door to success.
Let's dive into each of the components of this indicator.
Volume: Volume refers to the number of shares or contracts traded in a security or an entire market during a given period. It is a measure of the total trading activity and liquidity, indicating the overall interest in a stock or market.
Price Action: the analysis of historical prices to inform trading decisions, without the use of technical indicators. It focuses on the movement of prices to identify patterns, trends, and potential reversal points in the market.
Relative Strength Line: The RS line is a popular tool used to compare the performance of a stock, typically calculated as the ratio of the stock's price to a benchmark index's price. It helps identify outperformers and underperformers relative to the market or a specific sector. The RS value is calculated by dividing the close price of the chosen stock by the close price of the comparative symbol (SPX by default).
Average True Range (ATR): ATR is a market volatility indicator used to show the average range prices swing over a specified period. It is calculated by taking the moving average of the true ranges of a stock for a specific period. The true range for a period is the greatest of the following three values:
The difference between the current high and the current low.
The absolute value of the current high minus the previous close.
The absolute value of the current low minus the previous close.
Average Daily Range (ADR): ADR is a measure used in trading to capture the average range between the high and low prices of an asset over a specified number of past trading days. Unlike the Average True Range (ATR), which accounts for gaps in the price from one day to the next, the Average Daily Range focuses solely on the trading range within each day and averages it out.
Anchored VWAP: AVWAP gives the average price of an asset, weighted by volume, starting from a specific anchor point. This provides traders with a dynamic average price considering both price and volume from a specific start point, offering insights into the market's direction and potential support or resistance levels.
Moving Averages: Moving Averages smooth out price data by creating a constantly updated average price over a specific period of time. It helps traders identify trends by flattening out the fluctuations in price data.
Stochastic: A stochastic oscillator is a momentum indicator used in technical analysis that compares a particular closing price of an asset to a range of its prices over a certain period of time. The theory behind the stochastic oscillator is that in a market trending upwards, prices will tend to close near their high, and in a market trending downwards, prices close near their low.
While each of these components offer unique insights into market behavior, providing sell signals under specific conditions, the power of combining these different signals lies in their ability to confirm each other's signals. This in turn reduces false positives and provides a more reliable basis for trading decisions
These signals can be recognized at any time, however the indicators power is in it's ability to take into account where a trade is in terms of your entry price and stop.
If a trade just started, it hasn’t earned much leeway. Kind of like a new employee that shows up late on the first day of work. It’s less forgivable than say the person who has been there for a while, has done well, is on time, and then one day comes in late.
Contextual Sensitivity:
For instance, a high volume sell-off coupled with a bearish price action pattern significantly strengthens the sell signal. When the price closes below an Anchored VWAP or a critical moving average in this context, it reaffirms the bearish sentiment, suggesting that the momentum is likely to continue downwards.
By considering the relative strength line (RS) alongside volume and price action, the indicator can differentiate between a normal retracement in a strong uptrend and a when a stock starts to become a laggard.
The integration of ATR and ADR provides a dynamic framework that adjusts to the market's volatility. A sudden increase in ATR or a character change detected through comparing short-term and long-term ADR can alert traders to emerging trends or reversals.
The "Danger Signals" indicator exemplifies the power of integrating diverse technical indicators to create a more sophisticated, responsive, and adaptable trading tool. This approach not only amplifies the individual strengths of each indicator but also mitigates their weaknesses.
Portfolio Heat Indicator can be found by clicking on the image below
Danger Signals Included
Price Closes Near Low - Daily Closing Range of 30% or Less
Price Closes Near Weekly Low - Weekly Closing Range of 30% or Less
Price Closes Near Daily Low on Heavy Volume - Daily Closing Range of 30% or Less on Heaviest Volume of the Last 5 Days
Price Closes Near Weekly Low on Heavy Volume - Weekly Closing Range of 30% or Less on Heaviest Volume of the Last 5 Weeks
Price Closes Below Moving Average - Price Closes Below One of 5 Selected Moving Averages
Price Closes Below Swing Low - Price Closes Below Most Recent Swing Low
Price Closes Below 1.5 ATR - Price Closes Below Trailing ATR Stop Based on Highest High of Last 10 Days
Price Closes Below AVWAP - Price Closes Below Selected Anchored VWAP (Anchors include: High of base, Low of base, Highest volume of base, Custom date)
Price Shows Aggressive Selling - Current Bars High is Greater Than Previous Day's High and Closes Near the Lows on Heaviest Volume of the Last 5 Days
Outside Reversal Bar - Price Makes a New High and Closes Near the Lows, Lower Than the Previous Bar's Low
Price Shows Signs of Stalling - Heavy Volume with a Close of Less than 1%
3 Consecutive Days of Lower Lows - 3 Days of Lower Lows
Close Lower than 3 Previous Lows - Close is Less than 3 Previous Lows
Character Change - ADR of Last Shorter Length is Larger than ADR of Longer Length
Fast Stochastic Crosses Below Slow Stochastic - Fast Stochastic Crosses Below Slow Stochastic
Fast & Slow Stochastic Curved Down - Both Stochastic Lines Close Lower than Previous Day for 2 Consecutive Days
Lower Lows & Lower Highs Intraday - Lower High and Lower Low on 30 Minute Timeframe
Moving Average Crossunder - Selected MA Crosses Below Other Selected MA
RS Starts Curving Down - Relative Strength Line Closes Lower than Previous Day for 2 Consecutive Days
RS Turns Negative Short Term - RS Closes Below RS of 7 Days Ago
RS Underperforms Price - Relative Strength Line Not at Highs, While Price Is
Moving Average Begins to Flatten Out - First Day MA Doesn't Close Higher
Price Moves Higher on Lighter Volume - Price Makes a New High on Light Volume and 15 Day Average Volume is Less than 50 Day Average
Price Hits % Target - Price Moves Set % Higher from Entry Price
Price Hits R Multiple - Price hits (Entry - Stop Multiplied by Setting) and Added to Entry
Price Hits Overhead Resistance - Price Crosses a Swing High from a Monthly Timeframe Chart from at Least 1 Year Ago
Price Hits Fib Level - Price Crosses a Fib Extension Drawn From Base High to Low
Price Hits a Psychological Level - Price Crosses a Multiple of 0 or 5
Heavy Volume After Significant Move - Above Average and Heaviest Volume of the Last 5 Days 35 Bars or More from Breakout
Moving Averages Begin to Slope Downward - Moving Averages Fall for 2 Consecutive Days
Blow Off Action - Highest Volume, Largest Spread, Multiple Gaps in a Row 35 Bars or More Post Breakout
Late Buying Frenzy - ANTS 35 Bars or More Post Breakout
Exhaustion Gap - Gap Up 5% or Higher with Price 125% or More Above 200sma

ORB Fusion🎯 CORE INNOVATION: INSTITUTIONAL ORB FRAMEWORK WITH FAILED BREAKOUT INTELLIGENCE
ORB Fusion represents a complete institutional-grade Opening Range Breakout system combining classic Market Profile concepts (Initial Balance, day type classification) with modern algorithmic breakout detection, failed breakout reversal logic, and comprehensive statistical tracking. Rather than simply drawing lines at opening range extremes, this system implements the full trading methodology used by professional floor traders and market makers—including the critical concept that failed breakouts are often higher-probability setups than successful breakouts .
The Opening Range Hypothesis:
The first 30-60 minutes of trading establishes the day's value area —the price range where the majority of participants agree on fair value. This range is formed during peak information flow (overnight news digestion, gap reactions, early institutional positioning). Breakouts from this range signal directional conviction; failures to hold breakouts signal trapped participants and create exploitable reversals.
Why Opening Range Matters:
1. Information Aggregation : Opening range reflects overnight news, pre-market sentiment, and early institutional orders. It's the market's initial "consensus" on value.
2. Liquidity Concentration : Stop losses cluster just outside opening range. Breakouts trigger these stops, creating momentum. Failed breakouts trap traders, forcing reversals.
3. Statistical Persistence : Markets exhibit range expansion tendency —when price accepts above/below opening range with volume, it often extends 1.0-2.0x the opening range size before mean reversion.
4. Institutional Behavior : Large players (market makers, institutions) use opening range as reference for the day's trading plan. They fade extremes in rotation days and follow breakouts in trend days.
Historical Context:
Opening Range Breakout methodology originated in commodity futures pits (1970s-80s) where floor traders noticed consistent patterns: the first 30-60 minutes established a "fair value zone," and directional moves occurred when this zone was violated with conviction. J. Peter Steidlmayer formalized this observation in Market Profile theory, introducing the "Initial Balance" concept—the first hour (two 30-minute periods) defining market structure.
📊 OPENING RANGE CONSTRUCTION
Four ORB Timeframe Options:
1. 5-Minute ORB (0930-0935 ET):
Captures immediate market direction during "opening drive"—the explosive first few minutes when overnight orders hit the tape.
Use Case:
• Scalping strategies
• High-frequency breakout trading
• Extremely liquid instruments (ES, NQ, SPY)
Characteristics:
• Very tight range (often 0.2-0.5% of price)
• Early breakouts common (7 of 10 days break within first hour)
• Higher false breakout rate (50-60%)
• Requires sub-minute chart monitoring
Psychology: Captures panic buyers/sellers reacting to overnight news. Range is small because sample size is minimal—only 5 minutes of price discovery. Early breakouts often fail because they're driven by retail FOMO rather than institutional conviction.
2. 15-Minute ORB (0930-0945 ET):
Balances responsiveness with statistical validity. Captures opening drive plus initial reaction to that drive.
Use Case:
• Day trading strategies
• Balanced scalping/swing hybrid
• Most liquid instruments
Characteristics:
• Moderate range (0.4-0.8% of price typically)
• Breakout rate ~60% of days
• False breakout rate ~40-45%
• Good balance of opportunity and reliability
Psychology: Includes opening panic AND the first retest/consolidation. Sophisticated traders (institutions, algos) start expressing directional bias. This is the "Goldilocks" timeframe—not too reactive, not too slow.
3. 30-Minute ORB (0930-1000 ET):
Classic ORB timeframe. Default for most professional implementations.
Use Case:
• Standard intraday trading
• Position sizing for full-day trades
• All liquid instruments (equities, indices, futures)
Characteristics:
• Substantial range (0.6-1.2% of price)
• Breakout rate ~55% of days
• False breakout rate ~35-40%
• Statistical sweet spot for extensions
Psychology: Full opening auction + first institutional repositioning complete. By 10:00 AM ET, headlines are digested, early stops are hit, and "real" directional players reveal themselves. This is when institutional programs typically finish their opening positioning.
Statistical Advantage: 30-minute ORB shows highest correlation with daily range. When price breaks and holds outside 30m ORB, probability of reaching 1.0x extension (doubling the opening range) exceeds 60% historically.
4. 60-Minute ORB (0930-1030 ET) - Initial Balance:
Steidlmayer's "Initial Balance"—the foundation of Market Profile theory.
Use Case:
• Swing trading entries
• Day type classification
• Low-frequency institutional setups
Characteristics:
• Wide range (0.8-1.5% of price)
• Breakout rate ~45% of days
• False breakout rate ~25-30% (lowest)
• Best for trend day identification
Psychology: Full first hour captures A-period (0930-1000) and B-period (1000-1030). By 10:30 AM ET, all early positioning is complete. Market has "voted" on value. Subsequent price action confirms (trend day) or rejects (rotation day) this value assessment.
Initial Balance Theory:
IB represents the market's accepted value area . When price extends significantly beyond IB (>1.5x IB range), it signals a Trend Day —strong directional conviction. When price remains within 1.0x IB, it signals a Rotation Day —mean reversion environment. This classification completely changes trading strategy.
🔬 LTF PRECISION TECHNOLOGY
The Chart Timeframe Problem:
Traditional ORB indicators calculate range using the chart's current timeframe. This creates critical inaccuracies:
Example:
• You're on a 5-minute chart
• ORB period is 30 minutes (0930-1000 ET)
• Indicator sees only 6 bars (30min ÷ 5min/bar = 6 bars)
• If any 5-minute bar has extreme wick, entire ORB is distorted
The Problem Amplifies:
• On 15-minute chart with 30-minute ORB: Only 2 bars sampled
• On 30-minute chart with 30-minute ORB: Only 1 bar sampled
• Opening spike or single large wick defines entire range (invalid)
Solution: Lower Timeframe (LTF) Precision:
ORB Fusion uses `request.security_lower_tf()` to sample 1-minute bars regardless of chart timeframe:
```
For 30-minute ORB on 15-minute chart:
- Traditional method: Uses 2 bars (15min × 2 = 30min)
- LTF Precision: Requests thirty 1-minute bars, calculates true high/low
```
Why This Matters:
Scenario: ES futures, 15-minute chart, 30-minute ORB
• Traditional ORB: High = 5850.00, Low = 5842.00 (range = 8 points)
• LTF Precision ORB: High = 5848.50, Low = 5843.25 (range = 5.25 points)
Difference: 2.75 points distortion from single 15-minute wick hitting 5850.00 at 9:31 AM then immediately reversing. LTF precision filters this out by seeing it was a fleeting wick, not a sustained high.
Impact on Extensions:
With inflated range (8 points vs 5.25 points):
• 1.5x extension projects +12 points instead of +7.875 points
• Difference: 4.125 points (nearly $200 per ES contract)
• Breakout signals trigger late; extension targets unreachable
Implementation:
```pinescript
getLtfHighLow() =>
float ha = request.security_lower_tf(syminfo.tickerid, "1", high)
float la = request.security_lower_tf(syminfo.tickerid, "1", low)
```
Function returns arrays of 1-minute high/low values, then finds true maximum and minimum across all samples.
When LTF Precision Activates:
Only when chart timeframe exceeds ORB session window:
• 5-minute chart + 30-minute ORB: LTF used (chart TF > session bars needed)
• 1-minute chart + 30-minute ORB: LTF not needed (direct sampling sufficient)
Recommendation: Always enable LTF Precision unless you're on 1-minute charts. The computational overhead is negligible, and accuracy improvement is substantial.
⚖️ INITIAL BALANCE (IB) FRAMEWORK
Steidlmayer's Market Profile Innovation:
J. Peter Steidlmayer developed Market Profile in the 1980s for the Chicago Board of Trade. His key insight: market structure is best understood through time-at-price (value area) rather than just price-over-time (traditional charts).
Initial Balance Definition:
IB is the price range established during the first hour of trading, subdivided into:
• A-Period : First 30 minutes (0930-1000 ET for US equities)
• B-Period : Second 30 minutes (1000-1030 ET)
A-Period vs B-Period Comparison:
The relationship between A and B periods forecasts the day:
B-Period Expansion (Bullish):
• B-period high > A-period high
• B-period low ≥ A-period low
• Interpretation: Buyers stepping in after opening assessed
• Implication: Bullish continuation likely
• Strategy: Buy pullbacks to A-period high (now support)
B-Period Expansion (Bearish):
• B-period low < A-period low
• B-period high ≤ A-period high
• Interpretation: Sellers stepping in after opening assessed
• Implication: Bearish continuation likely
• Strategy: Sell rallies to A-period low (now resistance)
B-Period Contraction:
• B-period stays within A-period range
• Interpretation: Market indecisive, digesting A-period information
• Implication: Rotation day likely, stay range-bound
• Strategy: Fade extremes, sell high/buy low within IB
IB Extensions:
Professional traders use IB as a ruler to project price targets:
Extension Levels:
• 0.5x IB : Initial probe outside value (minor target)
• 1.0x IB : Full extension (major target for normal days)
• 1.5x IB : Trend day threshold (classifies as trending)
• 2.0x IB : Strong trend day (rare, ~10-15% of days)
Calculation:
```
IB Range = IB High - IB Low
Bull Extension 1.0x = IB High + (IB Range × 1.0)
Bear Extension 1.0x = IB Low - (IB Range × 1.0)
```
Example:
ES futures:
• IB High: 5850.00
• IB Low: 5842.00
• IB Range: 8.00 points
Extensions:
• 1.0x Bull Target: 5850 + 8 = 5858.00
• 1.5x Bull Target: 5850 + 12 = 5862.00
• 2.0x Bull Target: 5850 + 16 = 5866.00
If price reaches 5862.00 (1.5x), day is classified as Trend Day —strategy shifts from mean reversion to trend following.
📈 DAY TYPE CLASSIFICATION SYSTEM
Four Day Types (Market Profile Framework):
1. TREND DAY:
Definition: Price extends ≥1.5x IB range in one direction and stays there.
Characteristics:
• Opens and never returns to IB
• Persistent directional movement
• Volume increases as day progresses (conviction building)
• News-driven or strong institutional flow
Frequency: ~20-25% of trading days
Trading Strategy:
• DO: Follow the trend, trail stops, let winners run
• DON'T: Fade extremes, take early profits
• Key: Add to position on pullbacks to previous extension level
• Risk: Getting chopped in false trend (see Failed Breakout section)
Example: FOMC decision, payroll report, earnings surprise—anything creating one-sided conviction.
2. NORMAL DAY:
Definition: Price extends 0.5-1.5x IB, tests both sides, returns to IB.
Characteristics:
• Two-sided trading
• Extensions occur but don't persist
• Volume balanced throughout day
• Most common day type
Frequency: ~45-50% of trading days
Trading Strategy:
• DO: Take profits at extension levels, expect reversals
• DON'T: Hold for massive moves
• Key: Treat each extension as a profit-taking opportunity
• Risk: Holding too long when momentum shifts
Example: Typical day with no major catalysts—market balancing supply and demand.
3. ROTATION DAY:
Definition: Price stays within IB all day, rotating between high and low.
Characteristics:
• Never accepts outside IB
• Multiple tests of IB high/low
• Decreasing volume (no conviction)
• Classic range-bound action
Frequency: ~25-30% of trading days
Trading Strategy:
• DO: Fade extremes (sell IB high, buy IB low)
• DON'T: Chase breakouts
• Key: Enter at extremes with tight stops just outside IB
• Risk: Breakout finally occurs after multiple failures
Example: [/b> Pre-holiday trading, summer doldrums, consolidation after big move.
4. DEVELOPING:
Definition: Day type not yet determined (early in session).
Usage: Classification before 12:00 PM ET when IB extension pattern unclear.
ORB Fusion's Classification Algorithm:
```pinescript
if close > ibHigh:
ibExtension = (close - ibHigh) / ibRange
direction = "BULLISH"
else if close < ibLow:
ibExtension = (ibLow - close) / ibRange
direction = "BEARISH"
if ibExtension >= 1.5:
dayType = "TREND DAY"
else if ibExtension >= 0.5:
dayType = "NORMAL DAY"
else if close within IB:
dayType = "ROTATION DAY"
```
Why Classification Matters:
Same setup (bullish ORB breakout) has opposite implications:
• Trend Day : Hold for 2.0x extension, trail stops aggressively
• Normal Day : Take profits at 1.0x extension, watch for reversal
• Rotation Day : Fade the breakout immediately (likely false)
Knowing day type prevents catastrophic errors like fading a trend day or holding through rotation.
🚀 BREAKOUT DETECTION & CONFIRMATION
Three Confirmation Methods:
1. Close Beyond Level (Recommended):
Logic: Candle must close above ORB high (bull) or below ORB low (bear).
Why:
• Filters out wicks (temporary liquidity grabs)
• Ensures sustained acceptance above/below range
• Reduces false breakout rate by ~20-30%
Example:
• ORB High: 5850.00
• Bar high touches 5850.50 (wick above)
• Bar closes at 5848.00 (inside range)
• Result: NO breakout signal
vs.
• Bar high touches 5850.50
• Bar closes at 5851.00 (outside range)
• Result: BREAKOUT signal confirmed
Trade-off: Slightly delayed entry (wait for close) but much higher reliability.
2. Wick Beyond Level:
Logic: [/b> Any touch of ORB high/low triggers breakout.
Why:
• Earliest possible entry
• Captures aggressive momentum moves
Risk:
• High false breakout rate (60-70%)
• Stop runs trigger signals
• Requires very tight stops (difficult to manage)
Use Case: Scalping with 1-2 point profit targets where any penetration = trade.
3. Body Beyond Level:
Logic: [/b> Candle body (close vs open) must be entirely outside range.
Why:
• Strictest confirmation
• Ensures directional conviction (not just momentum)
• Lowest false breakout rate
Example: Trade-off: [/b> Very conservative—misses some valid breakouts but rarely triggers on false ones.
Volume Confirmation Layer:
All confirmation methods can require volume validation:
Volume Multiplier Logic: Rationale: [/b> True breakouts are driven by institutional activity (large size). Volume spike confirms real conviction vs. stop-run manipulation.
Statistical Impact: [/b>
• Breakouts with volume confirmation: ~65% success rate
• Breakouts without volume: ~45% success rate
• Difference: 20 percentage points edge
Implementation Note: [/b>
Volume confirmation adds complexity—you'll miss breakouts that work but lack volume. However, when targeting 1.5x+ extensions (ambitious goals), volume confirmation becomes critical because those moves require sustained institutional participation.
Recommended Settings by Strategy: [/b>
Scalping (1-2 point targets): [/b>
• Method: Close
• Volume: OFF
• Rationale: Quick in/out doesn't need perfection
Intraday Swing (5-10 point targets): [/b>
• Method: Close
• Volume: ON (1.5x multiplier)
• Rationale: Balance reliability and opportunity
Position Trading (full-day holds): [/b>
• Method: Body
• Volume: ON (2.0x multiplier)
• Rationale: Must be certain—large stops require high win rate
🔥 FAILED BREAKOUT SYSTEM
The Core Insight: [/b>
Failed breakouts are often more profitable [/b> than successful breakouts because they create trapped traders with predictable behavior.
Failed Breakout Definition: [/b>
A breakout that:
1. Initially penetrates ORB level with confirmation
2. Attracts participants (volume spike, momentum)
3. Fails to extend (stalls or immediately reverses)
4. Returns inside ORB range within N bars
Psychology of Failure: [/b>
When breakout fails:
• Breakout buyers are trapped [/b>: Bought at ORB high, now underwater
• Early longs reduce: Take profit, fearful of reversal
• Shorts smell blood: See failed breakout as reversal signal
• Result: Cascade of selling as trapped bulls exit + new shorts enter
Mirror image for failed bearish breakouts (trapped shorts cover + new longs enter).
Failure Detection Parameters: [/b>
1. Failure Confirmation Bars (default: 3): [/b>
How many bars after breakout to confirm failure?
Logic: Settings: [/b>
• 2 bars: Aggressive failure detection (more signals, more false failures)
• 3 bars Balanced (default)
• 5-10 bars: Conservative (wait for clear reversal)
Why This Matters:
Too few bars: You call "failed breakout" when price is just consolidating before next leg.
Too many bars: You miss the reversal entry (price already back in range).
2. Failure Buffer (default: 0.1 ATR): [/b>
How far inside ORB must price return to confirm failure?
Formula: Why Buffer Matters: clear rejection [/b> (not just hovering at level).
Settings: [/b>
• 0.0 ATR: No buffer, immediate failure signal
• 0.1 ATR: Small buffer (default) - filters noise
• [b>0.2-0.3 ATR: Large buffer - only dramatic failures count
Example: Reversal Entry System: [/b>
When failure confirmed, system generates complete reversal trade:
For Failed Bull Breakout (Short Reversal): [/b>
Entry: [/b> Current close when failure confirmed
Stop Loss: [/b> Extreme high since breakout + 0.10 ATR padding
Target 1: [/b> ORB High - (ORB Range × 0.5)
Target 2: Target 3: [/b> ORB High - (ORB Range × 1.5)
Example:
• ORB High: 5850, ORB Low: 5842, Range: 8 points
• Breakout to 5853, fails, reverses to 5848 (entry)
• Stop: 5853 + 1 = 5854 (6 point risk)
• T1: 5850 - 4 = 5846 (-2 points, 1:3 R:R)
• T2: 5850 - 8 = 5842 (-6 points, 1:1 R:R)
• T3: 5850 - 12 = 5838 (-10 points, 1.67:1 R:R)
[b>Why These Targets? [/b>
• T1 (0.5x ORB below high): Trapped bulls start panic
• T2 (1.0x ORB = ORB Mid): Major retracement, momentum fully reversed
• T3 (1.5x ORB): Reversal extended, now targeting opposite side
Historical Performance: [/b>
Failed breakout reversals in ORB Fusion's tracking system show:
• Win Rate: 65-75% (significantly higher than initial breakouts)
• Average Winner: 1.2x ORB range
• Average Loser: 0.5x ORB range (protected by stop at extreme)
• Expectancy: Strongly positive even with <70% win rate
Why Failed Breakouts Outperform: [/b>
1. Information Advantage: You now know what price did (failed to extend). Initial breakout trades are speculative; reversal trades are reactive to confirmed failure.
2. Trapped Participant Pressure: Every trapped bull becomes a seller. This creates sustained pressure.
3. Stop Loss Clarity: Extreme high is obvious stop (just beyond recent high). Breakout trades have ambiguous stops (ORB mid? Recent low? Too wide or too tight).
4. Mean Reversion Edge: Failed breakouts return to value (ORB mid). Initial breakouts try to escape value (harder to sustain).
Critical Insight: [/b>
"The best trade is often the one that trapped everyone else."
Failed breakouts create asymmetric opportunity because you're trading against [/b> trapped participants rather than with [/b> them. When you see a failed breakout signal, you're seeing real-time evidence that the market rejected directional conviction—that's exploitable.
📐 FIBONACCI EXTENSION SYSTEM
Six Extension Levels: [/b>
Extensions project how far price will travel after ORB breakout. Based on Fibonacci ratios + empirical market behavior.
1. 1.272x (27.2% Extension): [/b>
Formula: [/b> ORB High/Low + (ORB Range × 0.272)
Psychology: [/b> Initial probe beyond ORB. Early momentum + trapped shorts (on bull side) covering.
Probability of Reach: [/b> ~75-80% after confirmed breakout
Trading: [/b>
• First resistance/support after breakout
• Partial profit target (take 30-50% off)
• Watch for rejection here (could signal failure in progress)
Why 1.272? [/b> Related to harmonic patterns (1.272 is √1.618). Empirically, markets often stall at 25-30% extension before deciding whether to continue or fail.
2. 1.5x (50% Extension):
Formula: [/b> ORB High/Low + (ORB Range × 0.5)
Psychology: [/b> Breakout gaining conviction. Requires sustained buying/selling (not just momentum spike).
Probability of Reach: [/b> ~60-65% after confirmed breakout
Trading: [/b>
• Major partial profit (take 50-70% off)
• Move stops to breakeven
• Trail remaining position
Why 1.5x? [/b> Classic halfway point to 2.0x. Markets often consolidate here before final push. If day type is "Normal," this is likely the high/low for the day.
3. 1.618x (Golden Ratio Extension): [/b>
Formula: [/b> ORB High/Low + (ORB Range × 0.618)
Psychology: [/b> Strong directional day. Institutional conviction + retail FOMO.
Probability of Reach: [/b> ~45-50% after confirmed breakout
Trading: [/b>
• Final partial profit (close 80-90%)
• Trail remainder with wide stop (allow breathing room)
Why 1.618? [/b> Fibonacci golden ratio. Appears consistently in market geometry. When price reaches 1.618x extension, move is "mature" and reversal risk increases.
4. 2.0x (100% Extension): [/b>
Formula: ORB High/Low + (ORB Range × 1.0)
Psychology: [/b> Trend day confirmed. Opening range completely duplicated.
Probability of Reach: [/b> ~30-35% after confirmed breakout
Trading: Why 2.0x? [/b> Psychological level—range doubled. Also corresponds to typical daily ATR in many instruments (opening range ~ 0.5 ATR, daily range ~ 1.0 ATR).
5. 2.618x (Super Extension):
Formula: [/b> ORB High/Low + (ORB Range × 1.618)
Psychology: [/b> Parabolic move. News-driven or squeeze.
Probability of Reach: [/b> ~10-15% after confirmed breakout
[b>Trading: Why 2.618? [/b> Fibonacci ratio (1.618²). Rare to reach—when it does, move is extreme. Often precedes multi-day consolidation or reversal.
6. 3.0x (Extreme Extension): [/b>
Formula: [/b> ORB High/Low + (ORB Range × 2.0)
Psychology: [/b> Market melt-up/crash. Only in extreme events.
[b>Probability of Reach: [/b> <5% after confirmed breakout
Trading: [/b>
• Close immediately if reached
• These are outlier events (black swans, flash crashes, squeeze-outs)
• Holding for more is greed—take windfall profit
Why 3.0x? [/b> Triple opening range. So rare it's statistical noise. When it happens, it's headline news.
Visual Example:
ES futures, ORB 5842-5850 (8 point range), Bullish breakout:
• ORB High : 5850.00 (entry zone)
• 1.272x : 5850 + 2.18 = 5852.18 (first resistance)
• 1.5x : 5850 + 4.00 = 5854.00 (major target)
• 1.618x : 5850 + 4.94 = 5854.94 (strong target)
• 2.0x : 5850 + 8.00 = 5858.00 (trend day)
• 2.618x : 5850 + 12.94 = 5862.94 (extreme)
• 3.0x : 5850 + 16.00 = 5866.00 (parabolic)
Profit-Taking Strategy:
Optimal scaling out at extensions:
• Breakout entry at 5850.50
• 30% off at 1.272x (5852.18) → +1.68 points
• 40% off at 1.5x (5854.00) → +3.50 points
• 20% off at 1.618x (5854.94) → +4.44 points
• 10% off at 2.0x (5858.00) → +7.50 points
[b>Average Exit: Conclusion: [/b> Scaling out at extensions produces 40% higher expectancy than holding for home runs.
📊 GAP ANALYSIS & FILL PSYCHOLOGY
[b>Gap Definition: [/b>
Price discontinuity between previous close and current open:
• Gap Up : Open > Previous Close + noise threshold (0.1 ATR)
• Gap Down : Open < Previous Close - noise threshold
Why Gaps Matter: [/b>
Gaps represent unfilled orders [/b>. When market gaps up, all limit buy orders between yesterday's close and today's open are never filled. Those buyers are "left behind." Psychology: they wait for price to return ("fill the gap") so they can enter. This creates magnetic pull [/b> toward gap level.
Gap Fill Statistics (Empirical): [/b>
• Gaps <0.5% [/b>: 85-90% fill within same day
• Gaps 0.5-1.0% [/b>: 70-75% fill within same day, 90%+ within week
• Gaps >1.0% [/b>: 50-60% fill within same day (major news often prevents fill)
Gap Fill Strategy: [/b>
Setup 1: Gap-and-Go
Gap opens, extends away from gap (doesn't fill).
• ORB confirms direction away from gap
• Trade WITH ORB breakout direction
• Expectation: Gap won't fill today (momentum too strong)
Setup 2: Gap-Fill Fade
Gap opens, but fails to extend. Price drifts back toward gap.
• ORB breakout TOWARD gap (not away)
• Trade toward gap fill level
• Target: Previous close (gap fill complete)
Setup 3: Gap-Fill Rejection
Gap fills (touches previous close) then rejects.
• ORB breakout AWAY from gap after fill
• Trade away from gap direction
• Thesis: Gap filled (orders executed), now resume original direction
[b>Example: Scenario A (Gap-and-Go):
• ORB breaks upward to $454 (away from gap)
• Trade: LONG breakout, expect continued rally
• Gap becomes support ($452)
Scenario B (Gap-Fill):
• ORB breaks downward through $452.50 (toward gap)
• Trade: SHORT toward gap fill at $450.00
• Target: $450.00 (gap filled), close position
Scenario C (Gap-Fill Rejection):
• Price drifts to $450.00 (gap filled) early in session
• ORB establishes $450-$451 after gap fill
• ORB breaks upward to $451.50
• Trade: LONG breakout (gap is filled, now resume rally)
ORB Fusion Integration: [/b>
Dashboard shows:
• Gap type (Up/Down/None)
• Gap size (percentage)
• Gap fill status (Filled ✓ / Open)
This informs setup confidence:
• ORB breakout AWAY from unfilled gap: +10% confidence (gap becomes support/resistance)
• ORB breakout TOWARD unfilled gap: -10% confidence (gap fill may override ORB)
[b>📈 VWAP & INSTITUTIONAL BIAS [/b>
[b>Volume-Weighted Average Price (VWAP): [/b>
Average price weighted by volume at each price level. Represents true "average" cost for the day.
[b>Calculation: Institutional Benchmark [/b>: Institutions (mutual funds, pension funds) use VWAP as performance benchmark. If they buy above VWAP, they underperformed; below VWAP, they outperformed.
2. [b>Algorithmic Target [/b>: Many algos are programmed to buy below VWAP and sell above VWAP to achieve "fair" execution.
3. [b>Support/Resistance [/b>: VWAP acts as dynamic support (price above) or resistance (price below).
[b>VWAP Bands (Standard Deviations): [/b>
• [b>1σ Band [/b>: VWAP ± 1 standard deviation
- Contains ~68% of volume
- Normal trading range
- Bounces common
• [b>2σ Band [/b>: VWAP ± 2 standard deviations
- Contains ~95% of volume
- Extreme extension
- Mean reversion likely
ORB + VWAP Confluence: [/b>
Highest-probability setups occur when ORB and VWAP align:
Bullish Confluence: [/b>
• ORB breakout upward (bullish signal)
• Price above VWAP (institutional buying)
• Confidence boost: +15%
Bearish Confluence: [/b>
• ORB breakout downward (bearish signal)
• Price below VWAP (institutional selling)
• Confidence boost: +15%
[b>Divergence Warning:
• ORB breakout upward BUT price below VWAP
• Conflict: Breakout says "buy," VWAP says "sell"
• Confidence penalty: -10%
• Interpretation: Retail buying but institutions not participating (lower quality breakout)
📊 MOMENTUM CONTEXT SYSTEM
[b>Innovation: Candle Coloring by Position
Rather than fixed support/resistance lines, ORB Fusion colors candles based on their [b>relationship to ORB :
[b>Three Zones: [/b>
1. Inside ORB (Blue Boxes): [/b>
[b>Calculation:
• Darker blue: Near extremes of ORB (potential breakout imminent)
• Lighter blue: Near ORB mid (consolidation)
[b>Trading: [/b> Coiled spring—await breakout.
[b>2. Above ORB (Green Boxes):
[b>Calculation: 3. Below ORB (Red Boxes):
Mirror of above ORB logic.
[b>Special Contexts: [/b>
[b>Breakout Bar (Darkest Green/Red): [/b>
The specific bar where breakout occurs gets maximum color intensity regardless of distance. This highlights the pivotal moment.
[b>Failed Breakout Bar (Orange/Warning): [/b>
When failed breakout is confirmed, that bar gets orange/warning color. Visual alert: "reversal opportunity here."
[b>Near Extension (Cyan/Magenta Tint): [/b>
When price is within 0.5 ATR of an extension level, candle gets tinted cyan (bull) or magenta (bear). Indicates "target approaching—prepare to take profit."
[b>Why Visual Context? [/b>
Traditional indicators show lines. ORB Fusion shows [b>context-aware momentum [/b>. Glance at chart:
• Lots of blue? Consolidation day (fade extremes).
• Progressive green? Trend day (follow).
• Green then orange? Failed breakout (reversal setup).
This visual language communicates market state instantly—no interpretation needed.
🎯 TRADE SETUP GENERATION & GRADING [/b>
[b>Algorithmic Setup Detection: [/b>
ORB Fusion continuously evaluates market state and generates current best trade setup with:
• Action (LONG / SHORT / FADE HIGH / FADE LOW / WAIT)
• Entry price
• Stop loss
• Three targets
• Risk:Reward ratio
• Confidence score (0-100)
• Grade (A+ to D)
[b>Setup Types: [/b>
[b>1. ORB LONG (Bullish Breakout): [/b>
[b>Trigger: [/b>
• Bullish ORB breakout confirmed
• Not failed
[b>Parameters:
• Entry: Current close
• Stop: ORB mid (protects against failure)
• T1: ORB High + 0.5x range (1.5x extension)
• T2: ORB High + 1.0x range (2.0x extension)
• T3: ORB High + 1.618x range (2.618x extension)
[b>Confidence Scoring:
[b>Trigger: [/b>
• Bearish breakout occurred
• Failed (returned inside ORB)
[b>Parameters: [/b>
• Entry: Close when failure confirmed
• Stop: Extreme low since breakout + 0.10 ATR
• T1: ORB Low + 0.5x range
• T2: ORB Low + 1.0x range (ORB mid)
• T3: ORB Low + 1.5x range
[b>Confidence Scoring:
[b>Trigger:
• Inside ORB
• Close > ORB mid (near high)
[b>Parameters: [/b>
• Entry: ORB High (limit order)
• Stop: ORB High + 0.2x range
• T1: ORB Mid
• T2: ORB Low
[b>Confidence Scoring: [/b>
Base: 40 points (lower base—range fading is lower probability than breakout/reversal)
[b>Use Case: [/b> Rotation days. Not recommended on normal/trend days.
[b>6. FADE LOW (Range Trade):
Mirror of FADE HIGH.
[b>7. WAIT:
[b>Trigger: [/b>
• ORB not complete yet OR
• No clear setup (price in no-man's-land)
[b>Action: [/b> Observe, don't trade.
[b>Confidence: [/b> 0 points
[b>Grading System:
```
Confidence → Grade
85-100 → A+
75-84 → A
65-74 → B+
55-64 → B
45-54 → C
0-44 → D
```
[b>Grade Interpretation: [/b>
• [b>A+ / A: High probability setup. Take these trades.
• [b>B+ / B [/b>: Decent setup. Trade if fits system rules.
• [b>C [/b>: Marginal setup. Only if very experienced.
• [b>D [/b>: Poor setup or no setup. Don't trade.
[b>Example Scenario: [/b>
ES futures:
• ORB: 5842-5850 (8 point range)
• Bullish breakout to 5851 confirmed
• Volume: 2.0x average (confirmed)
• VWAP: 5845 (price above VWAP ✓)
• Day type: Developing (too early, no bonus)
• Gap: None
[b>Setup: [/b>
• Action: LONG
• Entry: 5851
• Stop: 5846 (ORB mid, -5 point risk)
• T1: 5854 (+3 points, 1:0.6 R:R)
• T2: 5858 (+7 points, 1:1.4 R:R)
• T3: 5862.94 (+11.94 points, 1:2.4 R:R)
[b>Confidence: LONG with 55% confidence.
Interpretation: Solid setup, not perfect. Trade it if your system allows B-grade signals.
[b>📊 STATISTICS TRACKING & PERFORMANCE ANALYSIS [/b>
[b>Real-Time Performance Metrics: [/b>
ORB Fusion tracks comprehensive statistics over user-defined lookback (default 50 days):
[b>Breakout Performance: [/b>
• [b>Bull Breakouts: [/b> Total count, wins, losses, win rate
• [b>Bear Breakouts: [/b> Total count, wins, losses, win rate
[b>Win Definition: [/b> Breakout reaches ≥1.0x extension (doubles the opening range) before end of day.
[b>Example: [/b>
• ORB: 5842-5850 (8 points)
• Bull breakout at 5851
• Reaches 5858 (1.0x extension) by close
• Result: WIN
[b>Failed Breakout Performance: [/b>
• [b>Total Failed Breakouts [/b>: Count of breakouts that failed
• [b>Reversal Wins [/b>: Count where reversal trade reached target
• [b>Failed Reversal Win Rate [/b>: Wins / Total Failed
[b>Win Definition for Reversals: [/b>
• Failed bull → reversal short reaches ORB mid
• Failed bear → reversal long reaches ORB mid
[b>Extension Tracking: [/b>
• [b>Average Extension Reached [/b>: Mean of maximum extension achieved across all breakout days
• [b>Max Extension Overall [/b>: Largest extension ever achieved in lookback period
[b>Example: 🎨 THREE DISPLAY MODES
[b>Design Philosophy: [/b>
Not all traders need all features. Beginners want simplicity. Professionals want everything. ORB Fusion adapts.
[b>SIMPLE MODE: [/b>
[b>Shows: [/b>
• Primary ORB levels (High, Mid, Low)
• ORB box
• Breakout signals (triangles)
• Failed breakout signals (crosses)
• Basic dashboard (ORB status, breakout status, setup)
• VWAP
[b>Hides: [/b>
• Session ORBs (Asian, London, NY)
• IB levels and extensions
• ORB extensions beyond basic levels
• Gap analysis visuals
• Statistics dashboard
• Momentum candle coloring
• Narrative dashboard
[b>Use Case: [/b>
• Traders who want clean chart
• Focus on core ORB concept only
• Mobile trading (less screen space)
[b>STANDARD MODE:
[b>Shows Everything in Simple Plus: [/b>
• Session ORBs (Asian, London, NY)
• IB levels (high, low, mid)
• IB extensions
• ORB extensions (1.272x, 1.5x, 1.618x, 2.0x)
• Gap analysis and fill targets
• VWAP bands (1σ and 2σ)
• Momentum candle coloring
• Context section in dashboard
• Narrative dashboard
[b>Hides: [/b>
• Advanced extensions (2.618x, 3.0x)
• Detailed statistics dashboard
[b>Use Case: [/b>
• Most traders
• Balance between information and clarity
• Covers 90% of use cases
[b>ADVANCED MODE:
[b>Shows Everything:
• All session ORBs
• All IB levels and extensions
• All ORB extensions (including 2.618x and 3.0x)
• Full gap analysis
• VWAP with both 1σ and 2σ bands
• Momentum candle coloring
• Complete statistics dashboard
• Narrative dashboard
• All context metrics
[b>Use Case: [/b>
• Professional traders
• System developers
• Those who want maximum information density
[b>Switching Modes: [/b>
Single dropdown input: "Display Mode" → Simple / Standard / Advanced
Entire indicator adapts instantly. No need to toggle 20 individual settings.
📖 NARRATIVE DASHBOARD
[b>Innovation: Plain-English Market State [/b>
Most indicators show data. ORB Fusion explains what the data [b>means [/b>.
[b>Narrative Components: [/b>
[b>1. Phase: [/b>
• "📍 Building ORB..." (during ORB session)
• "📊 Trading Phase" (after ORB complete)
• "⏳ Pre-Market" (before ORB session)
[b>2. Status (Current Observation): [/b>
• "⚠️ Failed breakout - reversal likely"
• "🚀 Bullish momentum in play"
• "📉 Bearish momentum in play"
• "⚖️ Consolidating in range"
• "👀 Monitoring for setup"
[b>3. Next Level:
Tells you what to watch for:
• "🎯 1.5x @ 5854.00" (next extension target)
• "Watch ORB levels" (inside range, await breakout)
[b>4. Setup: [/b>
Current trade setup + grade:
• "LONG " (bullish breakout, A-grade)
• "🔥 SHORT REVERSAL " (failed bull breakout, A+-grade)
• "WAIT " (no setup)
[b>5. Reason: [/b>
Why this setup exists:
• "ORB Bullish Breakout"
• "Failed Bear Breakout - High Probability Reversal"
• "Range Fade - Near High"
[b>6. Tip (Market Insight):
Contextual advice:
• "🔥 TREND DAY - Trail stops" (day type is trending)
• "🔄 ROTATION - Fade extremes" (day type is rotating)
• "📊 Gap unfilled - magnet level" (gap creates target)
• "📈 Normal conditions" (no special context)
[b>Example Narrative:
```
📖 ORB Narrative
━━━━━━━━━━━━━━━━
Phase | 📊 Trading Phase
Status | 🚀 Bullish momentum in play
Next | 🎯 1.5x @ 5854.00
📈 Setup | LONG
Reason | ORB Bullish Breakout
💡 Tip | 🔥 TREND DAY - Trail stops
```
[b>Glance Interpretation: [/b>
"We're in trading phase. Bullish breakout happened (momentum in play). Next target is 1.5x extension at 5854. Current setup is LONG with A-grade. It's a trend day, so trail stops (don't take early profits)."
Complete market state communicated in 6 lines. No interpretation needed.
[b>Why This Matters:
Beginner traders struggle with "So what?" question. Indicators show lines and signals, but what does it mean [/b>? Narrative dashboard bridges this gap.
Professional traders benefit too—rapid context assessment during fast-moving markets. No time to analyze; glance at narrative, get action plan.
🔔 INTELLIGENT ALERT SYSTEM
[b>Four Alert Types: [/b>
[b>1. Breakout Alert: [/b>
[b>Trigger: [/b> ORB breakout confirmed (bull or bear)
[b>Message: [/b>
```
🚀 ORB BULLISH BREAKOUT
Price: 5851.00
Volume Confirmed
Grade: A
```
[b>Frequency: [/b> Once per bar (prevents spam)
[b>2. Failed Breakout Alert: [/b>
[b>Trigger: [/b> Breakout fails, reversal setup generated
[b>Message: [/b>
```
🔥 FAILED BULLISH BREAKOUT!
HIGH PROBABILITY SHORT REVERSAL
Entry: 5848.00
Stop: 5854.00
T1: 5846.00
T2: 5842.00
Historical Win Rate: 73%
```
[b>Why Comprehensive? [/b> Failed breakout alerts include complete trade plan. You can execute immediately from alert—no need to check chart.
[b>3. Extension Alert:
[b>Trigger: [/b> Price reaches extension level for first time
[b>Message: [/b>
```
🎯 Bull Extension 1.5x reached @ 5854.00
```
[b>Use: [/b> Profit-taking reminder. When extension hit, consider scaling out.
[b>4. IB Break Alert: [/b>
[b>Trigger: [/b> Price breaks above IB high or below IB low
[b>Message: [/b>
```
📊 IB HIGH BROKEN - Potential Trend Day
```
[b>Use: [/b> Day type classification. IB break suggests trend day developing—adjust strategy to trend-following mode.
[b>Alert Management: [/b>
Each alert type can be enabled/disabled independently. Prevents notification overload.
[b>Cooldown Logic: [/b>
Alerts won't fire if same alert type triggered within last bar. Prevents:
• "Breakout" alert every tick during choppy breakout
• Multiple "extension" alerts if price oscillates at level
Ensures: One clean alert per event.
⚙️ KEY PARAMETERS EXPLAINED
[b>Opening Range Settings: [/b>
• [b>ORB Timeframe [/b> (5/15/30/60 min): Duration of opening range window
- 30 min recommended for most traders
• [b>Use RTH Only [/b> (ON/OFF): Only trade during regular trading hours
- ON recommended (avoids thin overnight markets)
• [b>Use LTF Precision [/b> (ON/OFF): Sample 1-minute bars for accuracy
- ON recommended (critical for charts >1 minute)
• [b>Precision TF [/b> (1/5 min): Timeframe for LTF sampling
- 1 min recommended (most accurate)
[b>Session ORBs: [/b>
• [b>Show Asian/London/NY ORB [/b> (ON/OFF): Display multi-session ranges
- OFF in Simple mode
- ON in Standard/Advanced if trading 24hr markets
• [b>Session Windows [/b>: Time ranges for each session ORB
- Defaults align with major session opens
[b>Initial Balance: [/b>
• [b>Show IB [/b> (ON/OFF): Display Initial Balance levels
- ON recommended for day type classification
• [b>IB Session Window [/b> (0930-1030): First hour of trading
- Default is standard for US equities
• [b>Show IB Extensions [/b> (ON/OFF): Project IB extension targets
- ON recommended (identifies trend days)
• [b>IB Extensions 1-4 [/b> (0.5x, 1.0x, 1.5x, 2.0x): Extension multipliers
- Defaults are Market Profile standard
[b>ORB Extensions: [/b>
• [b>Show Extensions [/b> (ON/OFF): Project ORB extension targets
- ON recommended (defines profit targets)
• [b>Enable Individual Extensions [/b> (1.272x, 1.5x, 1.618x, 2.0x, 2.618x, 3.0x)
- Enable 1.272x, 1.5x, 1.618x, 2.0x minimum
- Disable 2.618x and 3.0x unless trading very volatile instruments
[b>Breakout Detection:
• [b>Confirmation Method [/b> (Close/Wick/Body):
- Close recommended (best balance)
- Wick for scalping
- Body for conservative
• [b>Require Volume Confirmation [/b> (ON/OFF):
- ON recommended (increases reliability)
• [b>Volume Multiplier [/b> (1.0-3.0):
- 1.5x recommended
- Lower for thin instruments
- Higher for heavy volume instruments
[b>Failed Breakout System: [/b>
• [b>Enable Failed Breakouts [/b> (ON/OFF):
- ON strongly recommended (highest edge)
• [b>Bars to Confirm Failure [/b> (2-10):
- 3 bars recommended
- 2 for aggressive (more signals, more false failures)
- 5+ for conservative (fewer signals, higher quality)
• [b>Failure Buffer [/b> (0.0-0.5 ATR):
- 0.1 ATR recommended
- Filters noise during consolidation near ORB level
• [b>Show Reversal Targets [/b> (ON/OFF):
- ON recommended (visualizes trade plan)
• [b>Reversal Target Mults [/b> (0.5x, 1.0x, 1.5x):
- Defaults are tested values
- Adjust based on average daily range
[b>Gap Analysis:
• [b>Show Gap Analysis [/b> (ON/OFF):
- ON if trading instruments that gap frequently
- OFF for 24hr markets (forex, crypto—no gaps)
• [b>Gap Fill Target [/b> (ON/OFF):
- ON to visualize previous close (gap fill level)
[b>VWAP:
• [b>Show VWAP [/b> (ON/OFF):
- ON recommended (key institutional level)
• [b>Show VWAP Bands [/b> (ON/OFF):
- ON in Standard/Advanced
- OFF in Simple
• [b>Band Multipliers (1.0σ, 2.0σ):
- Defaults are standard
- 1σ = normal range, 2σ = extreme
[b>Day Type: [/b>
• [b>Show Day Type Analysis [/b> (ON/OFF):
- ON recommended (critical for strategy adaptation)
• [b>Trend Day Threshold [/b> (1.0-2.5 IB mult):
- 1.5x recommended
- When price extends >1.5x IB, classifies as Trend Day
[b>Enhanced Visuals:
• [b>Show Momentum Candles [/b> (ON/OFF):
- ON for visual context
- OFF if chart gets too colorful
• [b>Show Gradient Zone Fills [/b> (ON/OFF):
- ON for professional look
- OFF for minimalist chart
• [b>Label Display Mode [/b> (All/Adaptive/Minimal):
- Adaptive recommended (shows nearby labels only)
- All for information density
- Minimal for clean chart
• [b>Label Proximity [/b> (1.0-5.0 ATR):
- 3.0 ATR recommended
- Labels beyond this distance are hidden (Adaptive mode)
[b>🎓 PROFESSIONAL USAGE PROTOCOL [/b>
[b>Phase 1: Learning the System (Week 1) [/b>
[b>Goal: [/b> Understand ORB concepts and dashboard interpretation
[b>Setup: [/b>
• Display Mode: STANDARD
• ORB Timeframe: 30 minutes
• Enable ALL features (IB, extensions, failed breakouts, VWAP, gap analysis)
• Enable statistics tracking
[b>Actions: [/b>
• Paper trade ONLY—no real money
• Observe ORB formation every day (9:30-10:00 AM ET for US markets)
• Note when ORB breakouts occur and if they extend
• Note when breakouts fail and reversals happen
• Watch day type classification evolve during session
• Track statistics—which setups are working?
[b>Key Learning: [/b>
• How often do breakouts reach 1.5x extension? (typically 50-60% of confirmed breakouts)
• How often do breakouts fail? (typically 30-40%)
• Which setup grade (A/B/C) actually performs best? (should see A-grade outperforming)
• What day type produces best results? (trend days favor breakouts, rotation days favor fades)
[b>Phase 2: Parameter Optimization (Week 2) [/b>
[b>Goal: [/b> Tune system to your instrument and timeframe
[b>ORB Timeframe Selection:
• Run 5 days with 15-minute ORB
• Run 5 days with 30-minute ORB
• Compare: Which captures better breakouts on your instrument?
• Typically: 30-minute optimal for most, 15-minute for very liquid (ES, SPY)
[b>Volume Confirmation Testing:
• Run 5 days WITH volume confirmation
• Run 5 days WITHOUT volume confirmation
• Compare: Does volume confirmation increase win rate?
• If win rate improves by >5%: Keep volume confirmation ON
• If no improvement: Turn OFF (avoid missing valid breakouts)
[b>Failed Breakout Bars:
[b>Goal: [/b> Develop personal trading rules based on system signals
[b>Setup Selection Rules: [/b>
Define which setups you'll trade:
• [b>Conservative: [/b> Only A+ and A grades
• [b>Balanced: [/b> A+, A, B+ grades
• [b>Aggressive: [/b> All grades B and above
Test each approach for 5-10 trades, compare results.
[b>Position Sizing by Grade: [/b>
Consider risk-weighting by setup quality:
• A+ grade: 100% position size
• A grade: 75% position size
• B+ grade: 50% position size
• B grade: 25% position size
Example: If max risk is $1000/trade:
• A+ setup: Risk $1000
• A setup: Risk $750
• B+ setup: Risk $500
This matches bet sizing to edge.
[b>Day Type Adaptation: [/b>
Create rules for different day types:
Trend Days:
• Take ALL breakout signals (A/B/C grades)
• Hold for 2.0x extension minimum
• Trail stops aggressively (1.0 ATR trail)
• DON'T fade—reversals unlikely
Rotation Days:
• ONLY take failed breakout reversals
• Ignore initial breakout signals (likely to fail)
• Take profits quickly (0.5x extension)
• Focus on fade setups (Fade High/Fade Low)
Normal Days:
• Take A/A+ breakout signals only
• Take ALL failed breakout reversals (high probability)
• Target 1.0-1.5x extensions
• Partial profit-taking at extensions
Time-of-Day Rules: [/b>
Breakouts at different times have different probabilities:
10:00-10:30 AM (Early Breakout):
• ORB just completed
• Fresh breakout
• Probability: Moderate (50-55% reach 1.0x)
• Strategy: Conservative position sizing
10:30-12:00 PM (Mid-Morning):
• Momentum established
• Volume still healthy
• Probability: High (60-65% reach 1.0x)
• Strategy: Standard position sizing
12:00-2:00 PM (Lunch Doldrums):
• Volume dries up
• Whipsaw risk increases
• Probability: Low (40-45% reach 1.0x)
• Strategy: Avoid new entries OR reduce size 50%
2:00-4:00 PM (Afternoon Session):
• Late-day positioning
• EOD squeezes possible
• Probability: Moderate-High (55-60%)
• Strategy: Watch for IB break—if trending all day, follow
[b>Phase 4: Live Micro-Sizing (Month 2) [/b>
[b>Goal: [/b> Validate paper trading results with minimal risk
[b>Setup: [/b>
• 10-20% of intended full position size
• Take ONLY A+ and A grade setups
• Follow stop loss and targets religiously
[b>Execution: [/b>
• Execute from alerts OR from dashboard setup box
• Entry: Close of signal bar OR next bar market order
• Stop: Use exact stop from setup (don't widen)
• Targets: Scale out at T1/T2/T3 as indicated
[b>Tracking: [/b>
• Log every trade: Entry, Exit, Grade, Outcome, Day Type
• Calculate: Win rate, Average R-multiple, Max consecutive losses
• Compare to paper trading results (should be within 15%)
[b>Red Flags: [/b>
• Win rate <45%: System not suitable for this instrument/timeframe
• Major divergence from paper trading: Execution issues (slippage, late entries, emotional exits)
• Max consecutive losses >8: Hitting rough patch OR market regime changed
[b>Phase 5: Scaling Up (Months 3-6)
[b>Goal: [/b> Gradually increase to full position size
[b>Progression: [/b>
• Month 3: 25-40% size (if micro-sizing profitable)
• Month 4: 40-60% size
• Month 5: 60-80% size
• Month 6: 80-100% size
[b>Milestones Required to Scale Up: [/b>
• Minimum 30 trades at current size
• Win rate ≥48%
• Profit factor ≥1.2
• Max drawdown <20%
• Emotional control (no revenge trading, no FOMO)
[b>Advanced Techniques:
[b>Multi-Timeframe ORB: Assumes first 30-60 minutes establish value. Violation: Market opens after major news, price discovery continues for hours (opening range meaningless).
2. [b>Volume Indicates Conviction: ES, NQ, RTY, SPY, QQQ—high liquidity, clean ORB formation, reliable extensions
• [b>Large-Cap Stocks: AAPL, MSFT, TSLA, NVDA (>$5B market cap, >5M daily volume)
• [b>Liquid Futures: CL (crude oil), GC (gold), 6E (EUR/USD), ZB (bonds)—24hr markets benefit from session ORBs
• [b>Major Forex Pairs: [/b> EUR/USD, GBP/USD, USD/JPY—London/NY session ORBs work well
[b>Performs Poorly On: [/b>
• [b>Illiquid Stocks: <$1M daily volume, wide spreads, gappy price action
• [b>Penny Stocks: [/b> Manipulated, pump-and-dump, no real price discovery
• [b>Low-Volume ETFs: Exotic sector ETFs, leveraged products with thin volume
• [b>Crypto on Sketchy Exchanges: Wash trading, spoofing invalidates volume analysis
• [b>Earnings Days: [/b> ORB completes before earnings release, then completely resets (useless)
• Binary Event Days: FDA approvals, court rulings—discontinuous price action
[b>Known Weaknesses: [/b>
• [b>Slow Starts: ORB doesn't complete until 10:00 AM (30-min ORB). Early morning traders have no signals for 30 minutes. Consider using 15-minute ORB if this is problematic.
• [b>Failure Detection Lag: [/b> Failed breakout requires 3+ bars to confirm. By the time system signals reversal, price may have already moved significantly back inside range. Manual traders watching in real-time can enter earlier.
• [b>Extension Overshoot: [/b> System projects extensions mathematically (1.5x, 2.0x, etc.). Actual moves may stop short (1.3x) or overshoot (2.2x). Extensions are targets, not magnets.
• [b>Day Type Misclassification: [/b> Early in session, day type is "Developing." By the time it's classified definitively (often 11:00 AM+), half the day is over. Strategy adjustments happen late.
• [b>Gap Assumptions: [/b> System assumes gaps want to fill. Strong trend days never fill gaps (gap becomes support/resistance forever). Blindly trading toward gaps can backfire on trend days.
• [b>Volume Data Quality: Forex doesn't have centralized volume (uses tick volume as proxy—less reliable). Crypto volume is often fake (wash trading). Volume confirmation less effective on these instruments.
• [b>Multi-Session Complexity: [/b> When using Asian/London/NY ORBs simultaneously, chart becomes cluttered. Requires discipline to focus on relevant session for current time.
[b>Risk Factors: [/b>
• [b>Opening Gaps: Large gaps (>2%) can create distorted ORBs. Opening range might be unusually wide or narrow, making extensions unreliable.
• [b>Low Volatility Environments:[/b> When VIX <12, opening ranges can be tiny (0.2-0.3%). Extensions are equally tiny. Profit targets don't justify commission/slippage.
• [b>High Volatility Environments:[/b> When VIX >30, opening ranges are huge (2-3%+). Extensions project unrealistic targets. Failed breakouts happen faster (volatility whipsaw).
• [b>Algorithm Dominance:[/b> In heavily algorithmic markets (ES during overnight session), ORB levels can be manipulated—algos pin price to ORB high/low intentionally. Breakouts become stop-runs rather than genuine directional moves.
[b>⚠️ RISK DISCLOSURE[/b>
Trading futures, stocks, options, forex, and cryptocurrencies involves substantial risk of loss and is not suitable for all investors. Opening Range Breakout strategies, while based on sound market structure principles, do not guarantee profits and can result in significant losses.
The ORB Fusion indicator implements professional trading concepts including Opening Range theory, Market Profile Initial Balance analysis, Fibonacci extensions, and failed breakout reversal logic. These methodologies have theoretical foundations but past performance—whether backtested or live—is not indicative of future results.
Opening Range theory assumes the first 30-60 minutes of trading establish a meaningful value area and that breakouts from this range signal directional conviction. This assumption may not hold during:
• Major news events (FOMC, NFP, earnings surprises)
• Market structure changes (circuit breakers, trading halts)
• Low liquidity periods (holidays, early closures)
• Algorithmic manipulation or spoofing
Failed breakout detection relies on patterns of trapped participant behavior. While historically these patterns have shown statistical edges, market conditions change. Institutional algorithms, changing market structure, or regime shifts can reduce or eliminate edges that existed historically.
Initial Balance classification (trend day vs rotation day vs normal day) is a heuristic framework, not a deterministic prediction. Day type can change mid-session. Early classification may prove incorrect as the day develops.
Extension projections (1.272x, 1.5x, 1.618x, 2.0x, etc.) are probabilistic targets derived from Fibonacci ratios and empirical market behavior. They are not "support and resistance levels" that price must reach or respect. Markets can stop short of extensions, overshoot them, or ignore them entirely.
Volume confirmation assumes high volume indicates institutional participation and conviction. In algorithmic markets, volume can be artificially high (HFT activity) or artificially low (dark pools, internalization). Volume is a proxy, not a guarantee of conviction.
LTF precision sampling improves ORB accuracy by using 1-minute bars but introduces additional data dependencies. If 1-minute data is unavailable, inaccurate, or delayed, ORB calculations will be incorrect.
The grading system (A+/A/B+/B/C/D) and confidence scores aggregate multiple factors (volume, VWAP, day type, IB expansion, gap context) into a single assessment. This is a mechanical calculation, not artificial intelligence. The system cannot adapt to unprecedented market conditions or events outside its programmed logic.
Real trading involves slippage, commissions, latency, partial fills, and rejected orders not present in indicator calculations. ORB Fusion generates signals at bar close; actual fills occur with delay. Opening range forms during highest volatility (first 30 minutes)—spreads widen, slippage increases. Execution quality significantly impacts realized results.
Statistics tracking (win rates, extension levels reached, day type distribution) is based on historical bars in your lookback window. If lookback is small (<50 bars) or market regime changed, statistics may not represent future probabilities.
Users must independently validate system performance on their specific instruments, timeframes, and broker execution environment. Paper trade extensively (100+ trades minimum) before risking capital. Start with micro position sizing (5-10% of intended size) for 50+ trades to validate execution quality matches expectations.
Never risk more than you can afford to lose completely. Use proper position sizing (0.5-2% risk per trade maximum). Implement stop losses on every single trade without exception. Understand that most retail traders lose money—sophisticated indicators do not change this fundamental reality. They systematize analysis but cannot eliminate risk.
The developer makes no warranties regarding profitability, suitability, accuracy, reliability, or fitness for any purpose. Users assume full responsibility for all trading decisions, parameter selections, risk management, and outcomes.
By using this indicator, you acknowledge that you have read, understood, and accepted these risk disclosures and limitations, and you accept full responsibility for all trading activity and potential losses.
[b>═══════════════════════════════════════════════════════════════════════════════[/b>
[b>CLOSING STATEMENT[/b>
[b>═══════════════════════════════════════════════════════════════════════════════[/b>
Opening Range Breakout is not a trick. It's a framework. The first 30-60 minutes reveal where participants believe value lies. Breakouts signal directional conviction. Failures signal trapped participants. Extensions define profit targets. Day types dictate strategy. Failed breakouts create the highest-probability reversals.
ORB Fusion doesn't predict the future—it identifies [b>structure[/b>, detects [b>breakouts[/b>, recognizes [b>failures[/b>, and generates [b>probabilistic trade plans[/b> with defined risk and reward.
The edge is not in the opening range itself. The edge is in recognizing when the market respects structure (follow breakouts) versus when it violates structure (fade breakouts). The edge is in detecting failures faster than discretionary traders. The edge is in systematic classification that prevents catastrophic errors—like fading a trend day or holding through rotation.
Most indicators draw lines. ORB Fusion implements a complete institutional trading methodology: Opening Range theory, Market Profile classification, failed breakout intelligence, Fibonacci projections, volume confirmation, gap psychology, and real-time performance tracking.
Whether you're a beginner learning market structure or a professional seeking systematic ORB implementation, this system provides the framework.
"The market's first word is its opening range. Everything after is commentary." — ORB Fusion

AMT Structure: 80% Traverse, PD Levels & nPOCsHere is a clean, professional description formatted for the TradingView description box. It highlights the methodology (AMT/80% Rule), the specific features, and the credits.
Title: AMT Structure: 80% Traverse, PD Levels & nPOCs
Description:
This indicator is a comprehensive toolkit designed for futures traders utilizing Auction Market Theory (AMT) and Volume Profile strategies. It consolidates multiple scripts into a single, unified overlay to declutter your chart while providing essential structural references for the 80% Traverse setup, intraday context, and longer-term auction targets.
Key Features:
1. 80% Rule / Traverse Setup (Chart Champions Logic)
Automated RTH Open Detection: Hardcoded to the 08:30 AM CT Open to ensure accuracy for US Futures (ES/NQ) regardless of your chart's timezone settings.
Value Area Logic: Automatically calculates the Previous Day's Value Area High (VAH), Value Area Low (VAL), and Point of Control (POC).
Setup Detection: If the market opens outside of the previous day's value, the script highlights the Value Area in color (default: Purple), signaling that an 80% traverse (filling the value area) is structurally possible if price re-enters value.
Background Fill: Optional shading between VAH and VAL to clearly visualize the "playing field" for the traverse.
2. Auction Market Theory (AMT) Premarket Levels
Overnight High/Low: Automatically captures the highest and lowest prices traded during the overnight session (17:00 - 08:30 CT).
Breakout Alerts: Includes logic to detect and alert when these overnight levels are broken during the RTH session.
Auto-Cleanup: Lines can be set to auto-delete after a specified time (default: 60 mins into the session) to keep the chart clean after the Initial Balance (IB) period.
3. Structural Reference Levels
Previous Day Levels: Plots Previous Day High, Low, and Equilibrium (Midpoint) as standard reference lines.
Initial Balance (IB): Option to display the First Hour High and Low (08:30 - 09:30 CT) to assess day type (Neutral, Trend, Normal Variation, etc.).
RTH VWAP: An anchored VWAP that resets specifically at the RTH Open (08:30 CT), distinct from the standard 24-hour VWAP.
4. Naked Points of Control (nPOCs)
Multi-Timeframe Tracking: Tracks and plots Naked POCs for Daily, Weekly, and Monthly profiles.
Auto-Cleanup: Lines automatically delete themselves the moment price touches them, ensuring you only see untested levels.
Customization: Toggle each timeframe on/off individually.
Settings & Customization:
Global Offset: Move all text labels to the right with a single setting to prevent price action from obscuring text.
8:30 Open Offset: Independent offset for the Open label to distinguish it from other opening references.
Smart Coloring: Text labels automatically match their corresponding line colors for easy identification.
Modular Toggles: Every section (AMT, VWAP, PD Levels, CCV, nPOCs) can be turned on or off individually to suit your specific trading plan.
Usage: This tool is specifically tuned for ES and NQ futures trading but can be adapted for other instruments. It replaces the need for separate indicators for Overnight Highs/Lows, Previous Day Levels, and Volume Profile targeting.

Options Series - NonOverlay_Technical
⭐ 1. Purpose:
The script is designed to show technical indicators in a non-overlay form using candlestick representations. It combines multiple popular technical analysis tools to gauge the market's bullish or bearish conditions.
⭐ 2. Indicators:
The script uses several indicators across different timeframes: Exponential Moving Averages (EMA) for 5, 20, 50 periods. Simple Moving Average (SMA) for 200 periods. RSI (Relative Strength Index) for momentum. VWAP (Volume Weighted Average Price) for average price evaluation. PSAR (Parabolic SAR) for trend direction. Daily and multi-day (2-day and 3-day) data for broader market context.
⭐ 3. Candlestick Representation:
The script uses color-coded candlesticks to visually represent various indicators and their bullish/bearish states: Green candlesticks for bullish conditions. Red candlesticks for bearish conditions. Neutral/transparent for non-significant conditions.
⭐ 4. Important Conditions:
It calculates bullish and bearish conditions for each indicator: MA20: When the price is above or below the 20-period EMA. RSI: When RSI is above or below 50. VWAP: When the price is above or below the VWAP. PSAR: When the price is above or below the PSAR. 2-day and 3-day Moving Averages: Evaluating the broader trend.
⭐ 5. Bullish vs. Bearish Calculation:
The script sums up bullish and bearish signals to determine the overall market condition: Current_logical_bull: Counts the number of bullish indicators. Current_logical_bear: Counts the number of bearish indicators. The script compares these values to conclude whether the market is more bullish or bearish.
⭐ 6. Visual Plotting:
The script uses plotcandle to display the non-overlay signals at different levels for each condition, stacked vertically from MA20 to PSAR. Additionally, a master candle combines all indicators to show an overall market trend.
⭐ 7. Neon Effect on MA20:
It adds a neon-like effect to the MA20 line, making it visually prominent: A standard plot line with the base color. Two additional neon layers with increasing transparency to enhance the effect.
⭐ 8. Daily Timeframes and Lookahead:
The script fetches daily data using the lookahead feature to get a broader view of the market trend. It tracks the previous day’s and two days' data for comparison.
⭐ 9. Labels and Customization:
The script dynamically adds labels to the chart for the different plotted indicators at the last bar, making it easier to identify which indicator is being represented.
🚀 Conclusion:
The script combines multiple technical indicators, such as EMA, RSI, VWAP, PSAR, and multi-day moving averages, to visually assess bullish and bearish market conditions. It uses color-coded candlesticks to represent each indicator and sums up the signals to determine the overall trend.

RVWAP ENHANCED**Rolling VWAP with Alerts and Markers**
This Pine Script indicator enhances the traditional Rolling VWAP (Relative Volume Weighted Average Price) by adding dynamic features for improved visualization and alerting.
### Features:
1. **Dynamic VWAP Line Coloring**:
- The VWAP line changes color based on the relationship with the closing price:
- **Green** when the price is above the VWAP.
- **Red** when the price is below the VWAP.
2. **Candle and Background Coloring**:
- **Candles**: Colored green if the close is above the VWAP and red if below.
- **Background**: Subtle green or red shading indicates the price’s position relative to the VWAP.
3. **Alerts**:
- Alerts notify users when the VWAP changes direction:
- "VWAP Turned Green" for price crossing above the VWAP.
- "VWAP Turned Red" for price crossing below the VWAP.
4. **Small Dot Markers**:
- Tiny dots are plotted below the candles to mark VWAP state changes:
- **Green dot** for VWAP turning green.
- **Red dot** for VWAP turning red.
5. **Custom Time Period**:
- Users can select either a dynamic time period based on the chart's timeframe or a fixed time period (customizable in days, hours, and minutes).
6. **Standard Deviation Bands (Optional)**:
- Standard deviation bands around the VWAP can be enabled for further analysis.
This script is designed to provide clear and actionable insights into market trends using the RVWAP, making it an excellent tool for traders who rely on volume-based price action analysis.
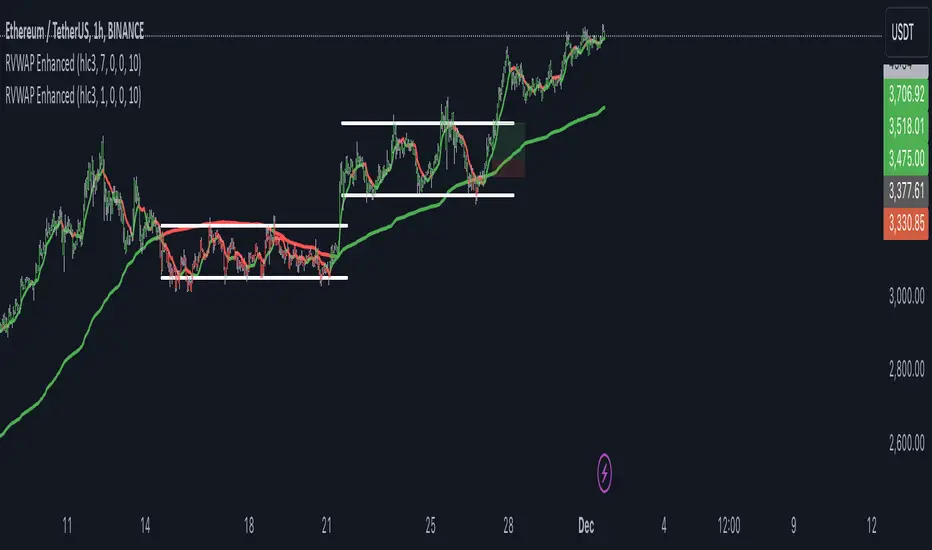
MA Study: Different Types and More [NeoButane]A study of moving averages that utilizes different tricks I've learned to optimize them. Included is Bollinger Bands, Guppy (GMMA) and Super Guppy.
The method used to make it MtF should be more precise and smoother than regular MtF methods that use the security function. For intraday timeframes, each number represents each hour, with 24 equal to 1 day. For daily, 3 is 3 day, for weekly, 4 is the 4 weekly, etc. If you're on a higher timeframe than the one selected, the length will not change.
Log-space is used to make calculations work on many cryptos. The rules for color changing Guppy is changed to make it not as choppy on MAs other than EMA. Note that length does not affect SWMA and VWAP and source does not affect VWAP.
A short summary of each moving average can be found here: medium.com
List of included MAs:
ALMA: Arnaud Legoux
Double EMA
EMA: Exponential
Hull MA
KAMA: Kaufman Adaptive
Linear Regression Curve
LSMA: Least Squares
SMA: Simple
SMMA/RMA: Smoothed/Running
SWMA: Symm. Weighted
TMA: Triangular
Triple EMA
VWMA: Volume Weighted
WMA: Weighted
ZLEMA: Zero Lag
VWAP: Vol Weighted Average
Welles Wilder MA

True Liquidity BlocksSo basically I've been deep diving into liquidity trading concepts similar to ICT (Inner Circle Trader) and developed an indicator that breaks down market movement through a volume-centric lens.
Key Concept:
Markets move not just by price, but by resolving trapped positions
Volume segments, not time intervals, show true market dynamics
VWAP (Volume Weighted Average Price) becomes a key structural reference
What Makes This Different:
Tracks volume segments instead of fixed time frames
Identifies "trapped" trader positions
Measures liquidity level efficiency
Color-codes bars based on nearest liquidity zone
Indicator Features:
Cyan/Red liquidity levels showing buy/sell pressure
Efficiency tracking for each level
Dynamic volume-based segmentation
Bar coloring to show nearest liquidity zone
Theoretical Inspiration: Viewed markets as energy systems where:
Positions create potential energy
Price movement resolves this energy
Trends form through systematic position liquidation
VWAP Recalculation in Each Segment:
Segment Start:
VWAP resets when volume threshold User Inputtable (600,000) is reached
Uses the last 4 price values (High, Low, Close, Close) for calculation
Weighted by volume traded during that segment
Calculation Method:
pineCopy = ta.vwap(hlcc4, na(segment_start) ? true : na, 1)
hlcc4: Combines high, low, close prices
na(segment_start): Ensures reset at new segment
Weighted by volume, not equal time intervals
Key Points:
Dynamic recalculation each segment
Reflects most recent trading activity
Provides real-time fair price reference
Tracks positioning
Essentially, VWAP resets and recalculates with each new volume segment, creating a rolling, volume-weighted average price that maps trader positioning.
BSL (Buy Side Liquidity) and SSL (Sell Side Liquidity) Explained:
When a volume segment closes relative to VWAP, it creates natural positioning traps:
BSL (Cyan) - Created when price closes BELOW THAT SEGMENT'S VWAP:
Bulls are positioned BELOW VWAP (trapped)
Shorts are positioned ABOVE VWAP (In Profit)
SSL (Red) - Created when price closes ABOVE THAT SEGMENT"S VWAP:
Bulls are positioned ABOVE VWAP (trapped)
Shorts are positioned BELOW VWAP (trapped)
Core Mechanism:
VWAP acts as a reference point for trader positioning
Trapped positions create inherent market tension
Levels expand to show accumulating pressure
Color-coded for quick identification of potential move direction
The goal: Visualize where traders are likely "stuck" and must eventually resolve their positions or liquidate other's, driving market movement.
It was just a fun experiment but If ya'll have any thoughts on it or what I could do to improve it, I would appreciate it.
Just a little note, It's optimized for futures, but if u uncheck the "Rest at Futures Open ?" setting, it allow full reign of any asset with volume data.

AI Trend Navigator [K-Neighbor]█ Overview
In the evolving landscape of trading and investment, the demand for sophisticated and reliable tools is ever-growing. The AI Trend Navigator is an indicator designed to meet this demand, providing valuable insights into market trends and potential future price movements. The AI Trend Navigator indicator is designed to predict market trends using the k-Nearest Neighbors (KNN) classifier.
By intelligently analyzing recent price actions and emphasizing similar values, it helps traders to navigate complex market conditions with confidence. It provides an advanced way to analyze trends, offering potentially more accurate predictions compared to simpler trend-following methods.
█ Calculations
KNN Moving Average Calculation: The core of the algorithm is a KNN Moving Average that computes the mean of the 'k' closest values to a target within a specified window size. It does this by iterating through the window, calculating the absolute differences between the target and each value, and then finding the mean of the closest values. The target and value are selected based on user preferences (e.g., using the VWAP or Volatility as a target).
KNN Classifier Function: This function applies the k-nearest neighbor algorithm to classify the price action into positive, negative, or neutral trends. It looks at the nearest 'k' bars, calculates the Euclidean distance between them, and categorizes them based on the relative movement. It then returns the prediction based on the highest count of positive, negative, or neutral categories.
█ How to use
Traders can use this indicator to identify potential trend directions in different markets.
Spotting Trends: Traders can use the KNN Moving Average to identify the underlying trend of an asset. By focusing on the k closest values, this component of the indicator offers a clearer view of the trend direction, filtering out market noise.
Trend Confirmation: The KNN Classifier component can confirm existing trends by predicting the future price direction. By aligning predictions with current trends, traders can gain more confidence in their trading decisions.
█ Settings
PriceValue: This determines the type of price input used for distance calculation in the KNN algorithm.
hl2: Uses the average of the high and low prices.
VWAP: Uses the Volume Weighted Average Price.
VWAP: Uses the Volume Weighted Average Price.
Effect: Changing this input will modify the reference values used in the KNN classification, potentially altering the predictions.
TargetValue: This sets the target variable that the KNN classification will attempt to predict.
Price Action: Uses the moving average of the closing price.
VWAP: Uses the Volume Weighted Average Price.
Volatility: Uses the Average True Range (ATR).
Effect: Selecting different targets will affect what the KNN is trying to predict, altering the nature and intent of the predictions.
Number of Closest Values: Defines how many closest values will be considered when calculating the mean for the KNN Moving Average.
Effect: Increasing this value makes the algorithm consider more nearest neighbors, smoothing the indicator and potentially making it less reactive. Decreasing this value may make the indicator more sensitive but possibly more prone to noise.
Neighbors: This sets the number of neighbors that will be considered for the KNN Classifier part of the algorithm.
Effect: Adjusting the number of neighbors affects the sensitivity and smoothness of the KNN classifier.
Smoothing Period: Defines the smoothing period for the moving average used in the KNN classifier.
Effect: Increasing this value would make the KNN Moving Average smoother, potentially reducing noise. Decreasing it would make the indicator more reactive but possibly more prone to false signals.
█ What is K-Nearest Neighbors (K-NN) algorithm?
At its core, the K-NN algorithm recognizes patterns within market data and analyzes the relationships and similarities between data points. By considering the 'K' most similar instances (or neighbors) within a dataset, it predicts future price movements based on historical trends. The K-Nearest Neighbors (K-NN) algorithm is a type of instance-based or non-generalizing learning. While K-NN is considered a relatively simple machine-learning technique, it falls under the AI umbrella.
We can classify the K-Nearest Neighbors (K-NN) algorithm as a form of artificial intelligence (AI), and here's why:
Machine Learning Component: K-NN is a type of machine learning algorithm, and machine learning is a subset of AI. Machine learning is about building algorithms that allow computers to learn from and make predictions or decisions based on data. Since K-NN falls under this category, it is aligned with the principles of AI.
Instance-Based Learning: K-NN is an instance-based learning algorithm. This means that it makes decisions based on the entire training dataset rather than deriving a discriminative function from the dataset. It looks at the 'K' most similar instances (neighbors) when making a prediction, hence adapting to new information if the dataset changes. This adaptability is a hallmark of intelligent systems.
Pattern Recognition: The core of K-NN's functionality is recognizing patterns within data. It identifies relationships and similarities between data points, something akin to human pattern recognition, a key aspect of intelligence.
Classification and Regression: K-NN can be used for both classification and regression tasks, two fundamental problems in machine learning and AI. The indicator code is used for trend classification, a predictive task that aligns with the goals of AI.
Simplicity Doesn't Exclude AI: While K-NN is often considered a simpler algorithm compared to deep learning models, simplicity does not exclude something from being AI. Many AI systems are built on simple rules and can be combined or scaled to create complex behavior.
No Explicit Model Building: Unlike traditional statistical methods, K-NN does not build an explicit model during training. Instead, it waits until a prediction is required and then looks at the 'K' nearest neighbors from the training data to make that prediction. This lazy learning approach is another aspect of machine learning, part of the broader AI field.
-----------------
Disclaimer
The information contained in my Scripts/Indicators/Ideas/Algos/Systems does not constitute financial advice or a solicitation to buy or sell any securities of any type. I will not accept liability for any loss or damage, including without limitation any loss of profit, which may arise directly or indirectly from the use of or reliance on such information.
All investments involve risk, and the past performance of a security, industry, sector, market, financial product, trading strategy, backtest, or individual's trading does not guarantee future results or returns. Investors are fully responsible for any investment decisions they make. Such decisions should be based solely on an evaluation of their financial circumstances, investment objectives, risk tolerance, and liquidity needs.
My Scripts/Indicators/Ideas/Algos/Systems are only for educational purposes!

Daily AVWAPsDaily AVWAPs is designed for intraday and swing traders who track institutional volume benchmarks. Instead of a single "rolling" line that resets continuously, this indicator identifies the starting timestamp of the last 5 trading sessions and draws five distinct Anchored VWAPs from those exact moments.
This allows traders to see exactly where the average volume-weighted price stands for the current day (1D), yesterday (2D), and the three days prior (3D, 4D, 5D) simultaneously.
Key Features
Polyline Visualization: Unlike standard indicators that plot historical values for every bar (creating a messy "sawtooth" effect), this script uses Pine Script Polylines. It draws clean, static lines starting from the specific anchor point to the present price, mimicking the manual "Anchored VWAP" drawing tool.
Dynamic Session Detection: The script contains zero hardcoded dates. It automatically detects when a new trading day begins based on the chart data. It works seamlessly across all asset classes (Stocks, Crypto, Futures) and automatically adjusts for weekends, holidays, and irregular trading weeks without manual updates.
Unified Color Control: Input colors are synchronized. Changing a color in the settings menu updates both the chart line and the price scale label instantly.
Toggle Controls: Individual checkboxes allow you to toggle any specific VWAP (1D through 5D) on or off to keep your chart clean.
How to Use
Trend Strength: When the 1D, 2D, and 3D VWAPs are "fanning out" in alignment, the trend is strong.
Mean Reversion: In a sideways market, price often gravitates back to the 5-Day VWAP as a "value area."
Support & Resistance: Watch for price to respect the VWAP of a previous high-volume day (e.g., bouncing off the 3D VWAP during a pullback).
Settings
Source: Select the price data source (default is OHLC4) .
Colors & Toggles: Use the checkboxes to enable/disable specific lines. Customize the color for each specific day's AVWAP directly in the Inputs tab.
This indicator was adapted and repurposed from the original work by The_Last_Gentleman .
Technical Note: This indicator is optimized for intraday timeframes (1m, 5m, 15m, 1H). Because it uses polyline and array logic to scan specific session timestamps, it calculates exclusively on the most recent bar to maintain high performance.
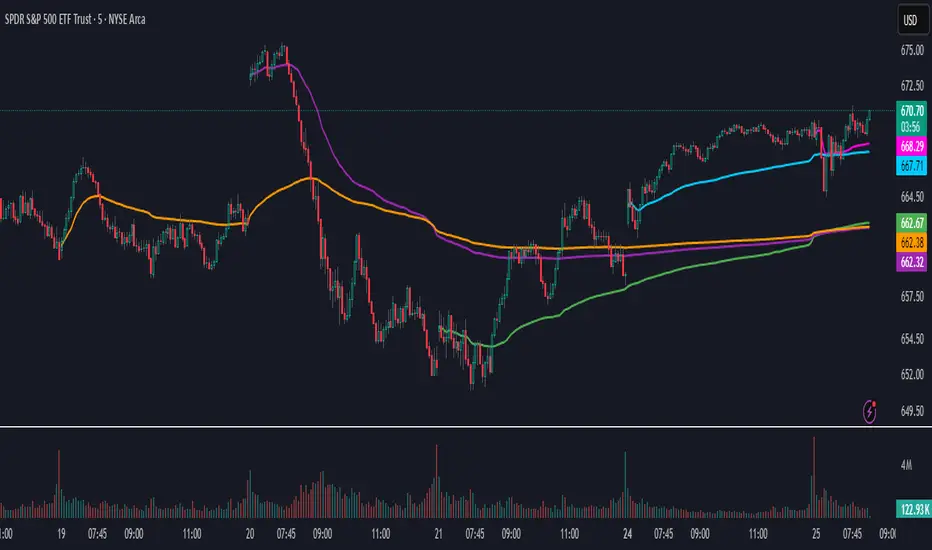
Day Trader Trend & Triggers + Mini-Meter — v6**Day Trader Trend & Triggers — Intraday**
A fast, intraday trend and entry tool designed for **1m–15m charts**. It identifies **strong up/down trends** using:
* **MA ribbon:** EMA9 > EMA21 > EMA50 (or inverse) for directional bias.
* **Momentum:** RSI(50-line) and MACD histogram flips.
* **Volume & VWAP:** only confirms when volume expands above SMA(20) and price is above/below VWAP.
* **Higher-TF bias filter (optional):** e.g., align 1m/5m signals with the 15m trend.
When all align, the background highlights and the mini-meter shows UP/DOWN.
It also plots **entries**:
* **Pullbacks** to EMA21/EMA50 with a MACD re-cross,
* **Breakouts** of recent highs/lows on strong volume.
Built-in **alerts** for trend flips, pullbacks, and breakouts let you trade hands-off.
Best used on **5m for active day trades**, with 1m/3m for scalping and 15m for cleaner intraday swings.
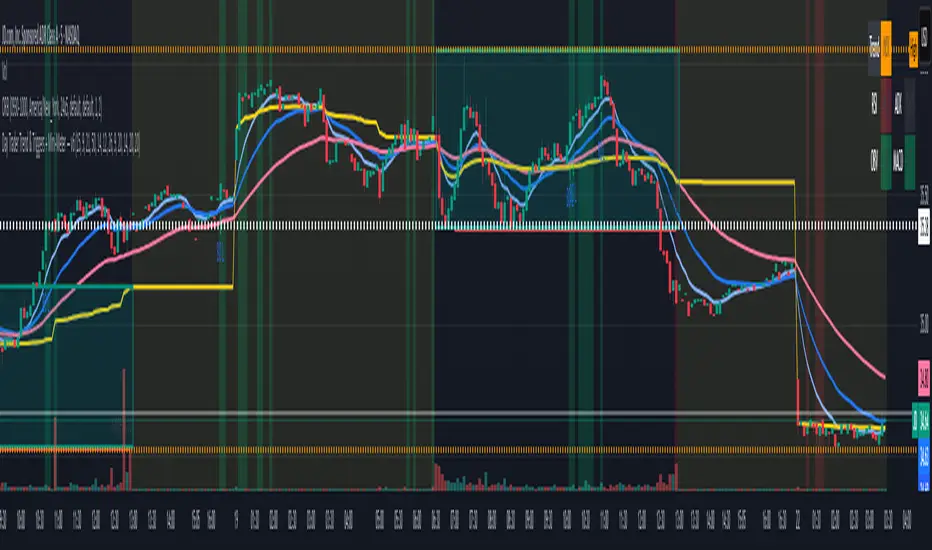
Day Trader Trend & Triggers — v6**Day Trader Trend & Triggers — Intraday**
A fast, intraday trend and entry tool designed for **1m–15m charts**. It identifies **strong up/down trends** using:
* **MA ribbon:** EMA9 > EMA21 > EMA50 (or inverse) for directional bias.
* **Momentum:** RSI(50-line) and MACD histogram flips.
* **Volume & VWAP:** only confirms when volume expands above SMA(20) and price is above/below VWAP.
* **Higher-TF bias filter (optional):** e.g., align 1m/5m signals with the 15m trend.
When all align, the background highlights and the mini-meter shows UP/DOWN.
It also plots **entries**:
* **Pullbacks** to EMA21/EMA50 with a MACD re-cross,
* **Breakouts** of recent highs/lows on strong volume.
Built-in **alerts** for trend flips, pullbacks, and breakouts let you trade hands-off.
Best used on **5m for active day trades**, with 1m/3m for scalping and 15m for cleaner intraday swings.
