HYE Trend Hunter [Indicator]*** İndikatörün Türkçe ve İngilizce açıklaması aşağıya eklenmiştir.
HYE Trend Hunter
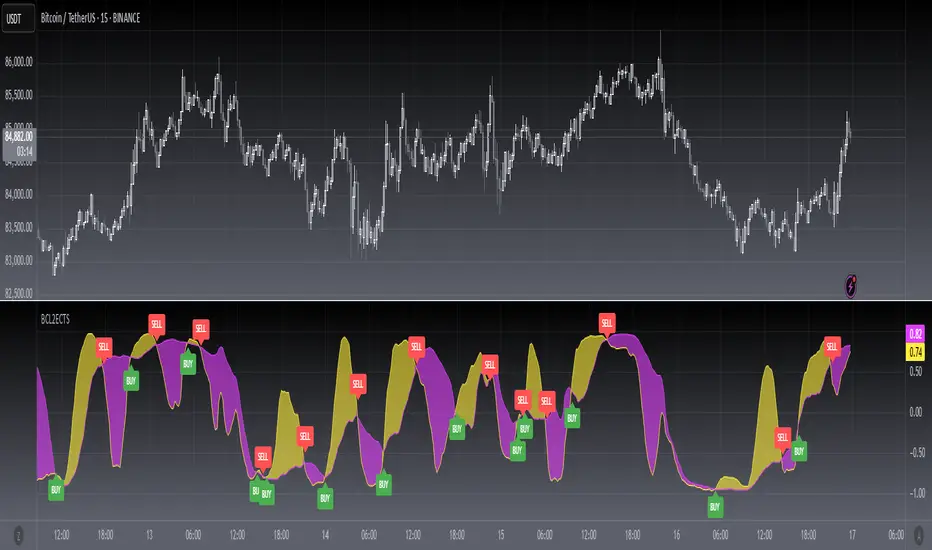
In this indicator, two of the most basic data (price and volume) necessary for detecting trends as early as possible and entering the trade on time are used. In this context, the approaches of some classical and new generation indicators using price and volume have been taken into account.
The indicator is prepared to generate buy signals only. The following steps were followed to generate the buy and exit signals.
1-) First of all, the two most basic data of the indicator, “slow leading line” and “fast leading line” need to be calculated. For this, we use the formula of the “senkou span A” line of the indicator known as the Ichimoku Cloud. We also need to calculate lines known as tenkan sen and kijun sen in ichimoku because they are used in the calculation of this formula.
The high and low values of the candles are taken into account when calculating the Tenkansen, Kijunsen and Senkou Span A lines in the Ichimoku cloud. In this indicator, the highest and lowest values of the periodic VWAP are taken into account when calculating the "slow leading line" and "fast leading line". (The periodic vwap formula was coded and made available by @neolao on tradingviev). Also, in the ichimoku cloud, while the Senkou Span A line is plotted 26 periods into the future, we consider the values of the fast and slow leading lines in the last candle in this indicator.
ORIGINAL ICHIMOKU SPAN A FORMULA
Tenkansen = (Highest high of the last 9 candles + Lowest low of the last 9 candles) / 2
Kijunsen = (Highest high of the last 26 candles + Lowest low of the last 26 candles) / 2
Senkou Span A = Tenkansen + Kijunsen / 2
HYE TREND HUNTER SPAN A FORMULA*
Tenkansen = (Highest VWAP of the last 9 candles + Lowest VWAP of the last 9 candles) / 2
Kijunsen = (Highest VWAP of the last 26 candles + Lowest VWAP of the last 26 candles) / 2
Senkou Span A = Tenkansen + Kijunsen / 2
* We use the original ichimoku values 9 and 26 for the slow line, and 5 and 13 for the fast line. These settings can be changed from the indicator settings.
2-) At this stage, we have 2 lines that we obtained by using the formula of the ichimoku cloud, one of the most classical trend indicators, and by including the volume-weighted average price.
a-) Fast Leading Line (5-13)
b-) Slow Leading Line (9-26)
For the calculation we will do soon, we get a new value by taking the average of these two lines. Using this value, which is the average of the fast and slow leading lines, we plot the Bollinger Bands indicator, which is known as one of the most classic volatility indicators of technical analysis. Thus, we are trying to understand whether there is a volatility change in the market, which may mean the presence of a trend start. We will use this data in the calculation of buy-sell signals.
In the classical Bollinger Bands calculation, the standard deviation is calculated by applying a multiplier at the rate determined by the user (2 is used in the original settings) to the moving average calculated with the “closing price”, and this value is added or subtracted from the moving average and upper band and lower band lines are drawn.
In the HYE Trend Hunter indicator, instead of the moving average calculated with the closing price in the Bollinger Band calculation, we consider the average of the fast and slow leading lines calculated in the 1st step and draw the Bollinger upper and lower bands accordingly. We use the values of 2 and 20 as the standard deviation and period, as in the original settings. These settings can also be changed from the indicator settings.
3-) At this stage, we have fast and slow leading lines trying to understand the trend direction using VWAP, and Bollinger lower and upper bands calculated by the average of these lines.
In this step, we will use another tool that will help us understand whether the invested market (forex, crypto, stocks) is gaining momentum in volume. The Time Segmented Volume indicator was created by the Worden Brothers Inc. and coded by @liw0 and @vitelot on tradingview. The TSV indicator segments the price and volume of an investment instrument according to certain time periods and makes calculations on comparing these price and volume data to reveal the buying and selling periods.
To trade in the buy direction on the HYE Trend Hunter indicator, we look for the TSV indicator to be above 0 and above its exponential moving average value. TSV period and exponential moving average period settings (13 and 7) can also be changed in the indicator settings.
BUY SIGNAL
1-) Fast Leading Line value should be higher than the Fast Leading Line value in the previous candle.
2-) Slow Leading Line value should be higher than the Slow Leading Line value in the previous candle.
3-) Candle Closing value must be higher than the Upper Bollinger Band.
4-) TSV value must be greater than 0.
5-) TSV value must be greater than TSVEMA value.
EXIT SIGNAL
1-) Fast Leading Line value should be lower than the Fast Leading Line value in the previous candle.
2-) Slow Leading Line value should be lower than the Slow Leading Line value in the previous candle.
TIPS AND WARNINGS
1-) The standard settings of the indicator work better in higher timeframes (4-hour, daily, etc.). For lower timeframes, you should change the indicator settings and find the best value for yourself.
2-) All lines (fast and slow leading lines and Bollinger bands) except TSV are displayed on the indicator. For a simpler view, you can hide these lines in the indicator settings.
3-) You can see the color changes of the fast and slow leading lines as well as you can specify a single color for these lines in the Indicator settings.
4-) Alarms have been added for Buy and Exit. When setting up the alarm, you should set it to be triggered at "every bar close". Otherwise it may repaint. There is no repaint after the candle closes.
5-) It is an indicator for educational and experimental purposes. It cannot be considered as investment advice. You should be careful and make your own risk assessment when opening real market trades using this indicator.
_______________________________________________
HYE Trend Avcısı
Bu indikatörde, trendlerin olabildiğince erken tespit edilebilmesi ve zamanında işleme girilebilmesi için gerekli olan en temel iki veriden (fiyat ve hacim) yararlanılmaktadır. Bu kapsamda, fiyat ve hacim kullanan bazı klasik ve yeni nesil indikatörlerin yaklaşımları dikkate alınmıştır.
İndikatör yalnızca alış yönlü sinyaller üretecek şekilde hazırlanmıştır. Alış ve çıkış sinyallerinin üretilmesi için aşağıdaki adımlar izlenmiştir.
1-) Öncelikle, indikatörün en temel iki verisi olan “yavaş öncü çizgi” ve “hızlı öncü çizgi” hesaplamasının yapılması gerekiyor. Bunun için de Ichimoku Bulutu olarak bilinen indikatörün “senkou span A” çizgisinin formülünü kullanıyoruz. Bu formülün hesaplamasında kullanılmaları nedeniyle ichimoku’da tenkan sen ve kijun sen olarak bilinen çizgileri de hesaplamamız gerekiyor.
Ichimoku bulutunda Tenkansen, Kijunsen ve Senkou Span A çizgileri hesaplanırken mumların yüksek ve düşük değerleri dikkate alınıyor. Bu indikatörde ise “yavaş öncü çizgi” ve “hızlı öncü çizgi” hesaplanırken periyodik VWAP’ın en yüksek ve en düşük değerleri dikkate alınıyor. (Periyodik vwap formülü, tradingviev’de @neolao tarafından kodlanmış ve kullanıma açılmış). Ayrıca, ichimoku bulutunda Senkou Span A çizgisi geleceğe yönelik çizilirken (26 mum ileriye dönük) biz bu indikatörde öncü çizgilerin son mumdaki değerlerini dikkate alıyoruz.
ORJİNAL ICHIMOKU SPAN A FORMÜLÜ
Tenkansen = (Son 9 mumun en yüksek değeri + Son 9 mumun en düşük değeri) / 2
Kijunsen = (Son 26 mumun en yüksek değeri + Son 26 mumun en düşük değeri) / 2
Senkou Span A = Tenkansen + Kijunsen / 2
HYE TREND HUNTER SPAN A FORMÜLÜ*
Tenkansen = (Son 9 mumun en yüksek VWAP değeri + Son 9 mumun en düşük VWAP değeri) / 2
Kijunsen = (Son 26 mumun en yüksek VWAP değeri + Son 26 mumun en düşük VWAP değeri) / 2
Senkou Span A = Tenkansen + Kijunsen / 2
* Yavaş çizgi için orijinal ichimoku değerleri olan 9 ve 26’yı kullanırken, hızlı çizgi için 5 ve 13’ü kullanıyoruz. Bu ayarlar, indikatör ayarlarından değiştirilebiliyor.
2-) Bu aşamada, elimizde en klasik trend indikatörlerinden birisi olan ichimoku bulutunun formülünden faydalanarak, işin içinde hacim ağırlıklı ortalama fiyatı da sokmak suretiyle elde ettiğimiz 2 çizgimiz var.
a-) Hızlı Öncü Çizgi (5-13)
b-) Yavaş Öncü Çizgi (9-26)
Birazdan yapacağımız hesaplama için bu iki çizginin de ortalamasını alarak yeni bir değer elde ediyoruz. Hızlı ve yavaş öncü çizgilerin ortalaması olan bu değeri kullanarak, teknik analizin en klasik volatilite indikatörlerinden birisi olarak bilinen Bollinger Bantları indikatörünü çizdiriyoruz. Böylelikle piyasada bir trend başlangıcının varlığı anlamına gelebilecek volatilite değişikliği var mı yok mu anlamaya çalışıyoruz. Bu veriyi al-sat sinyallerinin hesaplamasında kullanacağız.
Klasik Bollinger Bantları hesaplamasında, “kapanış fiyatıyla” hesaplanan hareketli ortalamaya, kullanıcı olarak belirlenen oranda (orijinal ayarlarında 2 kullanılır) bir çarpan uygulanarak standart sapma hesaplanıyor ve bu değer hareketli ortalamaya eklenip çıkartılarak üst bant ve alt bant çizgileri çiziliyor.
HYE Trend Avcısı indikatöründe, Bollinger Bandı hesaplamasında kapanış fiyatıyla hesaplanan hareketli ortalama yerine, 1. adımda hesapladığımız hızlı ve yavaş öncü çizgilerin ortalamasını dikkate alıyoruz ve buna göre bollinger üst ve alt bantlarını çizdiriyoruz. Standart sapma ve periyot olarak yine orijinal ayarlarında olduğu gibi 2 ve 20 değerlerini kullanıyoruz. Bu ayarlar da indikatör ayarlarından değiştirilebiliyor.
3-) Bu aşamada, elimizde VWAP kullanarak trend yönünü anlamaya çalışan hızlı ve yavaş öncü çizgilerimiz ile bu çizgilerin ortalaması ile hesaplanan bollinger alt ve üst bantlarımız var.
Bu adımda, yatırım yapılan piyasanın (forex, kripto, hisse senedi) hacimsel olarak ivme kazanıp kazanmadığını anlamamıza yarayacak bir araç daha kullanacağız. Time Segmented Volume indikatörü, Worden Kardeşler şirketi tarafından oluşturulmuş ve tradingview’de @liw0 ve @vitelot tarafından kodlanarak kullanıma açılmış. TSV indikatörü, bir yatırım aracının fiyatını ve hacmini belirli zaman aralıklarına göre bölümlere ayırarak, bu fiyat ve hacim verilerini, alış ve satış dönemlerini ortaya çıkarmak için karşılaştırmak üzerine hesaplamalar yapar.
HYE Trend Avcısı indikatöründe alış yönünde işlem yapmak için, TSV indikatörünün 0’ın üzerinde olmasını ve kendi üstel hareketli ortalama değerinin üzerinde olmasını arıyoruz. TSV periyodu ve üstel hareketli ortalama periyodu ayarları da (13 ve 7) indikatör ayarlarından değiştirilebiliyor.
ALIŞ SİNYALİ
1-) Hızlı Öncü Çizgi değeri bir önceki mumdaki Hızlı Öncü Çizgi değerinden yüksek olmalı.
2-) Yavaş Öncü Çizgi değeri bir önceki mumdaki Yavaş Öncü Çizgi değerinden yüksek olmalı.
3-) Kapanış Değeri, Üst Bollinger Bandı değerinden yüksek olmalı.
4-) TSV değeri 0’dan büyük olmalı.
5-) TSV değeri TSVEMA değerinden büyük olmalı.
ÇIKIŞ SİNYALİ
1-) Hızlı Öncü Çizgi değeri bir önceki mumdaki Hızlı Öncü Çizgi değerinden düşük olmalı.
2-) Yavaş Öncü Çizgi değeri bir önceki mumdaki Yavaş Öncü Çizgi değerinden düşük olmalı.
İPUÇLARI VE UYARILAR
1-) İndikatörün standart ayarları, yüksek zaman dilimlerinde (4 saatlik, günlük vs.) daha iyi çalışıyor. Düşük zaman dilimleri için indikatör ayarlarını değiştirmeli ve kendiniz için en iyi değeri bulmalısınız.
2-) İndikatörde tüm çizgiler (hızlı ve yavaş öncü çizgiler ile bollinger bantları) -TSV dışında- açık olarak gelmektedir. Daha sade bir görüntü için bu çizgilerin görünürlüğünü indikatör ayarlarından gizleyebilirsiniz.
3-) Hızlı ve yavaş öncü çizgilerin renk değişimlerini görebileceğiniz gibi bu çizgiler için tek bir renk olarak da İndikatör ayarlarında belirleme yapabilirsiniz.
4-) Alış ve Çıkış için alarmlar eklenmiştir. Alarm kurulumu yaparken “Her çubuk kapanışında” tetiklenecek şekilde ayarlama yapmalısınız. Aksi takdirde repaint yapabilir. Mum kapanışından sonra repaint söz konusu değildir.
5-) Eğitim ve deneysel amaçlı bir indikatördür. Yatırım tavsiyesi olarak değerlendirilemez. Bu indikatörü kullanarak gerçek piyasa işlem açarken dikkatli olmalı ve kendi risk değerlendirmenizi yapmalısınız.
ค้นหาในสคริปต์สำหรับ "trend"

34ema trend channelFirst of all, thanks to the first designer of this indicator, I just made some modifications to this favorite indicator.Please forgive me for my limited English!
First of all, I would like to say that the modification of King EMA index has given me a new trading experience. Four moving averages can be used for indicators, but I only used two because I think two are enough. These two moving averages are 34ema's high and low, which form a trend channel. When this channel runs downward, it is short trend; when the channel runs upward, it is long trend; when the channel runs horizontally, it is shock trend.
In fact, let's explain the presentation of AUD chart on the left。
1sell is the beginning of the downward trend. When we see the beginning of the trend, the shape of the K-line is a 4-hour downward trend, so we need to observe whether there is a short opportunity when the price rebounds to 2sell. The second is 3Sell and 4sell. They all have one thing in common, that is, they all have one or two k-lines falling and breaking a new low. At this point, when we go to observe the moving average channel, we find that it has become a short trend.
When the card short trend, we need to do is to follow the market to trade. Sell at high prices. When the price does not reach a new low after 6sell, we should be alert because the low point is rising. When 1buy breaks through 6sell, the high point needs to pay attention to whether the trend has changed,
So how to confirm whether the trend has changed from short to long? We can see that when 2buy stepped back on the moving average channel, there was a buying reaction, which is a good confirmation signal. And 2buy-5buy are all low points rising. When 6buy appears, the price rises rapidly and becomes a bigger bull market. That's the power of trends. Specific operation I can explain in Chinese, foreign friends hope to be able to translate and understand.
Now let's talk about how to set indicators.
After opening the indicators, we can see that the first line to the fourth line is the display and hiding of the moving average. I only choose to check direction and dragging direction, which are the channel moving average. They are also the more useful moving average channels for large-scale trend trading.
Then comes the volatility zone, which is the choice of colors in the moving average channel. You can choose the color you like. So what I see in the chart is that I only checked the three options of direction lagging direction vvolatility zone, and set their colors.
首先我想说的是感谢这个指标最初的设计者提供了源码,我只是针对指标的修改,使我获得了一种新的交易体验。指标是可以使用4条均线的,但我其实只用了两条,因为我觉得两条就够用了。这两条均线就是34EMA的HIGH和LOW,这两条均线组成了一条趋势渠道,当这条通道向下运行时为空头趋势,当通道向上运行时为多头趋势,当通道横向运行时为震荡趋势。
其实,我们对于左侧AUD图表的演示作一个解释:
1SELL为下跌趋势的开始,当我们看到趋势开始时K线的形态是4小时的大阴线向下跌,所以我们需要观察价格在反弹到2SELL的时候是否有做空机会。其次是3SELL和4SELL 它们都有一个共同点,就是全部都是1根或两根K线就向下跌,并且破了新的低点。此时我们再去观察均线通道时,发现它已经成为了空头趋势。
当牌空头趋势时,我们需要做的就是跟随市场去交易。逢高卖出。而当6SELL之后价格没有创新低时,我们就应该产生警觉,因为低点在抬高,而当1BUY突破6SELL时,高点在抬高时就需要注意趋势是否已经转变,
那么如何确认趋势是否已经由空头转为多头呢?我们可以看到2BUY时回踩到均线通道时出现了买盘反应,这种反应就是比较好的确认信号。并且2buy-5buy都是低点在抬升,当出现6BUY时,价格又快速拉升成为一个更大的牛市。这就是趋势的威力。具体操作我可以用中文解释,国外的朋友希望可以翻译理解。
下面我们先来说一下指标如何设置。
打开指标之后我们可以看到第一行至第四行是均线的显示与隐藏,而我只选择勾选Direction和lagging direction 这两条就是通道均线,也是大级别趋势交易较为好用的均线通道。
然后就是Volatility zone这是对于均线通道内颜色的选择。这个大家可以随意选择自己喜欢的颜色。所以图表中看到的就是我只勾选了DIRECTION LAGGING DIRECTION VVOLATILITY ZONE这三个选择,并对其颜色进行了设置。
下面我用中文好好来说一下我对这指标的一些使用心得:
1,当通道表现为空头趋势时,只能选择逢高卖出。利用价格回到通道边缘或内部的时候进行买出,止损在通道上方。
2、当价格向上突破通道时,选择空头止损离场,然后等待多头的入场机会。
3、当价格突破下跌的通道时,价格回踩到通道上沿时选择止跌买入。预期后面的多头趋势,但上破通道有一个硬性的要求就是必须突破最近的下跌趋势拐点,形成更高的高点。
4、随着时间的演变,趋势从下跌演变成上涨时,并且低点在抬高,高点也在抬高时,为明显多头趋势,此时只适合逢低买入。
5、什么算低点呢?就是当价格跌到通道上沿或通道里面时可以选择买进。
6、如果价格向下跌破趋势通道但快速收回通道时不算有效跌破,因为必须两根同色K线收盘在下方时才算跌破趋势通道,否则我都认为是主力机构在制作空头陷阱。
所以当你看到一根PINBAR或者是刺透双K线时都算是假破位诱空。
然后是右图上方的XAU 4H错误示例,因为趋势下破了低点,但同时也上破了高点,所以趋势是不明显的,即使从图中可以看到是震荡下跌行情,但均线最怕的就是震荡行情,不管是震荡上升还是横向又或者是下跌,都是不灵的。
所以当大级别左侧为下跌行情时,不要被小级别的反弹趋势通道短期向上就觉得应该考虑做多,其实我们更应该顺势而为。
尽管做为后知后觉者,我们也能吃到趋势的中间部分,不会在场外看着不敢入场。
那么趋势通道做XAU真的就不行吗?答案不是的,只是因为你选择的周期不对,用均线做交易有一个诀窍就是图表周期总有一个适合通道的,如果4小时是震荡下跌,那小时就会更加明显,所以只有选择通道适合的周期才能事半功倍,而不是用通道去选择合适的行情。
当然,用均线通道去做单边的行情是最好不过,但不要忘记,行情走势有70%的时间都是震荡的,只有30%的时间是单边的。
所以如果我们把XAU切换成为小时级别的走势时,你会发现,趋势当通道处于空头排列时,逢高卖出并不是不可以。同是也能看到多空转换时的回踩动作,就比如AUD 4H 和XAU 1H图表在多空转换的时候都有异曲同工之妙,市场绝大多数多空转换的时候就是这样子的。

Volume-Supported Linear Regression TrendHello Traders,
Linear Regression gives us some abilities to calculate the trend and if we combine it with volume then we may get very good results. Because if there is no volume support at up/downtrends then the trend may have a reversal soon. we also need to check the trend in different periods. With all this info, I developed Volume-Supported Linear Regression Trend script. The script checks linear regression of price and volume and then calculates trend direction and strength.
You have option to set Source, Short-Term Period and Long-Term Period. you can set them as you wish.
By default:
Close is used as "Source"
Short-Term Period is 20
Long-Term Period is 50
in following screenshot I tried to explain short term trend (for uptrend). Volume supports the trend? any volume pressure on trend? possible reversal? same idea while there is downtrend.
in following screenshot I tried to explain long term trend:
You can also check Positive/Negative Divergences to figure out possible reversals (to automate it, you can use Divergence for Many Indicators v4 , it has ability to check divergences on external indicators)
Enjoy!

[blackcat] L2 Ehlers Correlation Trend StrategyLevel: 2
Background
John F. Ehlers introuced Correlation Trend Strategy in May, 2020.
Function
In Dr. Ehlers article “Correlation As A Trend Indicator” in May, 2020, he introduces a new trend indicator that is based on the correlation between a security’s price history and the ideal trend: a straight line. He describes methods for using the indicator to not only identify the onset of new trends but to identify trend failures as well. The indicator helps to identify the onset of a trend or to detect the failure of a trend. While his correlation trend indicator measures the price correlation with a rising slope, the new correlation cycle indicator (CCY) measures the correlation with a sine wave .
Key Signal
CorrF --> Correlation Trend Strategy fast line
CorrS --> Correlation Trend Strategy slow line
Pros and Cons
100% John F. Ehlers definition translation, even variable names are the same. This help readers who would like to use pine to read his book.
Remarks
The 97th script for Blackcat1402 John F. Ehlers Week publication.
Readme
In real life, I am a prolific inventor. I have successfully applied for more than 60 international and regional patents in the past 12 years. But in the past two years or so, I have tried to transfer my creativity to the development of trading strategies. Tradingview is the ideal platform for me. I am selecting and contributing some of the hundreds of scripts to publish in Tradingview community. Welcome everyone to interact with me to discuss these interesting pine scripts.
The scripts posted are categorized into 5 levels according to my efforts or manhours put into these works.
Level 1 : interesting script snippets or distinctive improvement from classic indicators or strategy. Level 1 scripts can usually appear in more complex indicators as a function module or element.
Level 2 : composite indicator/strategy. By selecting or combining several independent or dependent functions or sub indicators in proper way, the composite script exhibits a resonance phenomenon which can filter out noise or fake trading signal to enhance trading confidence level.
Level 3 : comprehensive indicator/strategy. They are simple trading systems based on my strategies. They are commonly containing several or all of entry signal, close signal, stop loss, take profit, re-entry, risk management, and position sizing techniques. Even some interesting fundamental and mass psychological aspects are incorporated.
Level 4 : script snippets or functions that do not disclose source code. Interesting element that can reveal market laws and work as raw material for indicators and strategies. If you find Level 1~2 scripts are helpful, Level 4 is a private version that took me far more efforts to develop.
Level 5 : indicator/strategy that do not disclose source code. private version of Level 3 script with my accumulated script processing skills or a large number of custom functions. I had a private function library built in past two years. Level 5 scripts use many of them to achieve private trading strategy.
[blackcat] L2 Ehlers ITrendline Trigger Trend-Following SystemLevel: 2
Background
John F. Ehlers introuced the Instantaneous Trendline and the Trigger of the trend-following system in his "Cybernetic Analysis for Stocks and Futures" chapter 3 on 2004.
Function
The process for creating a trendfollowing trading system from the indicators is simple. One unique aspect of the code is that the ITrend is forced to be a finite impulse response (FIR)-smoothed version of price for the first seven bars of the calculation.
This initialization is included to cause the ITrend to converge more rapidly to its correct value from the beginning transient. The strategy enters a long position when the trigger crosses over the Instantaneous Trendline and enters a short position when the trigger crosses under the Instantaneous Trendline. However, an effective trading system is more than following a simple set of indicators.
First, experience has shown that greater profits result from using limit orders rather than market orders or stop orders. Market orders are selfexplanatory. Stop orders mean the market must be going in the direction of the trade before the order is filled. For example, for long-position trades, the stop order must be placed above the current price. Thus, the price must increase from its current level before you get stopped into the long-position trade. This means you necessarily give up some of the profits you would otherwise have gotten if you had entered on a market order at the instant of your signal. You can lose additional profits from stop orders due to slippage.
Key Signal
Trigger ---> trend-following system fast line
ITrend ---> trend-following system slow line
Pros and Cons
100% John F. Ehlers definition translation of original work, even variable names are the same. This help readers who would like to use pine to read his book. If you had read his works, then you will be quite familiar with my code style.
Remarks
The 22th script for Blackcat1402 John F. Ehlers Week publication.
Readme
In real life, I am a prolific inventor. I have successfully applied for more than 60 international and regional patents in the past 12 years. But in the past two years or so, I have tried to transfer my creativity to the development of trading strategies. Tradingview is the ideal platform for me. I am selecting and contributing some of the hundreds of scripts to publish in Tradingview community. Welcome everyone to interact with me to discuss these interesting pine scripts.
The scripts posted are categorized into 5 levels according to my efforts or manhours put into these works.
Level 1 : interesting script snippets or distinctive improvement from classic indicators or strategy. Level 1 scripts can usually appear in more complex indicators as a function module or element.
Level 2 : composite indicator/strategy. By selecting or combining several independent or dependent functions or sub indicators in proper way, the composite script exhibits a resonance phenomenon which can filter out noise or fake trading signal to enhance trading confidence level.
Level 3 : comprehensive indicator/strategy. They are simple trading systems based on my strategies. They are commonly containing several or all of entry signal, close signal, stop loss, take profit, re-entry, risk management, and position sizing techniques. Even some interesting fundamental and mass psychological aspects are incorporated.
Level 4 : script snippets or functions that do not disclose source code. Interesting element that can reveal market laws and work as raw material for indicators and strategies. If you find Level 1~2 scripts are helpful, Level 4 is a private version that took me far more efforts to develop.
Level 5 : indicator/strategy that do not disclose source code. private version of Level 3 script with my accumulated script processing skills or a large number of custom functions. I had a private function library built in past two years. Level 5 scripts use many of them to achieve private trading strategy.

RSI TrendsRSI is a momentum indicator, however most people seem to be using it to go against the momentum by trying to identify tops/bottoms using it. Its in my opinion the wrong way to be using it. It can be easily used for trend following which seems like a better use for it.
Uptrend - RSI > 60
Downtrend - RSI < 40
Sideways - RSI between 40 and 60
If however not interested in filtering for sideways trends and convert it to a long-short only strategy that stays in market all the time then it can be simply modified by setting both overbought/oversold thresholds to 50. In such a case uptrend will be above 50 and downtrend will be less than 50.
Note: wait for close for current bar to be confirmed as RSI is calculated at close

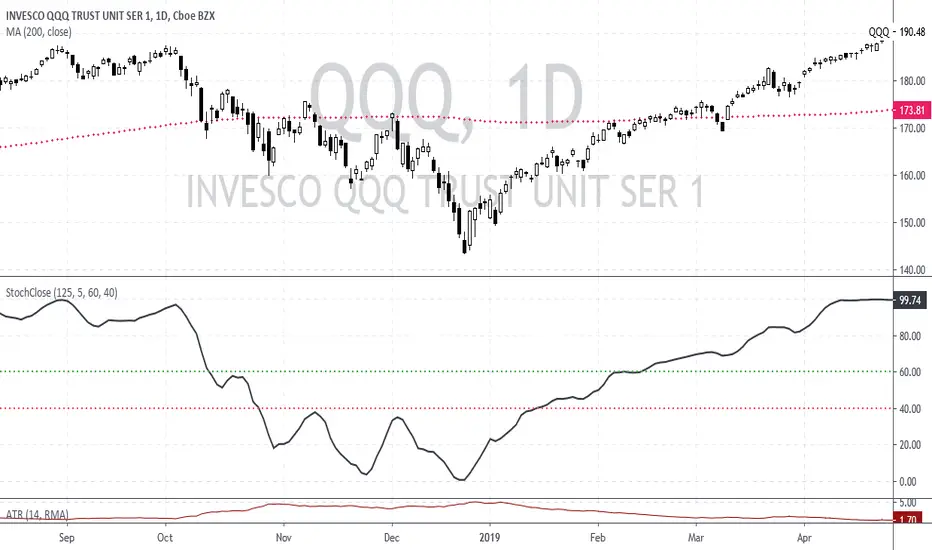
Stochastic based on Closing Prices - Identify and Rank TrendsStochClose is a trend indicator that can be used on its own to measure trend strength, in a scan to rank a group of securities according to trend strength or as part of a trend following strategy. Moreover, it acts as a volatility-adjusted trend indicator that puts securities on an equal footing.
StochClose measures the location of the current close relative to the close-only high-low range over a given period of time. In contrast to the traditional Stochastic Oscillator, this indicator only uses closing prices. Traditional Stochastic uses intraday highs and lows to calculate the range. The focus on closing prices reduces signal noise caused by intraday highs and lows, and filters out errant or irrationally exuberant price spikes.
Here are some examples when the high or low was out of proportion and suspect. Perhaps most famously, there were errant spike lows in dozens of ETFs in August 2015 (XLK, IJR, ITB). There were other spikes in VMBS (October 2014), IJR (October 2008) and KRE (May 2011). Elsewhere, there were suspicious spikes in IEI (April 2020), CHD (March 2020), CCRN (March 2020) and FNB (March 2020)
The preferred setting to identify medium and long-term uptrends is 125 days with 5 days smoothing. 125 days covers around six months. Thus, StochClose(125,5) is a 5-day SMA of the 125-day Stochastic based on closing prices. Smoothing with the 5-day SMA introduces a little lag, but reduces whipsaws and signal noise.
StochClose fluctuates between 0 and 100 with 50 as the midpoint. Values above 80 indicate that the current price is near the high end of the 125-day range, while values below 20 indicate that price is near the low end of the range. For signals, a move above 60 puts the indicator firmly in the top half of the range and points to an uptrend. A move below 40 puts the indicator firmly in the bottom half of the range and points to a downtrend.
StochClose values can also be ranked to separate the leaders from the laggards. In contrast to Rate-of-Change and Percentage Above/Below a Moving Average, StochClose acts as a volatility-adjusted indicator that can identify trend strength or weakness. The Consumer Staples SPDR is unlikely to win in a Rate-of-Change contest with the Technology SPDR. However, it is just as easy for the Consumer Staples SPDR to get in the top of its range as it is for the Technology SPDR. StochClose puts securities on an equal footing.
StochClose measures trend direction and trend strength with one number. The indicator value tells us immediately if the security is trending higher or lower. Furthermore, we can compare this value against the values for other securities. Securities with higher StochClose values are stronger than those with lower values.
Bollinger Bands Trend Model-BuschiEnglish
In general, Bollinger Bands are used as an indicator to visualize the "reversion to the mean". However, in this model, by using smaller variable values (default: 10 time intervals instead of 20, 1 standard deviation instead of 2), they are used as an trend following indicator. Two consecutive closes above the upper band form a buy signal (symbol 'B' above bar) which is reversed by two consecutive closes below the lower band (symbol 'S' under bar) and vice versa. The corresponding buying (green) and selling (red) zones are coloured between the bands.
Deutsch
Im Allgemeinen werden Bollinger-Bänder als ein Indikator verwendet, um die "Rückkehr zum Mittelwert" zu visualisieren. In diesem Modell werden sie durch kleine Variablen-Werte (Standardwert: 10 Zeitintervalle anstatt 20, 1 Standardabweichung anstatt 2) jedoch als Trendfolge-Indikator verwendet. Zwei aufeinanderfolgende Schlusskurse über dem oberen Band (Symbol 'B' über dem Balken) bilden ein Kaufsignal, das durch zwei aufeinanderfolgende Schlusskurse unter dem unteren Band (Symbol 'S' unter Balken) umgekehrt wird. Gleiches gilt umgekehrt. Die entsprechenden Kauf-Zonen (grün) und Verkauf-Zonen (rot) werden zwischen den Bändern eingefärbt.

Mawreez' Trend OscillatorA positive reading indicates an uptrend, a negative reading indicates a downtrend. For an uptrend, increasing values indicate that the trend is sustaining or strengthening while decreasing values indicate that the trend is stagnating or weakening. Vice versa for a downtrend. When the indicator reads 0, the price is not trending.
This indicator is based on the existing DMI indicator, but familiarity with the DMI is not required. The author's goal was to make a less laggy, more intuitively interpretable indicator compared to the DMI.
A comparison to the DMI is given above. The reader may see for themselves that trends are recognized quicker. A technical rundown of adjustments made to the DMI is given below.
Instead of interpreting the ADX, a sensitivity setting is added and its default value is 25. The value of this sensitivity setting is subtracted from the ADX. Then, any ADX values which fell below 0 are set to 0. Now, just flip the value of the ADX when the -DI is greater than the +DI. The result is then plotted as a histogram.
In addition, this indicator has less lag between price action and trend recognition. This is achieved by removing the EMA applied to the ADX, and instead applying lag-free smoothing to +DI and -DI before computing the ADX and then once more applying lag-free smoothing to the result of the computation.

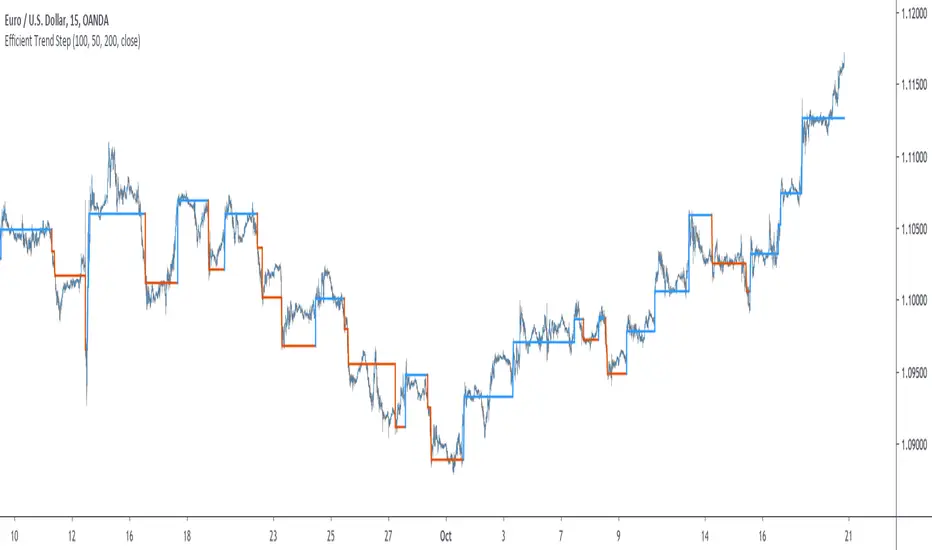
Efficient Trend Step - Spotting Trends EfficientlyIntroduction
The trend-step indicator (or auto-line) was based on volatility and aimed to spot trends in an adaptive way, however the indicator was only based on volatility and didn't gave much attention to the trend, later on i would publish an efficient version of it (efficient auto-line) based on the efficiency ratio who could adapt to the trend and eliminate potential whipsaws trades, however this approach included many settings that would require changes if the user switched markets, which reduce the utility of the indicator and make it actually super inefficient.
This is why i had to propose this indicator who remove all the flaws the efficient auto-line had without removing the core idea of it.
The Indicator
The indicator is based on recursion, when the price is superior/inferior to the indicator precedent value +/- volatility metric, then the indicator is equal to the closing price, this allow the indicator to fit the price relatively well. The volatility metric used is based on 2 standard deviations, one fast and one slow and the efficiency ratio, basically when price is trending the volatility metric will be closer to the value of the fast standard deviations, which would allow the indicator to be closer to the price, else the metric will be closer to the slow standard deviation which restrain the indicator from changing, therefore the volatility metric act as a threshold.
length control the period of the efficiency ratio, lower values of length will result in a volatility metric way closer to the fast standard deviation thus making the indicator more inclined toward making false signals.
Lower values for slow will make the indicator more reactive.
The indicator can be reactive but can also be really conservative, thus even remaining unchanged in some contrary movements of the main trend, this is called robustness and has its pro's and con's.
Conclusion
The trend-step indicators family might get to an end, or not, nonetheless they can provide precise entries and be extremely robust, which is great. Using low settings might prove to be useful to remove some noise. I hope this version find its use amongst the community. Thanks for reading !
Lancelot Band - ATR Reversal+Trending IndicatorThis is an indicator I created recently, with the mind of spotting where price might reverse and where the price is trending. You can see this as the primary indicator for your system, however, it is recommended you use this in conjunction with other confirmation indicators.
This script focus solely on ATR or Average True Range.
This indicator is the combination of the baseline from the Ichimoku cloud and the concept of the Keltner channel.
Baseline period = 14
ATR period = 14
ATR Mult = 1.5
For reversal
Long when price crossover Lower band & Stop loss at xLower band
Sell when price crossunder Upper band & Stop loss at xUpper band
For Trend Following
Long when price crossover xUpper band and Stop loss at Upper band
Short when price crossunder xLower band and Stop loss at Upper band
Again, you will need other indicators to help you to succeed in this system. This indicator will not generate the best exit for your position but will generate a good entry signal when you use it with both volume indicator and exit indicator.
Works well on BTCUSD XBTUSD, as well as other major liquid Pair.
Feel free to follow me on Twitter @Lancelot_Auger for more free Alpha.
Please acknowledge my effort by like and follow.
And lastly,
Save Hong Kong, the revolution of our times.

HMA-Kahlman Trend, Clipping & TrendlinesThis script utilizes three modules:
- Trendlines module (by Joris Duyck),
- Winsorizing submodule and
- HMA-Kahlman Trend module.
The Trendlines module produces crossovers predictive of the next local trend. The Winsorizing (clipping) submodule filters signals by a volume level, eliminating the ones with the volume below a threshold. The last feature obviously does not work with the assets not supporing Volume, so set the Winsorizing submodule to false. The Winsorizing and Trendlines modules can be turned off.

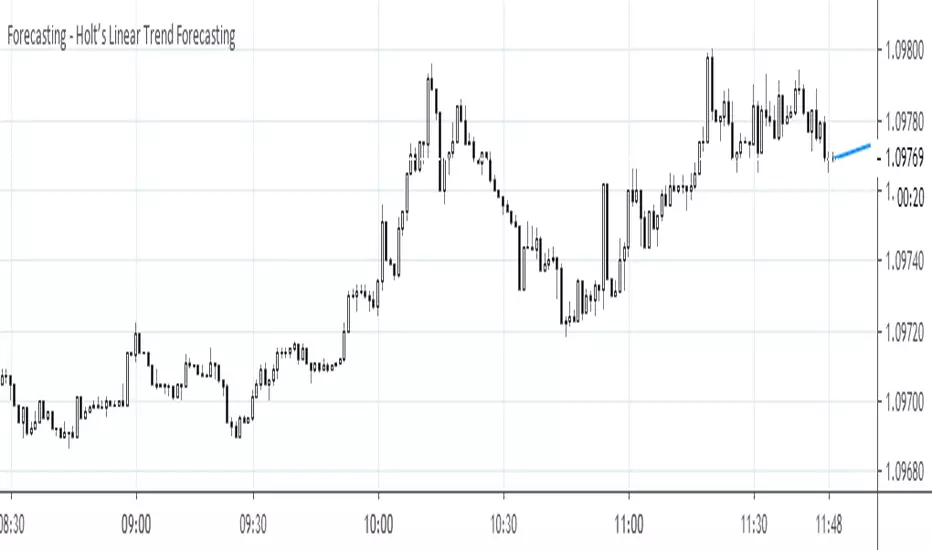
Forecasting - Holt’s Linear Trend ForecastingHolt's Forecasting method
Holt (1957) extended simple exponential smoothing to allow the forecasting of data with a trend. This method involves a forecast equation and two smoothing equations (one for the level and one for the trend):
Forecast equation: ŷ = l + h * b
Level equation: l = alpha * y + (1 - alpha) * (l + b)
Trend equation: b = beta * (l - l) + (1 - beta) * b
where:
l (or l) denotes an estimate of the level of the series at time t,
b (or b) denotes an estimate of the trend (slope) of the series at time t,
alpha is the smoothing parameter for the level, 0 ≤ alpha ≤ 1, and
beta is the smoothing parameter for the trend, 0 ≤ beta ≤ 1.
As with simple exponential smoothing, the level equation here shows that l is a weighted average of observation y and the one-step-ahead training forecast for time t, here given by l+b. The trend equation shows that b is a weighted average of the estimated trend at time t based on l-l and b, the previous estimate of the trend.
The forecast function is not flat but trending. The h-step-ahead forecast is equal to the last estimated level plus h times the last estimated trend value. Hence the forecasts are a linear function of h.
Mega Trend Plus - S&P 500 Trend Follower / Market GaugeFirstly, 100% of the credit goes to Greg Morris @ Stockcharts.com for the article detailing the concept and most of the settings/components. I've simply implemented his idea. I haven't sought permission from him, but given that he was open with the components of the indicator I'm assuming he's happy for me to go ahead and code this in pinescript. See the article here: stockcharts.com
Okay, so this is part of a system/indicator Greg outlined in the article that he calls Trend Gauge. The idea is fairly simple: take a group of indexes that cover the breadth of the market you want to trade, track their relationship/position to their 200 period Exponential Moving Average (EMA), and assign scores to bull/bear crosses + relative location to the EMA. Once you've normalized and aggregated the scores you finish up with a trend following indicator that works surprisingly well.
This part is called Mega Trend Plus, and tracks whether an index is above or below its 200 period EMA. I'll be releasing the second part ("Trend Strength") soon. Once that's done I'll combine them to form the full "Trend Gauge" indicator.
I decided to provide the base version that people can then experiment with and tweak to their liking, so Greg's version shown in the article is smoother than the one provided here. It's up to you to play with smoothing options, and potentially tweak the weightings of the various components. Please see the script for info on what the various inputs are - I've added notes there.
So, how does it do? Well, as you can see from the chart above it works pretty well overall. The S&P 500 has been fairly trendy over the last few decades, so it's been prime territory for a system like this. It would have kept you out of the big bear markets (particularly GFC & 2015-16), and that's the goal of any trend-based system. They thrive on how little they lose, not necessarily on how much they make.
As you can see, the indicator is pretty choppy. So it's not designed (in the current configuration) to provide accurate buy/hold/sell signals. It currently functions more as a market gauge / strength indicator.
Hopefully you find this concept interesting. It's simple, but the best systems often are.
Please add comments below if you come up with an interesting configuration or variation.
Let me know if you have any queries.
DD

Vortex Trend TrackerThough it may sound complex, the Vortex Indicator is essentially an uptrend line and a downtrend line. The vortex indicator can be used for a variety of purposes, including tracking the strength of trends, identifying/anticipating reversals, and generating entry/exit signals. It’s calculation is shown in the open-source code below.
To reduce the number of whipsaws produced by the indicator, we used an Exponential Moving Average of vmPlus and vmNegative values with a default length of 10. Decreasing this length will result in a more responsive vortex at the cost of more whipsaws and false signals.
The chart shows the absolute value of the difference between the uptrend and downtrend line displayed as the main histogram.
If the uptrend line is greater than the downtrend (thus indicating positive movement), then the histogram bars will be either light green or dark green. If the uptrend line has just now crossed the downtrend line, then the bar will be dark green. Bars will also be dark green when the uptrend line is greater than the downtrend line and the uptrend line is increasing. This means the trend is increasing in strength still. If the uptrend line is greater than the downtrend line, but is decreasing, then the bars will be light green. This means that the upwards trend is losing strength.
If the downtrend line is greater than the uptrend line, then there is a negative trend occurring and the bars will be either red or light red. If the downtrend line has just crossed over the uptrend line or is increasing in value, then the bar will be red. If the downtrend line is greater than the uptrend line, but is decreasing in value, then the bars will be light red (meaning the downtrend is weakening).
One way to trade using this vortex is to enter a long position when the bar color changes from red to light red. This would mean that the downtrend is decreasing in strength and an upwards reversal is likely to occur soon. Then, traders can exit their long position when the bars change from dark green to light green. When that color change occurs it means that the uptrend is running out of steam and price is unlikely to continue its upwards climb.
Traders can also choose to have the uptrend and downtrend lines plotted as well in the input menu. This may make it easier to visualize the Vortex and its usefulness in identifying reversals.

Stock Market Trend Analysis Trading System 101 (by ChartArt)This is a very simple trading system which is measuring the core of uptrends and downtrends using three basic elements: Close price, HL2 price, Pivot price.
Depending if the uptrend or downtrend is strong, the buy/sell signals are shown in different colors. The stronger trends are in brighter colors (lime and fuchsia). If the trend just fully changed direction from uptrend to downtrend (or vice versa), there is a background color highlight in the color of the new trend direction.
The trend detection should work best on monthly charts. I have created this in under an hour. My goal was to use the least amount of rules possible, therefore there are many false signals and the code is quite lazy.
You can lose all your money if you rely on these buy/sell signals!

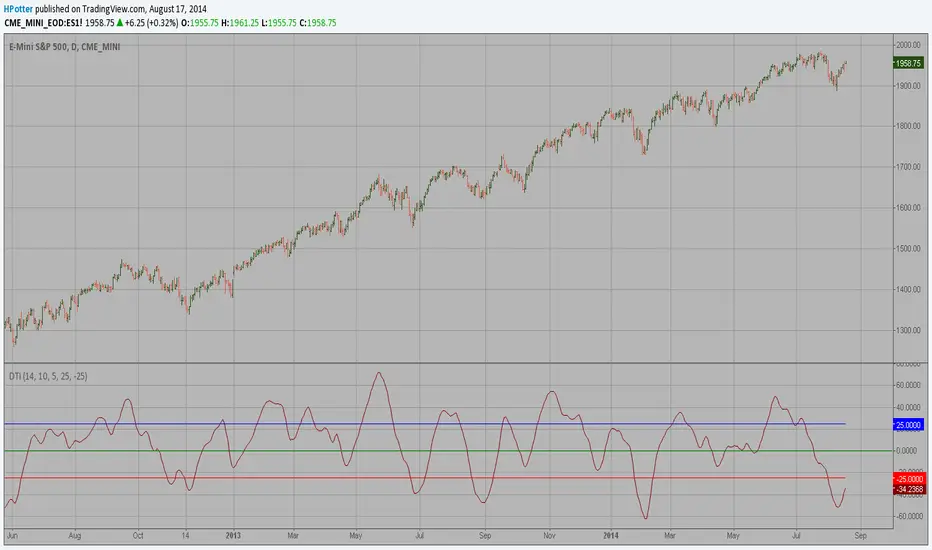
Directional Trend Index (DTI) This technique was described by William Blau in his book "Momentum,
Direction and Divergence" (1995). His book focuses on three key aspects
of trading: momentum, direction and divergence. Blau, who was an electrical
engineer before becoming a trader, thoroughly examines the relationship between
price and momentum in step-by-step examples. From this grounding, he then looks
at the deficiencies in other oscillators and introduces some innovative techniques,
including a fresh twist on Stochastics. On directional issues, he analyzes the
intricacies of ADX and offers a unique approach to help define trending and
non-trending periods.
Directional Trend Index is an indicator similar to DM+ developed by Welles Wilder.
The DM+ (a part of Directional Movement System which includes both DM+ and
DM- indicators) indicator helps determine if a security is "trending." William
Blau added to it a zeroline, relative to which the indicator is deemed positive or
negative. A stable uptrend is a period when the DTI value is positive and rising, a
downtrend when it is negative and falling.
FREE INDICATOR: CHOPPINESS INDEX "TREND DETECTION FROM CHAOS"About:
The Choppiness Index was created by E.W. Dreiss out of chaos theory, and attempts to gauge the current market's trendiness.
I've seen a few versions of this floating around, but this was built off the true version as described in the original 1993 release, you can read more about it here: www.edwards-magee.com
Usage:
Values above 61.8 are considered very choppy, values below 38.2 are considered very trendy, but values along the entire scale can help you determine position sizing, or even weather you should be getting into this trade or not.
If you are looking for a new way to know weather the market is trending, about to trend, or just going sideways, this very handy indicator for algorithmic trading may be your answer.
Grab the source code here: pastebin.com
Installation video by @ChrisMoody here : blog.tradingview.com
░░░░░░░░░░░░░░░ Feel free to follow me to keep up with my latest scripts! ░░░░░░░░░░░░░░░
░░░░░░░░░░░░ PLEASE THUMB UP OR STAR IF YOU LIKE THIS INDICATOR! ░░░░░░░░░░░░
I'd like as many people as possible to get it :)

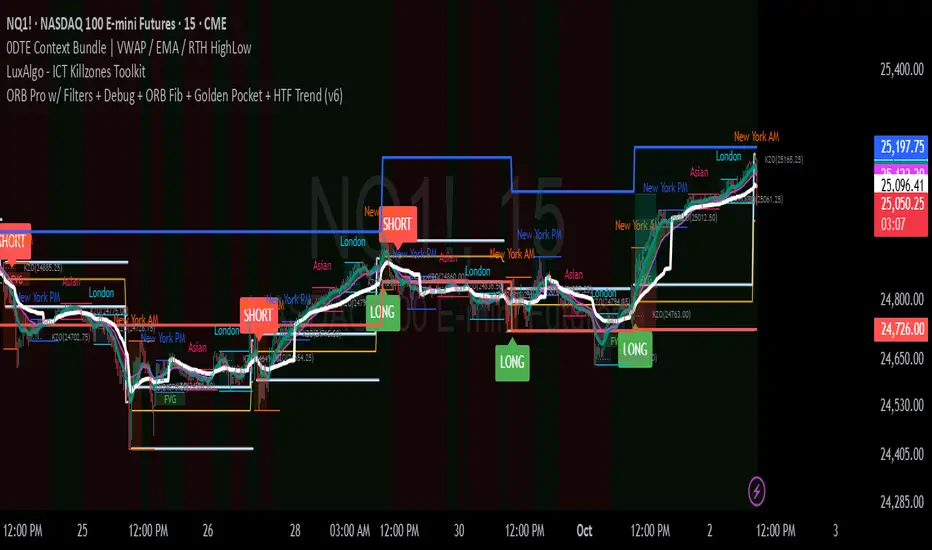
ORB Pro w/ Filters + Debug + ORB Fib + Golden Pocket + HTF Trend🚀 ORB Pro – Advanced Opening Range Breakout System
A professional ORB indicator with built-in filters, retest confirmation, EMA/HTF trend alignment, and automatic risk/reward targets. Designed to eliminate false breakouts and give traders clean LONG/SHORT signals with Fibonacci and debug overlays for maximum precision.
This script is an advanced Opening Range Breakout (ORB) system designed for futures, indices, and options traders who want more precision, cleaner entries, and higher win probability. It combines classic ORB logic with modern filters, Fibonacci confluence, and higher-timeframe trend confirmation.
The indicator automatically:
Plots the ORB box based on user-defined NY session times (default: 9:30–9:45 EST).
Generates long/short signals when price breaks the ORB range, with optional conditions like:
Candle close outside the range
Retest confirmation (with tolerance %)
Volume spike validation
EMA trend alignment
Higher-timeframe EMA slope alignment
Cooldown filters to prevent over-trading
Integrates Fibonacci retracements & extensions from the ORB box for confluence levels.
Includes Golden Pocket (0.5–0.618) retests for precision entries
Risk/Reward visualization — automatically plots stop loss and take profit levels based on user-defined R:R or fixed % levels.
Debug mode overlay to show why a signal is blocked (e.g., low volume, ORB too small, too late, wrong trend).
This tool is built for scalpers, day traders, and 0DTE options traders who need both flexibility and discipline.
⚙️ Inputs & Features
ORB Settings
ORB Start & End Time (NY) → Default: 9:30–9:45
Require Candle Close → Ensures breakouts are confirmed, not wick traps.
Retest Confirmation → Optional retest before entry (tolerance % adjustable).
Filters
Volume Spike → Validates breakouts only with above-average volume.
EMA Trend Filter → Confirms trade direction with EMA slope.
Higher Timeframe Trend → Optional (e.g., 15m ORB with 1h EMA alignment).
Cooldown Bars → Prevents consecutive false signals.
ORB Size Filter → Blocks signals when ORB is too small/too large.
Fibonacci Levels
Retracements: 0.236, 0.382, 0.5, 0.618, 0.786
Extensions: 1.272, 1.618
Golden Pocket Retest filter for high-probability trades
Risk Management
R:R Stops/Targets → Automatically plots SL/TP levels.
Custom Stop % / Take Profit % if not using R:R
Debug Overlay → Explains why signals are blocked
🧑💻 How to Use
Load the indicator on your chart (works best on 1m, 5m, and 15m).
Adjust ORB window (default 9:30–9:45 EST).
Select filters (candle close, retest, volume, EMA, HTF trend).
Watch for Long/Short labels outside ORB box with filters aligned.
Manage trades using plotted SL/TP levels or your own Webull/R:R calculator.
✅ Best Use Cases
Futures (NQ1!, ES1!)
ETFs (QQQ, SPY, IWM)
0DTE Options Trading
Scalping around market open
⚠️ Disclaimer
This tool is for educational purposes only. It does not constitute financial advice. Trading carries risk, and past performance does not guarantee future results. Always test on paper trading before using real capital.
-----------------------------------------
ORB Pro w/ Filters + Debug + ORB Fib + Golden Pocket + HTF Trend
A professional Opening Range Breakout (ORB) toolkit designed for intraday traders who want precision entries, risk-managed exits, and layered confirmation filters. Built for futures, stocks, and ETFs (e.g. NQ, ES, QQQ).
🔎 Core Logic
This script plots and trades breakouts from the Opening Range (9:30 – 9:45 NY time), then applies multiple confirmation filters before signaling a LONG or SHORT setup:
ORB Box: Defines the first 15 minutes of market activity (customizable).
Breakout Candle Confirmation: Requires a candle close outside the ORB box.
Retest Confirmation: Price must retest the ORB edge within tolerance before triggering.
Trend Filter: EMA confirmation to align trades with intraday trend.
Higher-Timeframe Trend Filter: Optional (default: 45-minute EMA) to avoid countertrend trades.
Fibonacci Levels: Auto-plot retracements (0.236 → 0.786) for confluence and trade management.
Golden Pocket Retest (Optional): Adds an extra precision filter at 0.5–0.618 retracement.
⚙️ Default Settings (Optimized for Beginners)
These are the pre-configured inputs so traders can load and trade immediately:
ORB Session: 9:30 – 9:45 NY
✅ Require Candle Close Outside ORB
✅ Require Retest Confirmation (tolerance 0.333%)
❌ Require Volume Spike (off by default, optional toggle)
✅ Require EMA Trend (50 EMA intraday)
✅ Require Higher-TF Trend (45m, EMA 21)
❌ Higher-TF EMA slope required (off)
✅ Cooldown Between Signals (10 bars)
ORB % Range: Min 0.3%, Max 0.5%
Max Minutes After ORB: 180
✅ ORB-based Risk/Reward Stops & Targets (default: 2R)
Stop Loss: 0.5% (if not R:R)
Take Profit: 1% (if not R:R)
✅ Debug Overlay (shows why signals are blocked)
✅ Fibonacci Retracements Plotted
❌ Extensions (off by default, toggle if needed)
✅ Golden Pocket Retest available, tolerance 0.11 (optional)
📈 Signals
Green "LONG" Label: Valid breakout above ORB with trend confirmation.
Red "SHORT" Label: Valid breakdown below ORB with trend confirmation.
Blocked (debug text): Signal suppressed by filters (low volume, too late, no retest, etc.).
🎯 Trade Management
Default R:R is 2:1 (stop at ORB edge, TP projected).
For manual trading (e.g., Webull, IBKR), you can use the plotted TP/SL boxes directly.
Fibonacci + Golden Pocket give additional profit-taking levels and retest filters.
✅ Best Practices
Use 15m chart for main ORB entries.
Confirm direction with HTF trend (45m EMA by default).
Avoid signals blocked by “Low Volume” or “Too Late” (debug helps identify).
Adjust ORB % range for asset volatility (tight for ETFs, wider for futures).
🚀 Why ORB Pro?
This is more than a standard ORB indicator. It’s a professional breakout system with filters designed to avoid false breakouts, automatically handle risk/reward, and guide traders with clear visual signals. Perfect for both systematic day traders and discretionary scalpers who want structure and confidence.
👉 Recommended starting point:
Load defaults → trade the 15m ORB with EMA + HTF filters on → let the script handle retests and stop/target placement.
Z-Score Trend Channels [BackQuant]Z-Score Trend Channels
A self-contained price-statistics framework that turns a rolling z-score into price channels, bias states, and trade markers. Run either trend-following or mean-reversion from the same tool with clear, on-chart context.
What it is
A rolling statistical map that measures how far price is from its recent average in standard-deviation units (z-score).
Adaptive channels drawn in price space from fixed z thresholds, so the rails breathe with volatility.
A simple trend proxy from z-score momentum to separate trending from ranging conditions.
On-chart signals for pullback entries, stretched extremes, and practical exits.
Core idea (plain English math)
Rolling mean and volatility - Over a lookback you get the average price and its standard deviation.
Z-score - How many standard deviations the current price is above or below its average: z = (price - mean) / stdev. z near 0 means near average; positive is above; negative is below.
Noise control - An EMA smooths the raw z to reduce jitter and false flickers.
Channels back in price - Fixed z levels are converted back to price to form the upper, lower, and extreme rails.
Trend proxy - A smoothed change in z is used as a lightweight trend-strength line. Positive strength with positive z favors uptrend; negative strength with negative z favors downtrend.
What you see on the chart
Channels and fills - Mean, upper, lower, and optional extreme lines. The area mean->upper tints with the bearish color, mean->lower tints with the bullish color.
Background tint (optional) - Soft green, red, or neutral based on detected trend state.
Signals - Bullish Entry (triangle up) when z exits the oversold zone upward; Bearish Entry (triangle down) when z exits the overbought zone downward; Extreme markers (diamonds) at the extreme bands with a one-bar turn.
Table - Current z, trend state, trend strength, distance to bands, market state tag, and a quick volatility regime label.
Edge labels - MEAN, OB, and OS labels slightly projected forward with level values.
Inputs you will actually use
Z-Score Period - Lookback for mean and stdev. Larger = slower and steadier rails, smaller = more reactive.
Smoothing Period - EMA on z. Lower = earlier but choppier flips; higher = later but cleaner.
Price Source - Default hlc3. Choose close if you prefer session-close logic.
Upper and Lower Thresholds - Default around +2.0 and -2.0. Tighten for more signals, widen for fewer and stronger.
Extreme Upper and Lower - Deeper stretch guards, e.g., +/- 2.5.
Strength Period - EMA on z momentum. Sets how fast the trend proxy flips.
Trend Threshold - Minimum absolute z to accept a directional bias.
Visual toggles - Channels, signals, background tint, stats table, colors, and optional last-bar trend label.
How to use it: trend-following playbook
Read the state - Uptrend when z > Trend Threshold and trend strength > 0. Downtrend when z < -Trend Threshold and trend strength < 0. Neutral otherwise.
Entries - In an uptrend, prefer Bullish Entry signals that fire near the lower channel. In a downtrend, prefer Bearish Entry signals that fire near the upper channel.
Stops - Conservative: beyond the extreme channel on your side. Tighter: just outside the standard band that framed the signal.
Exits - For longs, exit or trim on a cross back through z = 0 or a clean tag of the upper threshold. For shorts, mirror with z = 0 up-cross or tag of the lower threshold. You can also reduce if trend strength flips against you.
Adds - In strong trends, additional signals near your side’s band can be add points. Avoid adding once z hovers near the opposite band for several bars.
How to use it: mean-reversion playbook
Find stretch - Standard reversions: Bullish Entry when z leaves the oversold zone upward; Bearish Entry when z leaves the overbought zone downward. Aggressive reversions: Extreme markers at extreme bands with a one-bar turn.
Entries - Take the signal as price exits the zone. Prefer setups where trend strength is near zero or tilting against the prior push.
Targets - First target is the mean line. A runner can aim for the opposite standard channel if momentum keeps flipping.
Stops - Outside the extreme band beyond your entry. If fading without extremes, place risk just beyond the opposite standard band.
Filters - Optional: skip counter-trend fades against a very strong trend state unless your risk is tight and predefined.
Reading the stats table
Current Z-Score - Magnitude and sign of displacement now.
Trend State - Uptrend, Downtrend, or Ranging.
Trend Strength - Smoothed z momentum. Higher absolute values imply stronger directional conviction.
Distance to Upper/Lower - Percent distance from price to each band, useful for sizing targets or judging room left.
Market State - Overbought, Oversold, Extreme OB, Extreme OS, or Normal.
Volatility Regime - High, Normal, or Low relative to recent distribution. Expect bands to widen in High and tighten in Low.
Parameter guidance (conceptual)
Z-Score Period - Choose longer for a structural mean, shorter for a reactive mean.
Smoothing Period - Lower for earlier but noisier reads; higher for slower but steadier reads.
Thresholds - Start around +/- 2.0. Tighten for scalping or quiet ranges. Widen for noisy or fast markets.
Trend Threshold and Strength Period - Raise to avoid weak, transient bias. Lower to capture earlier regime shifts.
Practical examples
Trend pullback long - State shows Uptrend. Price tests the lower channel; z dips near or below the lower threshold; a Bullish Entry prints. Stop just below extreme lower; first target mean; keep a runner if trend strength stays positive.
Mean-revert short - State is Ranging. z tags the extreme upper, an Extreme Bearish marker prints, then a Bearish Entry prints on the leave. Stop above extreme upper; target the mean; consider a runner toward the lower channel if strength turns negative.
Potential Questions you might have
Why z-score instead of fixed offsets - Because the bands adapt with volatility. When the tape gets quiet the rails tighten, when it runs hot the rails expand. Your entries stay normalized.
Do I need both modes - No. Many users run only trend pullbacks or only mean-reversions. The tool lets you toggle what you need and keep the chart readable.
Multi-timeframe workflow - A common approach is to set bias from a higher timeframe’s trend state and execute on a lower timeframe’s signals that align with it.
Summary
Z-Score Trend Channels gives you an adaptive mean, volatility-aware rails, a simple trend lens, and clear signals. Trade the trend by buying pullbacks in green and selling pullbacks in red, or fade stretched extremes back to the mean with defined risk. One framework, two strategies, consistent logic.

Adaptive Log Trend ChannelOne-line Summary / 一句话简介
EN: Adaptive log-scale trend channel using Pearson-optimized regression and deviation bands.
中文:基于皮尔逊优化回归的自适应对数趋势通道,带标准差波动带。
Full Description / 完整介绍
What it does / 功能
EN: This indicator fits a log-linear regression to price and builds a trend channel with ±k·σ deviation bands. It automatically selects the period with the highest Pearson correlation (R), ensuring the channel best matches the dominant market trend.
中文:该指标通过价格的对数线性回归拟合趋势,并在中线上下绘制 ±k·σ 偏差通道。它会自动选择皮尔逊相关系数 (R) 最高的周期,从而保证通道与主要趋势最贴合。
Why it’s useful / 适用价值
EN:
Naturally fits assets with multiplicative growth (crypto, tech stocks).
Adapts dynamically to different market regimes.
Provides CAGR estimates on Daily/Weekly charts for trend strength evaluation.
中文:
自然适用于呈现乘法增长的资产(如加密货币与科技股)。
可动态适应不同的市场阶段。
在日线/周线图上提供 趋势年化收益率 (CAGR),帮助评估趋势强度。
How it works / 工作原理
EN:
Computes log(price) → regression slope & intercept.
Draws a midline (log regression projection).
Upper & lower bands = ±k·σ in log space.
Info panel shows: Auto-Selected Period, Trend Strength (or Pearson’s R), and CAGR.
中文:
对价格取对数 → 计算回归斜率与截距。
绘制 中线(对数回归投影)。
上下轨 = 对数空间中的 ±k·σ。
信息面板显示:自动选择周期、趋势强度(或皮尔逊 R 值)、以及 CAGR 年化收益率。
Key Settings / 主要参数
EN:
Long-Term Mode: Uses extended periods (300–1200).
Deviation Multiplier (k): Controls channel width (default 2.0).
Styles: Colors, line type, and extension.
Panel Options: Toggle auto-period, Pearson’s R, and CAGR.
中文:
长期模式:采用更长周期 (300–1200)。
偏差倍数 (k):控制通道宽度(默认 2.0)。
样式:可设置颜色、线型、延长方式。
信息面板:可开关自动周期、皮尔逊 R、CAGR。
Notes / 注意事项
EN:
CAGR is only available on Daily/Weekly timeframes.
Regression-based tools may repaint as new bars form; treat it as context, not signals.
中文:
CAGR 仅在日线与周线周期可用。
回归类指标在新K线形成时可能重绘,仅用于趋势参考而非交易信号。

ZigZag++ + 4 EMA89 Trend Candles + BUY/SELL LabelsThis script combines ZigZag patterns, EMA89 trend detection, and custom buy/sell scalp signals. It helps identify trend direction and potential entry points in trending markets.
Features:
- ZigZag structure points
- EMA89 as dynamic trend filter
- Buy/Sell scalp markers
- HL/HH swing labels
- Works best on 15m–4h timeframes
