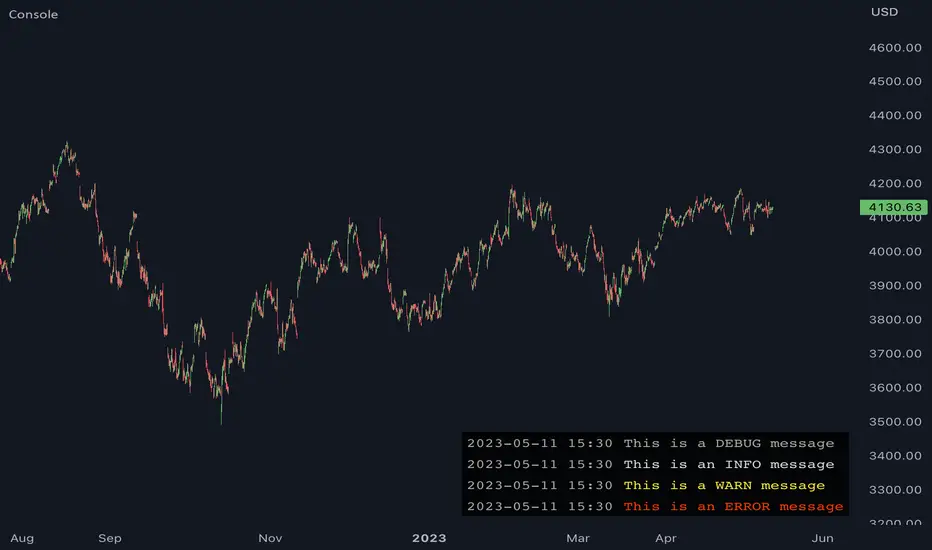
JavaScript-style Debug ConsoleThis library provides a JavaScript-style debug console to Pine Coders. It supports the most commonly used utilities from the WHATWG Console Standard including the following:
• console.log
• console.debug
• console.info
• console.warn
• console.error
• console.assert
• console.count
• console.countReset
• console.group
• console.groupEnd
• console.clear
In addition to the WHATWG standard, this library also supports the following methods:
• console.show
• console.hide
FEATURES
• Follows the WHATWG Console Standard, which is widely adopted by all major JavaScript runtimes including browsers and Node.js.
• Provides an out-of-box UI with pre-configured theming, ensuring a clean and professional-looking console.
• Allows for easy UI customizations to fit your personal preferences.
• Has extremely simple import and initialization, making it easy to integrate with your existing codebase.
USAGE
1. Import this library:
import algotraderdev/Console/1
2. Initialize the console object:
var console = Console.new()
// You can also specify optional params to customize the look & feel.
var console = Console.new(
position = position.bottom_right,
max_rows = 50,
width = 0,
text_size = size.normal,
background_color = #000000CC,
timestamp_color = #AAAAAA,
info_message_color = #DDDDDD,
debug_message_color = #AAAAAA,
warn_message_color = #FFEB3B,
error_message_color = #ff3c00)
3. Use the console object to debug your code. Here are some examples:
// Basic logging
console.log('hello world!') // prints 'hello world'
console.warn('warn') // prints 'warn' in yellow
console.error('error') // prints 'error' in red
console.clear() // clears the console
// Assertion
console.assert(a.isEmpty(), 'array should be empty') // prints 'assertion failed: array should be empty' if the array is not empty
// Counter
console.count('fooFunction') // prints 'fooFunction: 1'
console.count('fooFunction') // prints 'fooFunction: 2'
console.countReset('fooFunction') // resets the counter
console.count('fooFunction') // prints 'fooFunction: 1'
// Group
console.log('A')
console.group()
console.log('B')
console.group()
console.log('C')
console.log('D')
console.groupEnd()
console.log('E')
console.groupEnd()
console.log('F')
// prints
// A
// B
// C
// D
// E
// F
// Hide and show
console.hide()
console.show()
ค้นหาในสคริปต์สำหรับ "text"
Position_controlLibrary "Position_control"
This is a library for defining positions and working with them.
f_calculateLeverage(_Leverage, _maintenance, _value, _direction)
Calculate the leverage used in a trade.
@description This function calculates the leverage used in a trade, based on the value of the trade, the maintenance margin, and the direction of the trade.
Parameters:
_Leverage (float) : The leverage used in the trade, as a floating point number.
_maintenance (float) : The maintenance margin percentage, as a floating point number.
_value (float) : The value of the trade, as a floating point number.
_direction (string) : The direction of the trade, either "long" or "short".
Returns: The leverage used in the trade, as a floating point number.
f_calculate_PL(_Position, _max_TP, _Position_index, _show_profit, _i_decimals_contracts, _i_decimals_prercent)
Calculate the profit or loss for a given trade.
@description This function calculates the profit or loss for a given trade, based on the position type, maximum take profit, position index, and whether to show the profit as a percentage or a value.
Parameters:
_Position (t_Position_type ) : An array of position types for the trade.
_max_TP (int) : The maximum take profit for the trade, as an integer value.
_Position_index (int) : The index of the position in the array, as an integer value.
_show_profit (bool) : A boolean value indicating whether to show the profit as a percentage or a value.
_i_decimals_contracts (int)
_i_decimals_prercent (int)
Returns: The profit or loss for the trade, as a floating point number.
f_drawposition(_Position, _Parameters, _Position_index)
draws a position on the chart
@description via sending in a typo of Position this function is able to drawout Stoploss, Entrybox, Takeprofits and the required labels with information
Parameters:
_Position (t_Position_type ) : array of type t_Position_type containing the position information.
_Parameters (t_drawing_parameters)
_Position_index (int) : the index of the current position.
Returns: None but boxes / lines / labels on the chart itself
t_TP_Variant
Fields:
TP_Type (series__string)
TP_Parameter_1 (series__integer)
TP_Parameter_2 (series__integer)
TP_Parameter_3 (series__float)
TP_Parameter_4 (series__float)
t_TPs
Fields:
TP_Price (series__float)
TP_Lot (series__float)
TP_Variant (|t_TP_Variant|#OBJ)
TP_Active (series__bool)
t_SLs
Fields:
SL_Price (series__float)
SL_Lot (series__float)
SL_Active (series__bool)
t_Position_type
Fields:
Lot (series__float)
Leverage (series__float)
Maintenance (series__float)
Starttime (series__integer)
Entry_Start (series__float)
Stoptime (series__integer)
Entry_Stop (series__float)
Entryprice (series__float)
TPs (array__|t_TPs|#OBJ)
SLs (array__|t_SLs|#OBJ)
t_drawing_parameters
Fields:
ShowPos (series__bool)
ShowLIQ (series__bool)
A_Colors (array__color)
Prolong_lines (series__bool)
Str_fontsize (series__string)
Textshift (series__integer)
Decimals_contracts (series__integer)
Decimals_price (series__integer)
Decimals_percent (series__integer)
bartime (series__integer)

See inside Candles: Directionality %; Constituent Bars & GapsSee inside candles based on user-input LTF setting: get data on 'Directionality' of your candle; Gaps (total and Sum; UP and DOWN); Number of Bull or Bear constituent candles
//Features:
-DIRECTIONALITY: compare length of the 'zig-zag' random walk of lower time frame constituent candles, to the full height of the current candle. Resulting % I refer to as 'directionality'.
-GAPs: what i refer to as 'gaps' are also known as Volume imbalances: the gap between previous candles close and current candle's open (if there is one).
--Gaps total (up vs down gaps). Number of Up gaps printed above bar in green, down gaps printed below bar in red.
--Gaps Sum (total summed UP gap, total summed down gaps. Sum of Up gaps printed above bar in green, Sum of down gaps printed below bar in red.
-Candles Total: Numer of LTF up vs down candles within current timeframe candle. Number of up candles printed above bar in green, Number of down candles printed below bar in red.
//USAGE:
-Primary purpose in this was the Directionality aspect. Wanted to get a measure of how choppy vs how directional the internals of a candle were. Idea being that a candle with high % directionality (approaching 100) would imply trending conditions; while a candle which was large range and full bodies but had a low % directionality would imply the internals were back-and-forth and => rebalanced, potentially indicating price may not need to retrace back into it and rebalance further. All rather experimental, please treat it as such: have a play around with it.
-Number of gaps, Sums of up and down gaps, ratio of up and down constituent candles also intended to serve a similar purpose as the above.
-Set the input lower timeframe; this must obviously be lower then your current timeframe. You will significant differences in results depending on the ratio your timeframes (chart timeframe vs user-input timeframe).
//User Inputs:
-Lower timeframe input (setting child candle size within current chart parent candle).
-Choose function from the four listed above.
-typical formating options: Bull color/bear color txt for gaps functions.
-display % unit or not.
-display vertical or horizontal text.
-Set min / max directionality thresholds; and color code results.
-Toggle on/off 'hide results outside of threshold' to declutter the chart.
-choose label style.
//NOTES:
-Directionality thresholds can be set manually; Max and Min thresholds can be set to filter out 'non-extreme' readings.
-Note that directionality % can sometimes exceed 100%, in cases where price trends very strongly and gaps up continuously such that sum of constituent candles is less than total range of parent candle.
-Personally i like the idea of seeking bold, large-range, full bodied candles, with a lower than typical directionality %; indicating that a price move is both significant and it's already done it's rebalancing; I would see this as potentially favourable for continuation (obviously depending on context).
---- Showcase of the other functions beyond Directionality percentage ----
Candles Total (bull vs Bear). ES1! Hourly; ltf = 5min: Candles total: LTF up candles and LTF down candles making up the current HTF candle (constituent number of UP candles printed above in green, Down candles printed below in red):
Gaps SUM. SPX hourly, ltf = 5min. Sum of 'UP' gaps within candle printed above in green, sum of 'DOWN' gaps printed below in red:
Gaps TOTAL: SPX hourly, ltf = 1min. Simply the total of 'up' gaps vs 'down' gaps withing our candle; based on the user input constituent candles within:

Ignition Cha Cha ChaIgnition Cha Cha Cha (ICCC) is a 3 color coded moving average indicator which numerically quantify the angle of their trends. I have labeled them as fast, medium and slow. The trend colors are Green for bullish, Red for bearish and Grey for sideways. The sideways movement can be user defined for all 3 in the settings under Threshold. If you regard for example anything under 10º as sideways then place 10 in the corresponding threshold and any angle under 10º will give a grey moving average and a grey labeled text. I use this chart in several ways. If you don't want moving averages all over your Chartistic Masterpiece you can turn off the plots and leave the numeric angles which will give you an overview of the trend. Conversely if you want to make the ultimate trend chart you can setup a 4 chart layout, Weekly, Daily, 12 hour and 4 hour and add the indicator with 200/50/25 moving averages and look for confluence. I find the best way for this is turn off the candles and use the moving averages with the numeric labels. You also have the ability to turn off and on different aspects of the indicator so that there is good control over its look. Also I have given the indicator lots of Alert presets for all 3 of the moving averages so you can avoid demented screen-stairing. Please forgive the name, my mother made me do Ballroom dancing lessons as a kid.
Trading Checklist - SonarlabTrading Checklist is a customizable indicator designed for traders who want to stay disciplined and stick to their trading rules. Using this indicator, you can easily create and display your own personalized checklist of trading rules directly on your TradingView chart.
The Title and the Body are two different sections, so you can set two different styles.
This indicator allows you to customize:
Text color
Text size
Text alignment

X48 - Strategy | BreakOut & Consecutive (11in1) + Alert | V.1.2================== Read This First Before Use This Strategy ==============
*********** Please be aware that this strategy is not a guarantee of success and may lead to losses.
*********** Trading involves risk and you should always do your own research before making any decisions.
================= Thanks Source Script and Explain This Strategy ===================
► Description
Write a detailed and meaningful description that allows users to understand how your script is original, what it does, how it does it and how to use it
This Strategy Are Combine Strategy and Indicators Alert Function For Systematic Trading User.
Strategy List, Thanks For Original Source Script , From Tradingview Build-in Script From fmzquant Github
// Channel BreakOut Strategy : Calculate BreakOut Zone For Buy and Sell.
// Consecutive Bars UP/Down Strategy : The consecutive bars up/down strategy is a trading strategy used to identify potential buy and sell signals in the stock market. This strategy involves looking for a series of bars (or candles) that are either all increasing or all decreasing in price. If the bars are all increasing, it can be a signal to buy, and if the bars are all decreasing, it can be a signal to sell. This strategy can be used on any timeframe, from a daily chart to an intraday chart.
// 15m Range Length SD : Range Of High and Low Candle Price and Lookback For Calculate Buy and Sell.
Indicators Are Simple Source Script (Almost I'm Chating With CHAT-GPT and Convert pinescript V4 to V5 again for complete almost script and combine after)
// SwingHigh and SwingLow Plot For SL (StopLoss by Last Swing).
// Engulfing and 3 Candle Engulfing Plot.
// Stochastic RSI for Plot and Fill Background Paint and Plot TEXT For BULL and BEAR TREND.
// MA TYPE MODE are plot 2 line of MA Type (EMA, SMA, HMA, WMA, VWMA) for Crossover and Crossunder.
// Donchian Fans MODE are Plot Dot Line With Triangle Degree Bull Trend is Green Plot and Bear Trend is Red Plot.
// Ichimoku Cloud Are Plot Cloud A-B For Bull and Bear Trend.
// RSI OB and OS for TEXT PLOT 'OB' , 'OS' you will know after OB and OS, you can combo with other indicators that's make you know what's the similar trend look like?
// MACD for Plot Diamond when MACD > 0 and MACD < 0, you can combo with other indicators that's make you know what's the similar trend look like?
Alert Can Alert Sent When Buy and Sell or TP and SL, you can adjust text to alert sent by your self or use default setting.
========== Let'e Me Explain How To Use This Strategy =============
========== Properties Setting ==========
// Capital : Default : 1,000 USDT For Alot Of People Are Beginner Investor = It's Capital Your Cash For Investment
// Ordersize : Default Are Setting 5% / Order We Call Compounded
========== INPUT Setting ==========
// First Part Use Must Choose Checkbox For Use of Strategy and Choose TP/SL by Swing or % (can choose both)
// In Detail Of Setting Are Not Too Much, Please Read The Header Of Setting Before Change The Value
// For The Indicator In List You Want To Add Just Check ✅ From MODE Setting, It's Show On Your Chart
// You Can Custom TP/SL % You Want
========== ##### No trading strategy is guaranteed to be 100% successful. ###### =========
For Example In My Systematic Trading
Select 1/3 Strategy Setting TP/SL % Match With Timeframe TP Long Are Not Set It's Can 161.8 - 423.6% but Short Position Are Not Than 100% Just Fine From Your Aset
Choose Indicators For Make Sure Trend and Strategy are the same way like Strategy are Long Position but MACD and Sto background is bear. that's mean this time not open position.
Donchian Fans is Simple Support and Ressistant If You Don't Know How To Plot That's, This indicator plot a simple for you ><.
Make Sure With Engulfing and 3 Candle Engulfing If You Don't Know, What's The Engulfing, This Indicator are plot for you too ><.
For a Big Trend You can use Ichimoku Cloud For Check Trend, Candle Upper Than Cloud or Lower Than Cloud for Bull and Bear Trend.

DataChartLibrary "DataChart"
Library to plot scatterplot or heatmaps for your own set of data samples
draw(this)
draw contents of the chart object
Parameters:
this : Chart object
Returns: current chart object
init(this)
Initialize Chart object.
Parameters:
this : Chart object to be initialized
Returns: current chart object
addSample(this, sample, trigger)
Add sample data to chart using Sample object
Parameters:
this : Chart object
sample : Sample object containing sample x and y values to be plotted
trigger : Samples are added to chart only if trigger is set to true. Default value is true
Returns: current chart object
addSample(this, x, y, trigger)
Add sample data to chart using x and y values
Parameters:
this : Chart object
x : x value of sample data
y : y value of sample data
trigger : Samples are added to chart only if trigger is set to true. Default value is true
Returns: current chart object
addPriceSample(this, priceSampleData, config)
Add price sample data - special type of sample designed to measure price displacements of events
Parameters:
this : Chart object
priceSampleData : PriceSampleData object containing event driven displacement data of x and y
config : PriceSampleConfig object containing configurations for deriving x and y from priceSampleData
Returns: current chart object
Sample
Sample data for chart
Fields:
xValue : x value of the sample data
yValue : y value of the sample data
ChartProperties
Properties of plotting chart
Fields:
title : Title of the chart
suffix : Suffix for values. It can be used to reference 10X or 4% etc. Used only if format is not format.percent
matrixSize : size of the matrix used for plotting
chartType : Can be either scatterplot or heatmap. Default is scatterplot
outliersStart : Indicates the percentile of data to filter out from the starting point to get rid of outliers
outliersEnd : Indicates the percentile of data to filter out from the ending point to get rid of outliers.
backgroundColor
plotColor : color of plots on the chart. Default is color.yellow. Only used for scatterplot type
heatmapColor : color of heatmaps on the chart. Default is color.red. Only used for heatmap type
borderColor : border color of the chart table. Default is color.yellow.
plotSize : size of scatter plots. Default is size.large
format : data representation format in tooltips. Use mintick.percent if measuring any data in terms of percent. Else, use format.mintick
showCounters : display counters which shows totals on each quadrants. These are single cell tables at the corners displaying number of occurences on each quadrant.
showTitle : display title at the top center. Uses the title string set in the properties
counterBackground : background color of counter table cells. Default is color.teal
counterTextColor : text color of counter table cells. Default is color.white
counterTextSize : size of counter table cells. Default is size.large
titleBackground : background color of chart title. Default is color.maroon
titleTextColor : text color of the chart title. Default is color.white
titleTextSize : text size of the title cell. Default is size.large
addOutliersToBorder : If set, instead of removing the outliers, it will be added to the border cells.
useCommonScale : Use common scale for both x and y. If not selected, different scales are calculated based on range of x and y values from samples. Default is set to false.
plotchar : scatter plot character. Default is set to ascii bullet.
ChartDrawing
Chart drawing objects collection
Fields:
properties : ChartProperties object which determines the type and characteristics of chart being plotted
titleTable : table containing title of the chart.
mainTable : table containing plots or heatmaps.
quadrantTables : Array of tables containing counters of all 4 quandrants
Chart
Chart type which contains all the information of chart being plotted
Fields:
properties : ChartProperties object which determines the type and characteristics of chart being plotted
samples : Array of Sample objects collected over period of time for plotting on chart.
displacements : Array containing displacement values. Both x and y values
displacementX : Array containing only X displacement values.
displacementY : Array containing only Y displacement values.
drawing : ChartDrawing object which contains all the drawing elements
PriceSampleConfig
Configs used for adding specific type of samples called PriceSamples
Fields:
duration : impact duration for which price displacement samples are calculated.
useAtrReference : Default is true. If set to true, price is measured in terms of Atr. Else is measured in terms of percentage of price.
atrLength : atrLength to be used for measuring the price based on ATR. Used only if useAtrReference is set to true.
PriceSampleData
Special type of sample called price sample. Can be used instead of basic Sample type
Fields:
trigger : consider sample only if trigger is set to true. Default is true.
source : Price source. Default is close
highSource : High price source. Default is high
lowSource : Low price source. Default is low
tr : True range value. Default is ta.tr

DiscordLibraryLibrary "DiscordLibrary"
BoldString(str)
Bold String in Discord Function
Parameters:
str
ItalicizeString(str)
Italicize String in Discord Function
Parameters:
str
StrikeThroughString(str)
Strikethrough a String in Discord Function
Parameters:
str
UnderlineString(str)
Underline a String in Discord Function
Parameters:
str
SpoilerString(str)
When you send the text, it will be shown as a black block, and only by clicking on it will you be able to see what is written below, in a way, unveiling the text or giving spoilers
Parameters:
str
HighlightString(str)
Highlight String Function
Parameters:
str
BoxedString(str)
Put String in a Box Function
Parameters:
str
NonEmbeddedURLString(str)
Format URL String so that it is not an embedded Image but just the Link
Parameters:
str
InvisibleString(str)
Send Inivisible Text
Parameters:
str
FormatTimePeriodForDiscord(_timeperiod)
Parameters:
_timeperiod
GetDiscordEmbedJSON(_message, _avatarURL, _botName, _role, _color, _embed_title, _embed_subtitle, _title, _url, _icon_url, _icon2_url, _footer, _description)
Generate discord embed JSON
Parameters:
_message
_avatarURL
_botName
_role
_color
_embed_title
_embed_subtitle
_title
_url
_icon_url
_icon2_url
_footer
_description
GetDiscordTextJSON(_description)
Formats Content Only JSON Message
Parameters:
_description
Truncate(_number, _decimalPlaces)
Custom function to truncate (cut) excess decimal places
Parameters:
_number
_decimalPlaces
FormatDiscordMessage(_textmessage, _ticker, _timeframe)
format Content message
Parameters:
_textmessage
_ticker
_timeframe
FormatCoin(_coinText)
Format Ticker Symbol
Parameters:
_coinText

Economic Calendar (Import from Spreadsheet)This script draws vertical lines to mark Economic Calendar Events.
Datetime of events is defined by user in Settings via a standardized line of text.
Motivation for coding this script:
All traders should be aware of economic calendar events. At times, when you really need to pay attention to an upcoming major event, you might even decide to use the vertical-line drawing tool to mark it. However, this takes manual effort.
This script provides a solution to performing mundane tasks such as drawing vertical lines and dragging them ever so slightly, just to have them approximately aligned with exact time.
Parameters:
(1) Source data - String representation of collection of datetime referencing to Economic Calendar Events
(2) Line color, & (3) Width of line - For displaying vertical lines drawn by script.
Standardized format for Source Data :
Example:
If 'GMT;2022,6,1,14,0,0;2022,6,2,12,15,0;' is provided to PineScript, then two vertical lines will be drawn on June 6, 2022 according to the exact time in 'YYYY,MM,DD,hh,mm,ss' format at the specified timezone (GMT in this case).
Template for Source Data :
Included here, link below, is a shared Google Sheet that systematically processes Economic Calendar data provided in the 'Raw Data' tab.
drive.google.com
Users are advised to use their preferred methods* to format the string (for source data param.), and apply their own criteria to sort down the Events. (ie. only include Events of High Impact, etc.)
* Preferred methods (as mentioned above) does not mean being limited to using the template as provided in this post.

HH-LL ZZAnother ZigZag, yes...
I believe though this concerns another angle/principle, therefore I wanted to share
How does it work?
Given:
source for level breach -> close
X breaches -> 3
Let's say this is the latest found 'lower low' (LL - blue dot under bar):
This bar has been triggered because 3 bars closed under low of previous 'trigger bar' (TB )
The high and low of this new TB will act as triggers
(aqua blue lines, seen in image above)
Then there are 2 options:
- again 3 bars closes under the latest TB , in that case the TB moves to that new LL.
- 3 bars closes higher than the high of previous TB
The high and low of this new TB act again as trigger
If a new TB LL/HH is found, the script checks previous LL/HH
and searches the highest/lowest point in between.
If necessary, the temporary highest/lowest will be adjusted:
Another example:
The last 2 points can change (repaint).
Yellow coloured lines/labels are set and won't change anymore.
Concluded:
In case of these settings:
source for level breach -> close
X breaches -> 3
once a new TB is found, the high and low act as trigger lines
- when 3 bars closes under that low , a new LL is found, this will be the new TB
- when 3 bars closes above that high , a new HH is found, this will be the new TB
and so on...
Settings:
source for level breach -> close or high/low - H/L
X breaches -> 1 -> 10
line style -> solid, dotted, dashed
show level breaches -> new found TB (blue/lime coloured)
show Support/Resistance (lines at the right)
repaint warning can be removed
show labels / lines
This ZZ can be used for Harmonic patterns, Trend evaluation, support/resistance,...
In this script, I also used new features
- text_font_family = font.family_monospace -> link
- display=display.pane -> link
Cheers!
DiscordLibraryLibrary "DiscordLibrary"
BoldString()
Bold String in Discord Function
ItalicizeString()
Italicize String in Discord Function
StrikeThroughString()
Strikethrough a String in Discord Function
UnderlineString()
Underline a String in Discord Function
SpoilerString()
When you send the text, it will be shown as a black block, and only by clicking on it will you be able to see what is written below, in a way, unveiling the text or giving spoilers
HighlightString()
Highlight String Function
BoxedString()
Put String in a Box Function
NonEmbeddedURLString()
Format URL String so that it is not an embedded Image but just the Link
InvisibleString()
Send Inivisible Text
FormatTimePeriodForDiscord()
GetDiscordEmbedJSON()
Generate discord embed JSON
GetDiscordTextJSON()
Formats Content Only JSON Message
Truncate()
Custom function to truncate (cut) excess decimal places
FormatDiscordMessage()
format Content message
FormatCoin()
Format Ticker Symbol
[blackcat] L3 RMI Trading StrategyLevel 3
Background
My view of correct usage of RSI and the relationship between RMI and RSI. A proposed RMI indicator with features is introduced
Descriptions
The Relative Strength Index (RSI) is a technical indicator that many people use. Its focus indicates the strength or weakness of a stock. In the traditional usage of this point, when the RSI is above 50, it is strong, otherwise it is weak. Above 80 is overbought, below 20 is oversold. This is what the textbook says. However, if you follow the principles in this textbook and enter the actual trading, you would lose a lot and win a little! What is the reason for this? When the RSI is greater than 50, that is, a stock enters the strong zone. At this time, the emotions of market may just be brewing, and as a result, you run away and watch others win profit. On the contrary, when RSI<20, that is, a stock enters the weak zone, you buy it. At this time, the effect of losing money is spreading. You just took over the chips that were dumped by the whales. Later, you thought that you had bought at the bottom, but found that you were in half mountainside. According to this cycle, there is a high probability that a phenomenon will occur: if you sell, price will rise, and if you buy, price will fall, who have similar experiences should quickly recall whether their RSI is used in this way. Technical indicators are weapons. It can be either a tool of bull or a sharp blade of bear. Don't learn from dogma and give it away. Trading is a game of people. There is an old saying called “people’s hearts are unpredictable”. Do you really think that there is a tool that can detect the true intentions of people’s hearts 100% of the time?
For the above problems, I suggest that improvements can be made in two aspects (in other words, once the strategy is widely spread, it is only a matter of time before it fails. The market is an adaptive and complex system, as long as it can be fully utilized under the conditions that can be used, it is not easy to use. throw or evolve):
1. RSI usage is the opposite. When a stock has undergone a deep adjustment from a high level, and the RSI has fallen from a high of more than 80 to below 50, it has turned from strong to weak, and cannot be bought in the short term. But when the RSI first moved from a low to a high of 80, it just proved that the stock was in a strong zone. There are funds in the activity, put into the stock pool.
Just wait for RSI to intervene in time when it shrinks and pulls back (before it rises when the main force washes the market). It is emphasized here that the use of RSI should be combined with trading volume, rising volume, and falling volume are all healthy performances. A callback that does not break an important moving average is a confirmed buying point or a second step back on an important moving average is a more certain buying point.
2. The RSI is changed to a more stable and adjustable RMI (Relative Momentum Indicator), which is characterized by an additional momentum parameter, which can not only be very close to the RSI performance, but also adjust the momentum parameter m when the market environment changes to ensure more A good fit for a changing market.
The Relative Momentum Index (RMI) was developed by Roger Altman and described its principles in his article in the February 1993 issue of the journal Technical Analysis of Stocks and Commodities. He developed RMI based on the RSI principle. For example, RSI is calculated from the close to yesterday's close in a period of time compared to the ups and downs, while the RMI is compared from the close to the close of m days ago. Therefore, in principle, when m=1, RSI should be equal to RMI. But it is precisely because of the addition of this m parameter that the RMI result may be smoother than the RSI.
Not much more to say, the below picture: when m=1, RMI and RSI overlap, and the result is the same.
The Shanghai 50 Index is from TradingView (m=1)
The Shanghai 50 Index is from TradingView (m=3)
The Shanghai 50 Index is from TradingView (m=5)
For this indicator function, I also make a brief introduction:
1. 50 is the strength line (white), do not operate offline, pay attention online. 80 is the warning line (yellow), indicating that the stock has entered a strong area; 90 is the lightening line (orange), once it is greater than 90 and a sell K-line pattern appears, the position will be lightened; the 95 clearing line (red) means that selling is at a climax. This is seen from the daily and weekly cycles, and small cycles may not be suitable.
2. The purple band indicates that the momentum is sufficient to hold a position, and the green band indicates that the momentum is insufficient and the position is short.
3. Divide the RMI into 7, 14, and 21 cycles. When the golden fork appears in the two resonances, a golden fork will appear to prompt you to buy, and when the two periods of resonance have a dead fork, a purple fork will appear to prompt you to sell.
4. Add top-bottom divergence judgment algorithm. Top_Div red label indicates top divergence; Bot_Div green label indicates bottom divergence. These signals are only for auxiliary judgment and are not 100% accurate.
5. This indicator needs to be combined with VOL energy, K-line shape and moving average for comprehensive judgment. It is still in its infancy, and open source is published in the TradingView community. A more complete advanced version is also considered for subsequent release (because the K-line pattern recognition algorithm is still being perfected).
Remarks
Feedbacks are appreciated.

(Quartile Vol.; Vol. Aggregation; Range US Bars; Gaps) [Kioseff]Hello!
This indicator is a multifaceted tool that's, hopefully, useful for price action and volume analysis.
(This script makes use of the newly introduced "text_font" parameter)
With this script you'll have access to:
Range US Chart
Volume Aggregation Chart
Gaps Chart
Volume by Quartile
Consequently, you'll have access to:
First Quartile Volume Threshold
Second Quartile Volume Threshold
Third Quartile Volume Threshold
90th Percentile Volume Threshold
Fourth Quartile Volume Threshold
Q2 - Q1 Dispersion
Q3 - Q2 Dispersion
Q4 - Q3 Dispersion
Quartile Deviation
Interquartile Range
Avg. "n" bar return following "high" volume
Avg. "n" bar positive return following "high" volume
Avg. "n" bar negative following "high" volume
# of Positive Returns Following a Gap
# of Negative Returns Following a Gap
# of Gaps
# of Up Gaps
# of Down Gaps
Average # of bars to fill Up Gaps
Average # of bars to dill Down Gaps
Average Gap Up % increase
Average Gap Down % decrease
Cumulative % increase of all Up Gaps
Cumulative % decrease of all Down Gaps
Sort gaps by distance from price
Hide gaps that price substantially deviates from (gaps will reappear when price trades near the gap)
Segment Range US bars by date
Manually configure Range US price thresholds
Identify "congestion" areas with Range US bars
Range US Levels that must be exceeded for a new Range US bar to produce
Manually configure cumulative volume threshold for Volume Aggregation bars
Segment Volume Aggregation bars by date
Largest Volume Aggregation bar increases
Largest Volume Aggregation bar decreases
Calculate log returns after "high" volume sessions
Quartile Volume
The Quartile Volume portion of the script segments price/volume intervals by quartile.
The image above shows features of the indicator.
For statistics, the following metrics are recorded:
First Quartile
Second Quartile
Third Quartile
90th Percentile
Fourth Quartile
Q2 - Q1 Dispersion
Q3 - Q2 Dispersion
Q4 - Q3 Dispersion
Quartile Deviation
Interquartile Range
Color-coordinated price bars (by volume quartiles)
The percent rank for the volume of the current bar
Avg. "n" bar return following "high" volume
Avg. "n" bar positive return following "high" volume
Avg. "n" bar negative following "high" volume
The script colors bars via gradient.
By default, bars are colored lime when volume for the interval is "high" (exceeds upper quartile thresholds). The greener the bar, the higher the volume for the interval.
Bars are colored red when volume for the interval is "low" (fails to exceed lower quartile thresholds). The redder the bar, the lower the volume for the interval.
Naturally, brownish-colored bars reflect a volume interval that concluded near the median.
The image above exemplifies the process. This feature might be useful to categorize / objectively define high-volume clusters, low-volume clusters, high-volume price moves, low-volume price moves, etc.
For greater precision, you can select to color bars by volume quartile they belong to.
The image above shows color-coordinated price bars. More details shown in the image.
Additionally, you can select to plot the quartile/percentile that a price bar belongs to on the chart.
The image above shows price bars numbered by the volume quartile they belong to.
The script will distinguish successive 90th percentile violations, superimpose a linear regression channel atop the data sequence, and record pertinent statistics.
The image above shows the process.
Lastly, the user can plot an anchored VWAP using a built-in time function.
The image above shows the anchored VWAP.
Range US Chart
A Range US chart operates irrespective of time and volume - simply - bars produce after a user-defined price move is achieved/exceeded in either direction. A range us chart produces “trend candles” and “reversal candles”. A reversal candle always moves against the most immediate bar; a trend candle always moves in favor of the most immediate bar. The user defines the dollar amount price must travel up/down for a trend candle to fulfill, and for a reversal candle to fulfill.
Note: if a “down reversal” candle (red) Is produced, it’s impossible for the next candle to also be a down reversal candle - for the downside move to continue the criteria for a down trend candle must be fulfilled. Similarly, if an “up reversal” candle (green) Is produced, it’s impossible for the next candle to also be an up reversal candle - for the upside move to continue, the criteria for an uptrend trend candle must be fulfilled. Consequently, Range US bars frequently trade at the same level for extended periods. This is intentional, as this chart type is theorized to “filter noise” (whether Range US charts fulfill this theory is to your discretion).
Lastly, if an up trend candle (green) is produced, the next candle cannot be up a reversal up candle - only a trend up candle or reversal down candle can produce - vice versa for a trend down candle (the subsequent candle cannot be a reversal down candle). In this sense, an uptrend continues on successive trend up candles; a down trend continues on successive trend down candles.
The image above exemplifies Range US chart functionality.
The lower-right stats table shows the requisite price move for a "Trend" candle to produce and for a "Reversal" candle to produce.
The default settings for this chart time automatically calculate the required "Trend" candle price move and the required "Reversal" candle price move. However, both settings are configurable.
The image above shows manually configured parameters for a trend bar and reversal bar to produce. This feature allows the user to replicate the Range US chart hosted on extrinsic charting platforms.
However, please consider that this script does not use tick data; 1-minute OHLC data is used for calculations.
Consequently, configuring the trend bar and reversal bar requirement too low may return inaccurate data. For instance, if you set trend candles to form after a $1 price move then trend candles will form if price moves up $1 from a green Range US bar or down $1 from a red Range US bar. This is sufficient for lower priced assets; however, if you were trading, for instance, Bitcoin - a $1 price move can happen numerous times in one minute. This script can’t plot bars and record data until a 1-minute bar closes and a new 1-minute bar opens. Further, if Bitcoin moves up $1 twenty times and down $1 twenty times in a 1-minute bar - your Range US chart will record such variations as one price move. This data is inaccurate and likely useless.
To counter this quandary, a warning message will appear if you configure trend bar price moves or reversal bar price moves too low.
The image above shows the concealable warning message.
The image above is a flow diagram (made with shaky hands) illustrating the Range US bar formation process.
A google search will return additional information on the Range US chart type.
Volume Aggregation Bars
TradingView user and member of the TradingView Discord server @ferreirajames informed me of the Volume Aggregation chart type. The user commented in the "Suggestions" channel for the TradingView Discord server asking for the Volume Aggregation chart type. As an interim fix, I tried my hand at recreating the process, which is available in this script.
Similar to the Range US chart type, Volume Aggregation bars aren’t bound to a time-axis; the bars form after a user-defined, cumulative amount of volume is achieved or exceeded. Consequently, once the cumulative amount of volume is achieved or exceeded - a bar is produced at the corresponding price level.
Underlying theory: The chat type is conducive to identifying price levels where traders are “trapped”. Whether the process adequately distinguishes this circumstance is to your discretion.
The image above exemplifies the Volume Aggregation chart type.
Regardless of the current price, Volume Aggregation bars for after a requisite amount of volume is achieved/exceeded. Tick data isn't used; therefore, remainder values are carry over.
By default, the script automatically calculates a proportional cumulative volume total to dictate the formation of Volume Aggregation bars. However, the cumulative threshold is configurable.
The image above shows Volume Aggregation bars forming subsequent a user-defined cumulative volume total being exceeded.
Note: This chart type uses OHLC data from the timeframe of your chart. Therefore, for instance, setting the volume threshold too low will produce inaccurate, useless data.
A warning message will appear for such occurrence.
Gaps
The indicator incorporates a "Gaps" chart type.
The image above shows accompanying features.
A list of all unfilled gaps is accessible - gaps for this list are sorted by distance from current price.
Partially filled gaps are displayed in the corresponding gap box - the percentage amount the gap was filled is also displayed.
Gap statistics show:
# of Gaps
# of Up Gaps
# of Down Gaps
Average # of bars to fill Up Gaps
Average # of bars to dill Down Gaps
Average Gap Up % increase
Average Gap Down % decrease
Cumulative % increase of all Up Gaps
Cumulative % decrease of all Down Gaps
Naturally, there may be gaps formed thousands of bars ago that aren't close to price. Showing these gaps on the chart will "scrunch" the y-axis and make prices indistinguishable.
I've added a setting that allows the user to hide gaps that are "n" % away from the current price. The gap, if unfilled, will reappear when price trades within the user-defined percentage.
The image above shows an example. There's an unfilled down gap that's "hidden" because the current price is a further % away from price than what I've specified in the settings (1%). When prices trade back within 1% of the gap - it will reappear.
The image above shows the process in action. Prices moved back within 1% (can be any %) of the gap; therefore, it reappeared on the chart.
You can also set the % distance a gap must achieve for it to be considered a gap, recorded and plotted. Additionally, you can select to "visualize" gaps. Similar to the Range US chart and the Volume Aggregation chart, this setting will bars reflecting the most recent sequence of gaps - date and percentage distance of the gap are superimposed atop the bar.
Let me know if there's anything else you'd like included!
Note: The initial compilation time for this script is.... high. However, once the script's compiled, calculation load times are quick and you can sift through assets and timeframes relatively quick.
There's also a setting to "Improve Load Times" in the user-inputs table. This setting only improves the load times for post-compilation calculations and plots. The initial compilation load time is unchanged. Simply, once the indicator has "first loaded", all subsequent loads are quick.
Thank you! (:

Annual Returns % Comparison [By MUQWISHI]Overview
The Annual Returns % Comparison indicator aimed to compare the historical annual percentage change of any two symbols. The indicator output shows a column-plot that was developed by two using a pine script table, so each period has pair columns showing the yearly percentage change for entered symbols.
Features
- Enter date range.
- Fill up with any two symbols.
- Choose the output data whether adjusted or not.
- Change the location of the table plot
- Color columns by a symbol.
- Size the height and width of columns.
- Color background, border, and text.
- The tooltip of the column value appears once the cursor sets above the specific column. As it seen below.
Let me know if you have any questions.
Thanks.

Futures Exchange Sessions 2.0Description
Successor to Futures Exchange Sessions indicator. Completely rebuilt code from the ground up. Every feature has been redesigned and refactored to be the most beneficial while allowing for complete configuration by the user.
This indicator displays Futures Sessions as live boxes that expand dynamically as price moves over the time interval. These boxes make liquidity levels extremely easy to spot and visualize. It helps the user identify market structure and develop their own bias of price action. Everything about the Session boxes can be configured. Box color, border color, border style, and border width are all individually controllable. Each Future Session can be turned on or off at any time. Also, each box has their own text label (Asian Session, London Session, New York Session) and this text can be moved around the box, change color, and change size.
Previous days highs and lows (major liquidity levels) are always important to the futures trader. This indicator now allows the user to individually display the three previous days highs and low levels as lines with optional label. Each line can be independently toggled on or off and like always, every conceivable customization option is available to the user. And the labels can be moved to the right (via the Input Settings) to allow unobstructed views of candles.
The midnight EST open and 8:30 AM EST open horizontal lines (developed by the Inner Circle Trader) are returning in this indicator. But the biggest improvement is that the lines stop at the current bar or the last bar of the trading day. Additionally, the time lines are displayed on previous days so the user can easily see how the candles reacted to these important times of the day.
The Session boxes and the horizontal time lines now can be set to only display a certain number of day back. If the user wants just to see Session boxes for the previous day only, they can do that. If the user wants to see the last 15 days of boxes or lines it is very easy to increase the days back in the settings. Currently, the max days back is 80 calendar days.
Additional Images
Easily visualize and understand price action across time
Everything is customizable so the user can easily match this indicator to their color preferences
Special Notes
To turn off box session text set opacity to 0%
Boxes and horizontal time lines only display when timeframe is <= 30 minute

Template Trailing Strategy (Backtester)💭 Overview
+ Title: Template Trailing Strategy (Backtester)
+ Author: Iason Nikolas (jason5480)
+ License: CC BY-NC-SA 4.0
💢 What is the "Template Trailing Strategy (Backtester)" ❓
The "Template Trailing Strategy (Backtester)" (TTS) is a back-tester orchestration framework. It supercharges the implementation-test-evaluation lifecycle of new trading strategies, by making it possible to plug in your own trading idea.
While TTS offers a vast number of configuration settings, it primarily allows the trader to:
Test and evaluate your own trading logic that is described in terms of entry, exit, and cancellation conditions.
Define the entry and exit order types as well as their target prices when the limit, stop, or stop-limit order types are used.
Utilize a variety of options regarding the placement of the stop-loss and take-profit target(s) prices and support for well-known techniques like moving to breakeven and trailing.
Provide well-known quantity calculation methods to properly handle risk management and easily evaluate trading strategies and compare them.
Alert on each trading event or any related change through a robust and fully customizable messaging system.
All of the above makes TTS a practical toolkit: once you learn it, many repetitive tasks that strategy authors usually re-implement are eliminated. Using TradingView’s built-in backtesting engine makes testing and comparing ideas straightforward.
By utilizing the TTS one can easily swap "trading logic" by testing, evaluating, and comparing each trading idea and/or individual component of a strategy.
Finally, TTS, through its per-event alert management (and debugging) system, provides an automated solution that supports live trading with brokers via webhooks.
NOTE: The "Template Trailing Strategy (Backtester)" does not dictate how you can combine different indicator types. Thus, it should not be confused as a "Trading System", because it gives its user full flexibility on that end (for better or worse).
💢 What is a "Signal Indicator" ❓
"Signal Indicator" (SI) is an indicator that can output a "signal" that follows a specific convention so that the "Template Trailing Strategy (Backtester)" can "understand" and execute the orders accordingly. The SI realizes the core trading logic signaling to the TTS when to enter, exit, or cancel an order. A SI instructs the TTS "when" to enter or exit, and the TTS determines "how" to enter and exit the position once the Signal Indicator generates a signal.
A very simple example of a Signal Indicator might be a 200-day Simple Moving Average Signal. When the price of the security closes above the 200-day SMA, a SI would provide TTS with a "long entry signal". Once TTS receives the "long entry signal", the TTS will open a long position and send an alert or automated trade message via webhook to a broker, based on the Entry settings defined in TTS. If the TTS Entry settings specify a "Market" order type, then the open long position will be executed by TTS immediately. But if the TTS Entry settings specify a "Stop" order type with a 1% Stop Distance, then when the price of the security rises by 1% after the "long entry signal" occurs, the TTS will open a long position and the Long Entry alert or webhook to the broker will be sent.
🤔 How to Guide
💢 How to connect a "signal" from a "Signal Indicator" ❓
The "Template Trailing Strategy (Backtester)" was designed to receive external signals from a "Signal Indicator". In this way, a "new trading idea" can be developed, configured, and evaluated separately from the TTS. Similarly, the SI can be held constant, and the trading mechanics can change in the TTS settings and back-tested to answer questions such as, "Am I better with a different stop loss placement method, what if I used a limit order instead of a stop order to enter, what if I used 25% margin instead of trading spot market?"
To make that possible by connecting an external signal indicator to TTS, you should:
Add both your SI (e.g. "Two MA Signal Indicator" , "Click Signal Indicator" , "Signal Adapter" , "Signal Composer" ) and the TTS script to the same chart.
Open the script's Settings / Inputs dialog for the TTS.
In the 🛠️ STRATEGY group set 𝐃𝐞𝐚𝐥 𝐂𝐨𝐧𝐝𝐢𝐨𝐧𝐬 𝐌𝐨𝐝𝐞 to 🔨External (this makes TTS listen to an external signal source).
Still inside 🛠️ STRATEGY locate the 🔌𝐒𝐢𝐠𝐧𝐚𝐥 🛈 input and choose the plotted output of your SI. The option should look like: "<SI short title>:🔌Signal to TTS" .
Verbose troubleshooting & tips
If the SI does not appear in the 🔌Signal 🛈 selector, confirm both scripts are added to the same chart and the SI exposes a plotted series (title often "🔌Signal to TTS").
When using multiple SIs, pick the SI instance that actually outputs the "🔌Signal to TTS" plotted series.
Validate on the chart: when your SI changes state, the plotted "🔌Signal" series in the TTS (visible in the data window) should change accordingly.
The TTS accepts only signals that follow the tts_convention DealConditions structure. Do not attempt to feed arbitrary scalar series without using conv.getDealConditions / conv.DealConditions.
Make sure your SI composes a DealConditions value following the TTS convention (startLong, endLong, startShort, endShort — optional cancel fields). See the template below.
If the plot is present but TTS does not react, ensure the SI plot is non-repainting (or accept realtime/backtest limitations). Test on historical bars first.
Create alerts on the strategy (see the Alerts section). Use the {{strategy.order.alert_message}} placeholder in the Create Alert dialog to forward TTS messages.
💢 How to create a custom trading logic ❓
The "Template Trailing Strategy (Backtester)" provides two ways to plug in your custom trading logic. Both of them have their advantages and disadvantages.
✍️ Develop your own Customized "Signal Indicator" 💥
The first approach is meant to be used for relatively more complex trading logic. The advantages of this approach are the full control and customization you have over the trading logic and the relatively simple configuration setup by having two scripts only. The downsides are that you have to have some experience with pinescript or you are willing to learn and experiment. You should also know the exact formula for every indicator you will use since you have to write it by yourself. Copy-pasting from existing open-source indicators will get you started quite fast though.
The idea here is either to create a new indicator script from scratch or to copy an existing non-signal indicator and make it a "Signal Indicator". To create a new script, press the "Pine Editor" button below the chart to open the "Pine Editor" and then press the "Open" button to open the drop-down menu with the templates. Select the "New Indicator" option. Add it to your chart to copy an existing indicator and press the source code {} button. Its source code will be shown in the "Pine Editor" with a warning on top stating that this is a read-only script. Press the "create a working copy". Now you can give a descriptive title and a short title to your script, and you can work on (or copy-paste) the (other) indicators of your interest. Once you have the information needed to decide, define a DealConditions object and plot it like this:
import jason5480/tts_convention/ as conv
// Calculate the start, end, cancel start, cancel end conditions
dealConditions = conv.DealConditions.new(
startLongDeal = ,
startShortDeal = ,
endLongDeal = ,
endShortDeal = ,
cnlStartLongDeal = ,
cnlStartShortDeal = ,
cnlEndLongDeal = ,
cnlEndShortDeal = )
// Use this signal in scripts like "Template Trailing Strategy (Backtester)" and "Signal Composer" that can utilize its value
// Emit the current signal value according to the TTS framework convention
plot(series = conv.getSignal(dealConditions), title = '🔌Signal to TTS', color = #808000, editable = false, display = display.data_window + display.status_line, precision = 0)
You should import the latest version of the tts_convention library and write your deal conditions appropriately based on your trading logic and put them in the code section shown above by replacing the "…" part after "=". You can omit the conditions that are not relevant to your logic. For example, if you use only market orders for entering and exiting your positions the cnlStartLongDeal, cnlStartShortDeal, cnlEndLongDeal, and cnlEndShortDeal are irrelevant to your case and can be safely omitted from the DealConditions object. After successfully compiling your new custom SI script add it to the same chart with the TTS by pressing the "Add to chart" button. If all goes well, you will be able to connect your "signal" to the TTS as described in the "How to connect a "signal" from a "Signal Indicator"?" guide.
🧩 Adapt and Combine existing non-signal indicators 💥
The second approach is meant to be used for relatively simple trading logic. The advantages of this approach are the lack of pine script and coding experience needed and the fact that it can be used with closed-source indicators as long as the decision-making part is displayed as a line in the chart. The drawback is that you have to have a subscription that supports the "indicator on indicator" feature so you can connect the output of one indicator as an input to another indicator. Please check if your plan supports that feature here
To plug in your own logic that way you have to add your indicator(s) of preference in the chart and then add the "Signal Adapter" script in the same chart as well. This script is a "Signal Indicator" that can be used as a proxy to define your custom logic in the CONDITIONS group of the "Settings/Inputs" tab after defining your inputs from your preferred indicators in the VARIABLES group. Then a "signal" will be produced, if your logic is simple enough it can be directly connected to the TTS that is also added to the same chart for execution. Check the "How to connect a "signal" from a "Signal Indicator"?" in the "🤔 How to Guide" for more information.
If your logic is slightly more complicated, you can add a second "Signal Adapter" in your chart. Then you should add the "Signal Composer" in the same chart, go to the SIGNALS group of the "Settings/Inputs" tab, and connect the "signals" from the "Signal Adapters". "Signal Composer" is also a SI so its composed "signal" can be connected to the TTS the same way it is described in the "How to connect a "signal" from a "Signal Indicator"?" guide.
At this point, due to the composability of the framework, you can add an arbitrary number (bounded by your subscription of course) of "Signal Adapters" and "Signal Composers" before connecting the final "signal" to the TTS.
💢 How to set up ⏰Alerts ❓
The "Template Trailing Strategy (Backtester)" provides a fully customizable per-event alert mechanism. This means that you may have an entirely different message for entering and exiting into a position, hitting a stop-loss or a take-profit target, changing trailing targets, etc. There are no restrictions, and this gives you great flexibility.
First enable the events you want under the "🔔 ALERT MESSAGES" module. Each enabled event exposes a text area where you can craft the message using placeholders that TTS replaces with actual values when the event occurs.
The placeholder categories (exact names used by the script) are:
Chart & instrument:
{{ticker}}
{{base_currency}}
{{quote_currency}}
Entry / exit / stop / TP prices & offsets:
{{entry_price}}
{{exit_price}}
{{stop_loss_price}}
{{take_profit_price_1}} ... {{take_profit_price_5}}
{{entry+_price}}, {{entry-_price}}, {{exit+_price}}, {{exit-_price}} — Optional offset helpers (computed using "Offset Ticks")
Quantities, percents & derived quantities:
{{entry_base_quantity}} — base units at entry (e.g. BTC)
{{entry_quote_quantity}} — quote amount at entry (e.g. USD)
{{risk_perc}} — % of capital risked for that entry (multiplied by 100 when "Percentage Range " is enabled)
{{remaining_quantity_perc}} — % of the initial position remaining at close/SL
{{remaining_base_quantity}} — remaining base units at close/SL
{{take_profit_quantity_perc_1}} ... {{take_profit_quantity_perc_5}} — % sold/bought at each TP
{{take_profit_base_quantity_1}} ... {{take_profit_base_quantity_5}} — base units closed at each TP
❗ Important: the per-event alert text is injected into the Create Alert dialog using TradingView's strategy placeholder:
{{strategy.order.alert_message}}
During the creation of a strategy alert, make sure the placeholder {{strategy.order.alert_message}} exists in the "Message" box. TradingView will substitute the per-event text you configured and enabled in TTS Settings/Inputs before sending it via webhook/notification.
Tip: For webhook/broker execution, set the proper "Condition" in the Create Alert dialog (for changing-entry/exit/SL notifications use "Order fills and alert() function calls" or "alert() function calls only" as appropriate).
💢 How to execute my orders in a broker ❓
To execute your orders in a broker that supports webhook integration, you should enable the appropriate alerts in the "Template Trailing Strategy (Backtester)" first (see the "How to set up Alerts?" guide above). Then you should go to the "Create Alert/Notifications" tab check the "Webhook URL" and paste the URL provided by your broker. You have to read the documentation of your broker for more information on what messages are expected.
Keep in mind that some brokers have deep integration with TradingView so a per-event alert approach might be overkill.
📑 Definitions
This section tries to give some definitions in terms that appear in the "Settings/Inputs" tab of the "Template Trailing Strategy (Backtester)"
💢 What is Trailing ❓
Trailing is a technique where a price target follows another "barrier" price (usually high or low) by trying to keep a maximum distance from the "barrier" when it moves in only one direction (up or down). When the "barrier" moves in the other direction the price target will not change. There are as many types of trailing as price targets, which means that there are entry trailing, exit trailing, stop-loss trailing, and take-profit trailing techniques.
💢 What is a Moonbag ❓
A Moonbag in a trade is the quantity of the position that is reserved and will not be exited even if all take-profit targets defined in the strategy are hit, the quantity will be exited only if the stop-loss is hit or a close signal is received. This makes the stop-loss trailing technique in a trend-following strategy a good candidate to take advantage of a Moonbag.
💢 What is Distance ❓
Distance is the difference between two prices.
💢 What is Bias ❓
Bias is a psychological phenomenon where you make decisions based on market sentiment. For example, when you want to enter a long position you have a long bias, and when you want to exit from the long position you have a short bias. It is the other way around for the short position.
💢 What is the Bias Distance of a price target ❓
The Bias Distance of a price target is the distance that the target will deviate from its initial price. The direction of this deviation depends on the bias of the market. For example, suppose you are in a long position, and you set a take-profit target to the local highest high. In that case, adding a bias distance of five ticks will place your take-profit target 5 ticks below this local highest high because you have a short bias when exiting a long position. When the bias is long the bias distance will be added resulting in a higher target price and when you have a short bias the bias distance will be subtracted.
⚙️ Settings
In the "Settings/Inputs" tab of the "Template Trailing Strategy (Backtester)", you can find all the customizable settings that are provided by the framework. The variety of those settings is vast; hence we will only scratch the surface here. However, for every setting, there is an information icon 🛈 where you can learn more if you mouse over it. The "Settings/Inputs" tab is divided into ten main groups. Each one of them is responsible for one module of the framework. Every setting is part of a group that is named after the module it represents. So, to spot the module of a setting find the title that appears above it comes with an emoji and uppercase letters. Some settings might have the same name but belong to different modules e.g. "Tgt Dist Mtd" (Target Distance Method). Some settings are indented, which means that they are closely related to the non-indented setting above. Usually, indented settings provide further configuration for one or more options of the non-indented setting above. The groups that correspond to each module of the framework are the following:
🗺️ Quick Module Cross-Reference (use emojis to jump to setting groups)
📆 FILTERS — session, date & weekday filters
🛠️ STRATEGY — internal vs external deal-conditions; pick the signal source
🔧 STRATEGY – INTERNAL — built-in Two MA logic for demonstration purposes
🎢 VOLATILITY — ATR / StDev update modes
🔷 ENTRY — entry order types & trailing
🎯 TAKE PROFIT — multi-step TP and trailing rules
🛑 STOP LOSS — stop placement, move-to-breakeven, trailing
🟪 EXIT — exit order types & cancel logic
💰 QUANTITY/RISK MANAGEMENT — position sizing, moonbag, limits
📊 ANALYTICS — stats, streaks, seasonal tables
🔔 ALERT MESSAGES — per-event alert templates & placeholders
😲 Caveats
💢 Does "Template Trailing Strategy (Backtester)" have repainting behavior? ❓
The answer is that the "Template Trailing Strategy (Backtester)" does not repaint as long as the "Signal Indicator" that is connected also does not repaint. If you developed your own SI make sure that you understand and know how to prevent this behavior. The publication by @PineCoders here will give you a good idea on how to avoid most of the repainting cases.
⚠️ There is an exception though, when the "Enable Trail⚠️💹" checkbox is checked, the Take Profit trailing feature is enabled, and a tick-based approach is used, meaning that after a while, when the TradingView discards all the real-time data, assumptions will be made by the backtesting engine that will cause a form of repainting. To avoid making false assumptions please disable this feature in the early stages and evaluate its usefulness in your strategy later on, after first confirming the success of the logic without this feature. In this case, consider turning on the bar magnifier feature. This way you will get more accurate backtest results when the Take Profit trailing feature is enabled.
💢 Can "Template Trailing Strategy (Backtester)" satisfy all my trading strategies ❓
While this framework can satisfy quite a large number of trading strategies there are cases where it cannot do so. For example, if you have a custom logic for your stop-loss or take-profit placement, or if you want to dollar cost average, then it might be better to start a new strategy script from scratch.
⚠️ It is not recommended to copy the official TTS code and start developing unless you are a Pine wizard! Even in that case, there is a stiff learning curve that might not be worth your time. Last, you must consider that I do not offer support for customized versions of the TTS script and if something goes wrong in the process you are all alone.
💝 Support & Feedback
For feedback, bug reports, or feature requests, contact me via TradingView PM or use the script comments.
Note: The author's personal links and contact are available on the TradingView profile.
🤗 Thanks
Special thanks to the welcoming community members, who regularly gave feedback all those years and helped me to shape the framework as it is today! Thanks everyone who contributed by either filing a "defect report" or asking questions that helped me to understand what improvements were necessary to help traders.
Enjoy!
Jason

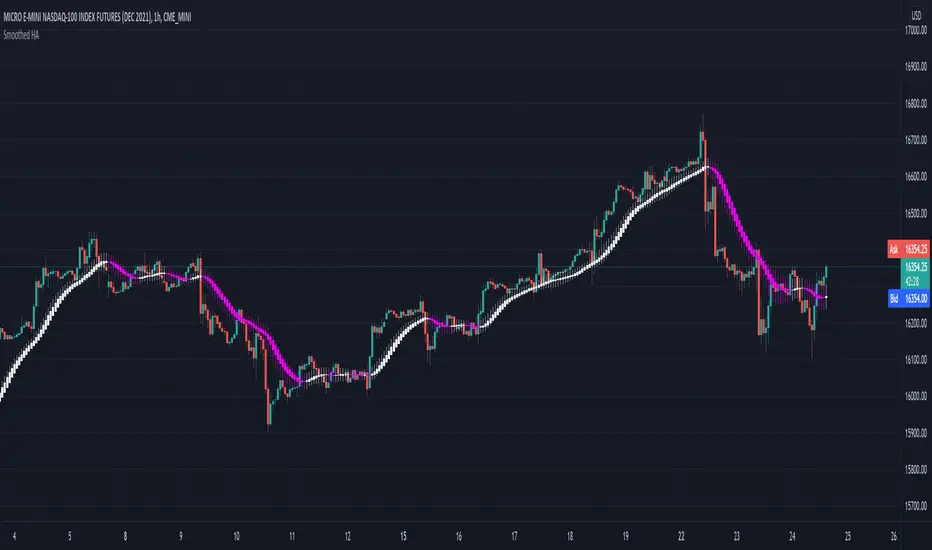
Smoothed Heiken Ashi - SamXThis is my version of the Smoothed Heiken Ashi indicator. While there are a few versions of these out there (most notably "Modified Smoothed Heiken Ashi" by badshah_e_alam and "Smoothed Heiken Ashi Candles v1" by jackvmk), none matched what I was looking for.
1. All had hard-coded the smoothing to use the EMA calculation - in this indicator, these are user-configurable
2. Both applied the double-smoothing principle (Take a moving-average of price, apply the Heiken Ashi conversion, then apply a second moving average to the smoothed Heiken Ashi candles to calculate new candles). While this is the most common approach, I had a few issues with this:
Even if setting both moving average lengths to 1, the indicator did not correctly calculate what should be the actual corresponding Heiken Ashi candle values (as compared to the built-in Heiken Ashi chart on Tradingview)
They were inconsistent in operating on different chart types - indicator values for the same candle can differ between using a base Heiken Ashi or Renko chart vs a standard Candle or Bar chart.
I wanted the ability to easily enable/disable the second smoothing (which is now a configuration option)
I wanted the ability to configure different moving-average calculations for each smoothing iteration (e.g. EMA for the initial smoothing, and Smoothed Moving Average for the second smoothing)
3. Many of the inputs were not clearly or properly defined in the settings window - this script has far more refined user input settings, put in logical groupings, and with relevant help text.
4. Enhanced some visual styling (and added to the Settings) to make it easier for the user to enable/disable printing candle wicks, as well as customizing the bullish / bearish bar colors
5. Added alerts for bar color change to help users catch potential trend reversals
Reference paper on the original Smoothed HA formulas: www.researchgate.net
Reference on the more common implementation formulas (using double-smoothing): www.sierrachart.com
Higher Time Frame Chart OverlayHello All,
This script gets OHLC values from any security and Higher/Same time frame you set, then creates the chart including last 10 candles. it shows Symbol name, Time Frame, Highest/Lowest level of last 10 candles and Close Price at the right side of the chart as well. Closing price text color changes by the real-time candle of the related symbol and time frame. The all this was made using the Tables in Pine and the chart location doesn't change even if you change the size of main chart window.
Almost everything can be change as you want. You can change/set:
- Colors of Body and Top/Bottom Wicks separately
- The Height of each Cell
- The Width of Body and Wicks
- The Background and Frame color
- Enable/disable Status Panel (if you disable Status Panel then only candle chart is shown)
- Location of Status Panel
- Text color and Text size
- The Background color of Status Panel
Some examples:
The info shown in Status Panel:
You can change The Height of each Cell and The Width of Body and Wicks
You can change colors:
You can change location of the chart:
If you add the script more than once then you can see the charts for different symbols and time frames: (This may slow down your chart)
If you right-click on the script and choose "Visual Order" => "Bring to front" then it will be better visually:
P.S. Using this script may slow down your chart, especially if you add it more than once
Enjoy!

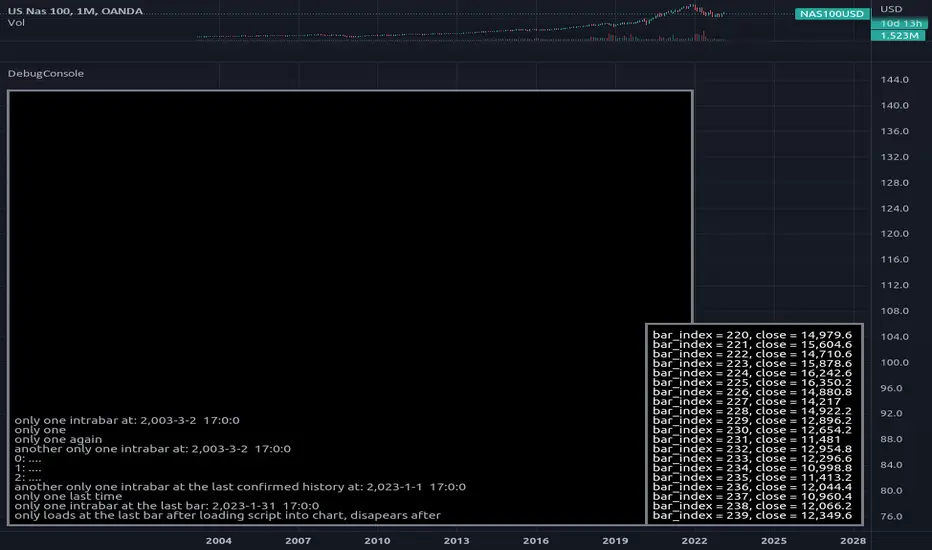
DebugConsoleLibrary "DebugConsole"
Methods for debuging/output into a table, console like style.
init(size) initiate property variables.
Parameters:
size : int, console line size.
Returns: tuple, table and string array.
queue(console_id, new_line) Regular Queue, will be called once every bar its called.
Parameters:
console_id : string array, console configuration array.
new_line : string, with contents for new line.
Returns: void.
queue_one(console_id, new_line) Queue only one time, will not repeat itself.
Parameters:
console_id : string array, console configuration array.
new_line : string, with contents for new line.
Returns: void.
update(table_id, console_id) Update method for the console screen.
Parameters:
table_id : table, table to update console text.
console_id : string array, console configuration array.
Returns: void.
Gain/StopLoss Percentage LinesGain/StopLoss Percentage Lines is a quick way to enter your Entry Price in to a stock and track the percentage of gain or loss at the 5% and 10% markers.
Click on the gear settings icon and type in your entry price. The percentage is defaulted to 5%. You can change this to a different percentage at this screen. Note that whatever number you enter will be doubled for the upper and lower lines. For instance, if you want to set your first red line stop loss and green gain line at 2.5%, your two other upper and lower green and red lines will be at 5%.
However, this will not change the text on the tab marker.
To change the tab text, go in to the Pine Editor and change the green text that says "5% Gain" and "5% Loss" to your new percentages.

Doji Hunter█ OVERVIEW
This script is built to search for 8 different Doji candlestick patterns in markets and makes them appear on screen with bar coloring and creating color-coded labels/shapes. It will identify the following variants based upon user input for various rules to abide by:
Gapping Up
Gapping Down
Gravestone
Dragonfly
Long-Legged
Rickshaw Man
Northern (Doji in uptrend)
Southern (Doji in downtrend)
Note: for the remainder of this description, the types for inputs will be marked by italic text.
█ OPTIONS
This script features a wide range of options available to the user to modify how it functions. The first set of inputs dictate how the trend analysis is done with moving averages. The second and third sets of inputs dictate specific rules for how Doji candles are analyzed and the colors used for when they appear.
█ INPUTS (short)
1 — Moving Average Rules:
The Northern and Southern Doji variants require some trend analysis which will be done by Moving Averages. The inputs in this section change various things about the moving average(s) to be used. In the second section of inputs, there is one boolean option that will nullify the need for trend detection and consolidates the Northern and Southern Doji variants into one.
2/3 — Doji Rules and Colors:
The next two sections of inputs correspond to the various rules that dictate how various doji variants will be analyzed, as well as the colors that correspond to each variant. The colors will also apply to each of the labels/shapes used.
4 — Diagnostics:
The last boolean will allow the user to see extra detail with regards to how and when dojis are detected. Note: This is not a part of any prior section and is simply included as a last functional item to the list of all inputs.
An example of multiple labels being shown on screen for various types of Dojis (DJI 1D chart):
█ INPUTS (extended)
1 — Moving Average Rules:
This section consists of 10 different inputs specific to the rules on how the moving average functions for trend analysis.
"Trend Rule" ( string list) determines which Moving Average will be used for trend detection. It has 3 options: "MA 1", "MA 2", or "BOTH". The second input "Trend Source" determines which OHLC (or combination) value to use in comparison to either MA 1 or MA 2 (EX: Trend Rule -> "MA 1" and Trend Source -> "close": if close > MA 1 -> uptrend, downtrend otherwise). If "BOTH" is selected then "Trend Source" is ignored and added nuance in the script ensures that the shorter MA being above the longer MA yields an uptrend (downtrend otherwise).
The next 8 inputs focus on 4 different parts of both MA 1 and 2.
Length ( integer(s) )
Color
Switch between SMA/EMA ( boolean(s) )
Source for MA
Note: Additional attention to detail has been made here as trend direction is ignored if "BOTH" is selected for the MA Rules and the lengths of both Moving Averages are set to be the same.
2/3 — Doji Rules and Colors:
The next two sections include 19 inputs that are related to how this script will analyze and identify the different variants of Doji candles.
"Identify Pattern On Close" ( boolean ) modifies which candles are to be used for determining when Doji candles are recognized. This changes an offset used for historical reference on some global variables which will force the script to only identify patterns after the current candle has closed.
"Doji Body Tolerance" ( float ) tells the script the maximum % the candle body may be of the high-low range to be considered a Doji candle.
"Doji Wick Sample" ( integer ) defines how many prior candles to sample from in calculating the current average upper and lower wick sizes.
"Simplify Northern/Southern Dojis" ( boolean ) makes this script ignore trend direction for Doji detection and consolidates Northern and Southern Dojis into being recognized as the same. This has an added effect of removing the plotted moving averages from the screen.
"Northern/Southern Display" ( string list ) that has multiple options for how Northern and Southern Dojis will be displayed on screen. Because of how labels may be extremely taxing on TradingView's servers to display, the default setting is "shapes" where Northern and Southern (N/S) Dojis will be marked with a colored triangle at the top of the candle. If "Simplify Northern/Southern Dojis" is true, all N/S Dojis will be marked with an x-cross instead. Other options include "labels" which enables the use of labels accompanied by their respective tooltip and color, or "none" where N/S Dojis will be only noticeable by their changed barcolor.
"Allow Gravestone/Dragonfly Shadows" ( boolean ) allows a bit of additional nuance to the definition of Gravestone or Dragonfly Dojis with small shadows.
"Gravestone/Dragonfly Shadow Tolerance" ( float ) defines the maximum % that the lower wick/upper wick (respectively) may be relative to the high-low range for Gravestone or Dragonfly Dojis to still be considered valid.
"Doji Long Wick Setting" ( string list) is a list of settings for three different ways of confirming if a Doji is Long-Legged. The settings are "one", "two", and "average". These define how many wick lengths of a candle need to exceed the calculated average wick lengths (EX: "both" -> upper wick length > upper wick average and lower wick length > lower wick average). The "average" setting will combine the lengths of both wicks and both prior wick averages, divide both of these sums by 2 and compare them instead.
"Doji Long Wick Tolerance" ( float ) defines how large compared to the averages that wick lengths need to be in order for them to be considered "Long-Legged" (EX: 1.50 -> upper/lower wick needs to exceed 150% the average of previous upper/lower wicks).
"Rickshaw Man Body Placement Tolerance" ( float ) defines how close to the high-low range's midpoint the candle body's midpoint needs to be in order for it to be considered a Rickshaw Man Doji candle instead.
The remaining 9 inputs define the colors to use for differentiating between all Doji variants this script will recognize.
█ USAGE
My hope for this script is that users find this easy to use/understand and will tinker with the input values to better identify Doji candlesticks across a wide range of markets.
Suggestions for changes in the future are welcome.
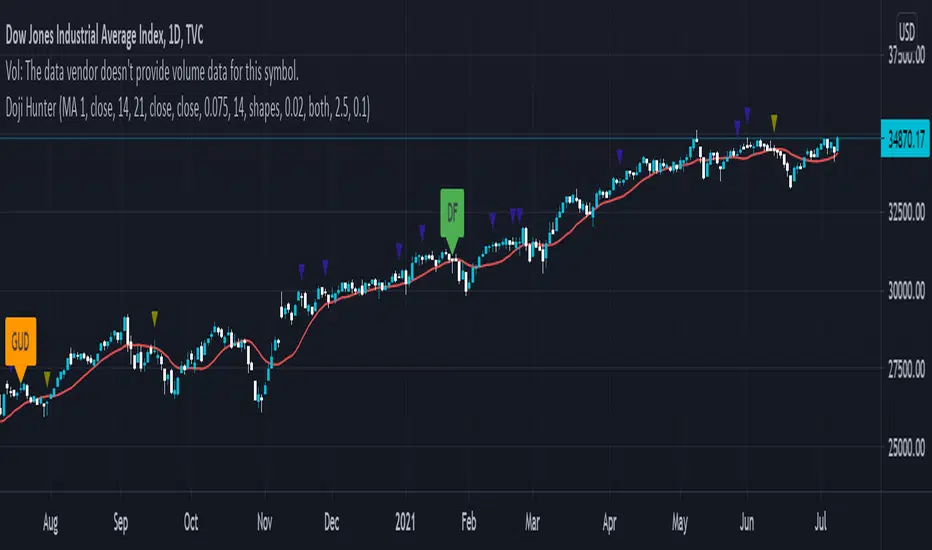
Logging in Pine ScriptI'm building quite a lot of pretty complicated indicators/strategies in Pine Script. Quite often they don't work from the 1 try so I have to debug them heavily.
In Pine Script there are no fancy debuggers so you have to be creative. You can plot values on your screens, check them in the data window, etc.
If you want to display some textual information, you can plot some info as labels on the screen.
It's not the most convenient way, so with the appearance of tables in Pine Script, I decided to implement a custom logger that will allow me to track some useful information about my indicator over time.
Tables work much better for this kind of thing than labels. They're attached to your screen, you can nicely scale them and you can style them much better.
The idea behind it is very simple. I used few arrays to store the message, bar number, timestamp, and type of the message (you can color messages depend on the type for example).
There is a function log_msg that just append new messages to these arrays.
In the end, for the last bar, I create the table and display the last X messages in it.
In parameters, you can show/hide the entire journal, change the number of messages displayed and choose an offset. With offset, you can basically scroll through the history of messages.
Currently, I implemented 3 types of messages, and I color messages according to these types:
Message - gray
Warning - yellow
Error - red
Of course, it's a pretty simple example, you can create a much fancier way of styling your logs.
What do you think about it? Is it useful for you? What do you use to debug code in Pine Script?
Disclaimer
Please remember that past performance may not be indicative of future results.
Due to various factors, including changing market conditions, the strategy may no longer perform as good as in historical backtesting.
This post and the script don’t provide any financial advice.

Hull MA with BB (With Alerts)This is a combination of the standard Bollinger bands with a VWAP(Pink line), and the 'Hull Trend with Kahlman' script by user capissimo, and the NMA (Moving Average 3.0 (3rd Generation)) script by everget.
You can find the original scripts here:
This indicator gives you several confirmations of a good entry and exit positions for Crypto currency like bitcoin and most alt coins. I use this on a 15min, 30min, 1hour, and 4hour chart for best results.
How to use:
Entry Signals:
-A candle closes above the NMA (Yellow Step Line). AND
-You see a Long (text) flag. AND
-The candles are near the bottom of the Bollinger bands and heading upwards.
Exit Signals:
-Candles have passed below and closed below the NMA (Yellow Step Line). AND
-You see a Short (text) flag.
It's important to use these confirmations with other indicators so you have the best entry/exit positions, and make sure you are on normal candles and not HA or any other types.
There are alerts built in that you can setup for the Short and Long text flags that you see. These are generally good alerts to follow. I use the alerts as a reminder to check the charts and see if my other indicators line up for a good trade.
