AI Trading Alerts v6 — SL/TP + Confidence + Panel (Fixed)Overview
This Pine Script is designed to identify high-probability trading opportunities in Forex, commodities, and crypto markets. It combines EMA trend filters, RSI, and Stochastic RSI, with automatic stop-loss (SL) & take-profit (TP) suggestions, and provides a confidence panel to quickly assess the trade setup strength.
It also includes TradingView alert conditions so you can set up notifications for Long/Short setups and EMA crosses.
⚙️ Features
EMA Trend Filter
Uses EMA 50, 100, 200 for trend confirmation.
Bull trend = EMA50 > EMA100 > EMA200
Bear trend = EMA50 < EMA100 < EMA200
RSI Filter
Bullish trades require RSI > 50
Bearish trades require RSI < 50
Stochastic RSI Filter
Prevents entries during overbought/oversold extremes.
Bullish entry only if %K and %D < 80
Bearish entry only if %K and %D > 20
EMA Proximity Check
Price must be near EMA50 (within ATR × adjustable multiplier).
Signals
Continuation Signals:
Long if all bullish conditions align.
Short if all bearish conditions align.
Cross Events:
Long Cross when price crosses above EMA50 in bull trend.
Short Cross when price crosses below EMA50 in bear trend.
Automatic SL/TP Suggestions
SL size adjusts depending on asset:
Gold/Silver (XAU/XAG): 5 pts
Bitcoin/Ethereum: 100 pts
FX pairs (default): 20 pts
TP = SL × Risk:Reward ratio (default 1:2).
Confidence Score (0–4)
Based on conditions met (trend, RSI, Stoch, EMA proximity).
Labels:
Strongest (4/4)
Strong (3/4)
Medium (2/4)
Low (1/4)
Visual Panel on Chart
Shows ✅/❌ for each condition (trend, RSI, Stoch, EMA proximity, signal now).
Confidence row with color-coded strength.
Alerts
Long Setup
Short Setup
Long Cross
Short Cross
🖥️ How to Use
1. Add the Script
Open TradingView → Pine Editor.
Paste the full script.
Click Add to chart.
Save as "AI Trading Alerts v6 — SL/TP + Confidence + Panel".
2. Configure Inputs
EMA Lengths: Default 50/100/200 (works well for swing trading).
RSI Length: 14 (standard).
Stochastic Length/K/D: Default 14/3/3.
Risk:Reward Ratio: Default 2.0 (can change to 1.5, 3.0, etc.).
EMA Proximity Threshold: Default 0.20 × ATR (adjust to be stricter/looser).
3. Read the Panel
Top-right of chart, you’ll see ✅ or ❌ for:
Trend → Are EMAs aligned?
RSI → Above 50 (bull) or below 50 (bear)?
Stoch OK → Not extreme?
Near EMA50 → Close enough to EMA50?
Above/Below OK → Price position vs. EMA50 matches trend?
Signal Now → Entry triggered?
Confidence row:
🟢 Green = Strongest
🟩 Light green = Strong
🟧 Orange = Medium
🟨 Yellow = Low
⬜ Gray = None
4. Alerts Setup
Go to TradingView Alerts (⏰ icon).
Choose the script under “Condition”.
Select alert type:
Long Setup
Short Setup
Long Cross
Short Cross
Set notification method (popup, sound, email, mobile).
Click Create.
Now TradingView will notify you automatically when signals appear.
5. Example Workflow
Wait for Confidence = Strong/Strongest.
Check if market session supports volatility (e.g., XAU in London/NY).
Review SL/TP suggestions:
Long → Entry: current price, SL: close - risk_pts, TP: close + risk_pts × RR.
Short → Entry: current price, SL: close + risk_pts, TP: close - risk_pts × RR.
Adjust based on your own price action analysis.
📊 Best Practices
Use on H1 + D1 combo → align higher timeframe bias with intraday entries.
Risk only 1–2% of account per trade (position sizing required).
Filter with market sessions (Asia, Europe, US).
Strongest signals work best with trending pairs (e.g., XAUUSD, USDJPY, BTCUSD).
ค้นหาในสคริปต์สำหรับ "stoch"

Mean Reversion Probability Zones [BigBeluga]🔵 OVERVIEW
The Mean Reversion Probability Zones indicator measures the likelihood of price reverting back toward its mean . By analyzing oscillator dynamics (RSI, MFI, or Stochastic), it calculates probability zones both above and below the oscillator. These zones are visualized as histograms, colored regions on the main chart, and a compact dashboard, helping traders spot when the market is statistically stretched and more likely to revert.
🔵 CONCEPTS
Mean Reversion : The tendency of price to return to its average after significant extensions.
Oscillator-Based Analysis : Uses RSI, MFI, or Stochastic as the base signal for detecting overextension.
Probability Model : The probability of reversion is computed using three factors:
Whether the oscillator is rising or declining.
Whether the oscillator is above or below user-defined thresholds.
The oscillator’s actual value (distance from equilibrium).
Dual-Zone Output :
Upper histogram = probability of downward mean reversion.
Lower histogram = probability of upward mean reversion.
Historical Extremes : The dashboard highlights the recent maximum probability values for both upward and downward scenarios.
🔵 FEATURES
Oscillator Choice : Switch between RSI, MFI, and Stochastic.
Customizable Zones : User-defined upper/lower thresholds with independent colors.
Probability Histograms :
Above oscillator → down reversion probability.
Below oscillator → up reversion probability.
Colored Gradient Zones on Chart : Visual overlays showing where mean reversion probabilities are strongest.
Probability Labels : Percentages displayed next to histogram values for clarity.
Dashboard : Compact table in the corner showing the recent maximum probabilities for both upward and downward mean reversion.
Overlay Compatibility : Works in both chart pane and sub-pane with oscillators.
🔵 HOW TO USE
Set Oscillator : Choose RSI, MFI, or Stochastic depending on your strategy style.
Adjust Zones : Define upper/lower bounds for when oscillator values indicate strong overbought/oversold conditions.
Interpret Histograms :
Orange (upper) histogram → higher chance of a pullback/downward mean reversion.
Green (lower) histogram → higher chance of upward reversion/bounce.
Watch Gradient Zones : On the main chart, shaded areas highlight where probability of mean reversion is elevated.
Consult Dashboard : Use the “Recent MAX” values to understand how strong recent reversion probabilities have been in either direction.
Confluence Strategy : Combine with support/resistance, order flow, or trend filters to avoid counter-trend trades.
🔵 CONCLUSION
The Mean Reversion Probability Zones provides traders with an advanced way to quantify and visualize mean reversion opportunities. By blending oscillator momentum, threshold logic, and probability calculations, it highlights when markets are statistically stretched and primed for reversal. Whether you are a contrarian trader or simply looking for exhaustion signals to fade, this tool helps bring structure and clarity to mean reversion setups.

MTF Oscillator Stack [BigBeluga]🔵 OVERVIEW
The MTF Oscillator Stack brings powerful multi-timeframe momentum analysis directly into your price chart. You can select one oscillator— RSI , MFI , or Stochastic RSI —and display it across up to 4 different timeframes. Each panel is neatly stacked horizontally above price , offering quick insight into cross-timeframe conditions like trend direction, exhaustion zones, and momentum shifts.
🔵 CONCEPTS
Single Oscillator Mode: Select one oscillator type (RSI, MFI, or Stoch RSI) to analyze across all selected timeframes.
Top-Chart Horizontal Panels: Oscillator plots are aligned horizontally at the top of the chart for seamless top-down reading.
Signal Comparison Arrows: Arrows (🢁 / 🢃) indicate oscillator position relative to its signal line.
Overbought/Oversold Zones: Transparent 30–70 fill zones highlight key reversal areas.
Dynamic Display Logic: Only enabled panels are shown; spacing adjusts based on active timeframes.
Timeframe Tagging: Each oscillator panel is labeled with its corresponding timeframe (e.g., 1H, 2H, 4H).
🔵 FEATURES
Choose one oscillator (RSI, MFI, or Stoch RSI) and apply it across up to 4 timeframes.
Each oscillator panel includes: price-synced plot, signal line, and zone shading.
Scale alignment allows users to place charts at the bottom or top.
Clear arrow signals show whether oscillator is bullish or bearish.
Individual length and signal settings per timeframe.
Toggle for alignment mode: evenly spaced or floating layout.
All panels use a consistent layout for faster decision-making.
🔵 HOW TO USE
Select your preferred oscillator and activate 2–4 key timeframes (e.g., 1H, 4H, D1, W1).
Use signal crossovers as a bullish (🢁) or bearish (🢃) trend cue.
Look for aligned extremes (e.g., all timeframes overbought) to spot momentum exhaustion.
Ideal for momentum confluence strategies and top-down confirmation.
Use horizontal layout to stay focused on price while assessing broader structure.
🔵 CONCLUSION
MTF Oscillator Stack simplifies complex multi-timeframe momentum analysis into one clean, actionable visual. Whether you're tracking RSI, MFI, or Stoch RSI, this tool helps you stay aligned with the broader trend—without ever leaving your main chart.

AP IFTCCIv2/IFTStoch/IFTRSI Multi-TimeframeMulti-Timeframe IFT-CCI/Stoch/RSI Composite
This enhanced indicator combines three powerful oscillators—Inverse Fisher Transform (IFT) versions of the Commodity Channel Index (CCI), Stochastic, and Relative Strength Index (RSI)—into a unified multi-timeframe analysis tool. Originally developed by John Ehlers (pioneer of cyclical analysis and signal processing in trading systems) and adapted by KIVANC (@fr3762), this version adds dual-timeframe capability to compare indicator values across different chart resolutions.
Key Features:
Triple Oscillator Composite
IFT-CCI: Smoothed CCI values transformed via Ehlers' Inverse Fisher Transform (blue-gold)
IFT-Stochastic: Classic stochastic oscillator processed through IFT (blue)
IFT-RSI: RSI oscillator converted to IFT format (magenta)
Composite Average Line: Combined average of all three indicators (green)
Multi-Timeframe Analysis
Compare primary and secondary timeframes (e.g., 1H vs. 4H, daily vs. weekly)
Primary timeframe plots use solid lines with 80% opacity
Secondary timeframe (optional) uses dashed/circle markers with 40% opacity
Key Levels
Overbought (+0.75) and oversold (-0.75) reference lines
Zero-centerline for momentum direction bias
Applications:
Trend Confirmation: Align higher timeframe signals with lower timeframe entries
Divergence Detection: Spot inter-timeframe discrepancies in momentum
Regime Filter: Use higher timeframe composite values to filter trades
Technical Basis:
Inverse Fisher Transform: Compresses oscillator values into bounded (-1 to +1) range while emphasizing extreme moves
Dual WMA Smoothing: Combines initial calculation smoothing (WMA1) with final output smoothing (WMA2)
Exponential Scaling: (e^2x - 1)/(e^2x + 1) formula converts Gaussian-like distributions to bounded outputs
Credits:
Original Concept: John Ehlers (IFT methodology, cyclical analysis foundations)
Initial Implementation: KIVANC (@fr3762 on Twitter) for the base IFT-CCI/Stoch/RSI script
Multi-Timeframe Adaptation: for cross-resolution analysis capabilities
This tool is particularly effective for traders seeking to align multiple timeframes while using Ehlers' noise-reduction techniques. The composite average line provides a consensus view, while the individual oscillators help identify component strength/weakness.

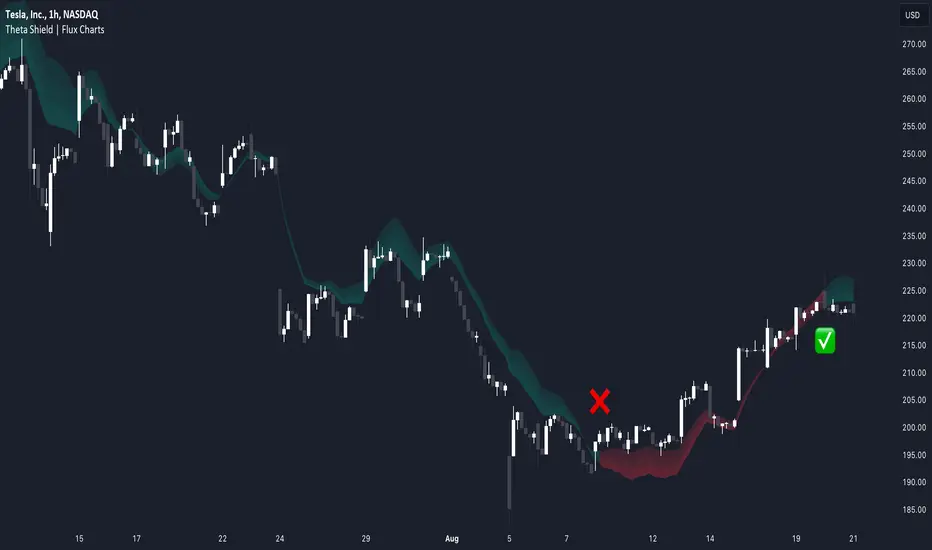
Theta Shield | Flux Charts💎 GENERAL OVERVIEW
Introducing our new Theta Shield indicator! Theta is the options risk factor concerning how fast there is a decline in the value of an option over time. This indicator aims to help the trader avoid sideways market phases in the current ticker, to minimize the risk of theta decay. For more information, please check the "How Does It Work" section.
Features of the new Theta Shield Indicator :
Foresight Of Accumulation Zones
Decrease Risk Of Theta Decay
Clear "Valid" & "Non-Valid" Signals
Validness Trail
Alerts
📌 HOW DOES IT WORK ?
In options trading, theta is defined as the rate of decline in the value of an option due to the passage of time. Traders want to avoid this kind of decay in the value of an option. One of the best ways to avoid it is not holding an option contract when the market is going sideways. This indicator uses a stochastic oscillator to try to get a foresight of sideways markets, warning the trader to not hold an option contract while the price is in a range.
The indicator starts by calculating the stochastic value using close, high & low prices of the candlesticks. Then a stoch threshold & a theta length are determined depending on the option contract type defined by the user in the settings of the indicator. Each candlestick that falls above or below the stoch threshold value is counted, and a "theta valid strength" is calculated using the counted candlesticks, which has a value between -100 & 100. Here is the formula of the "theta valid strength" value :
f_lin_interpolate(float x0, float x1, float y0, float y1, float x) =>
y0 + (x - x0) * (y1 - y0) / (x1 - x0)
thetaValid = Total Candlesticks That Fall Above & Below The Threshold In Last "Theta Length" bars.
thetaValidStrength = f_lin_interpolate(0, thetaLength, -100, 100, thetaValid)
Then a trail is rendered, and "Valid" & "Non-Valid" signals are given using this freshly calculated strength value. Valid means that the indicator currently thinks that no accumulation will happen in the near future, so the option positions in the current ticker are protected from the theta decay. Non-Valid means that the indicator thinks the ticker has entered the accumulation phase, so holding any option position is not recommended, as they may be affected by the theta decay.
🚩 UNIQUENESS
This indicator offers a unique way to avoid theta decay in options trading. It uses a stochastic oscillator and thresholds to calculate a "theta strength" value, which is used for rendering validness signals and a trail. Traders can follow the valid & non-valid signals when deciding to hold their options position or not. The indicator also has an alerts feature, so you can get notified when a ticker is about to enter a range, or when it's about to get out of it.
⚙️ SETTINGS
1. General Configuration
Contract Type -> You can set the option contract type here. The indicator will adjust itself to get a better foresight depending on the contract length.
2. Style
Fill Validness -> Will render a trail based on "theta strength" value.
Market Cycle IndicatorThe Market Cycle Indicator is a tool that integrates the elements of RSI, Stochastic RSI, and Donchian Channels. It is designed to detect market cycles, enabling traders to enter and exit the market at the most opportune times.
This indicator provides a unique perspective on the market, combining multiple strategies into one unified and weighted approach. By factoring in the inputs from each of these popular technical analysis methods, it offers a more holistic view of the market trends and cycles.
Parameter Details:
Donchian Channels (DCO):
- donchianPeriod: Sets the period for the Donchian Channel calculation. Default is set to 14.
- donchianSmoothing: Sets the smoothing factor for the Donchian Channel calculation. Default is set to 3.
- donchianPrice: Selects the price type to be used in the Donchian Channel calculation. Default is set to the closing price.
Relative Strength Index (RSI):
- rsiPeriod: Sets the period for the RSI calculation. Default is set to 14.
- rsiSmoothing: Sets the smoothing factor for the RSI calculation. Default is set to 3.
- rsiPrice: Selects the price type to be used in the RSI calculation. Default is set to the closing price.
Stochastic RSI (StochRSI):
- srsiPeriod: Sets the period for the Stochastic RSI calculation. Default is set to 20.
- srsiSmoothing: Sets the smoothing factor for the Stochastic RSI calculation. Default is set to 3.
- srsiK: Sets the period for the %K line in the Stochastic RSI calculation. Default is set to 5.
- srsiD: Sets the period for the %D line in the Stochastic RSI calculation. Default is set to 5.
- srsiPrice: Selects the price type to be used in the Stochastic RSI calculation. Default is set to the closing price.
Weights:
- rsiWeight: Sets the weight for the RSI in the final aggregate calculation. Default is set to 1.
- srsiWeight: Sets the weight for the Stochastic RSI in the final aggregate calculation. Default is set to 1.
- dcoWeight: Sets the weight for the Donchian Channel in the final aggregate calculation. Default is set to 1.
Limits:
- limitHigh: Sets the upper limit for the indicator. Default is set to 80.
- limitLow: Sets the lower limit for the indicator. Default is set to 20.
By customizing these parameters, users can tweak the indicator to align with their own trading strategies and risk tolerance levels. Whether you're a novice or an experienced trader, the Comprehensive Market Cycle Indicator provides valuable insights into the market's behavior.
Uses library HelperTA

[@btc_charlie] Trader XO Macro Trend ScannerWhat is this script?
This script has two main functions focusing on EMAs (Exponential Moving Average) and Stochastic RSI.
EMAs
EMAs are typically used to give a view of bullish / bearish momentum. When the shorter EMA (calculated off more recent price action) crosses, or is above, the slower moving EMA (calculated off a longer period of price action), it suggests that the market is in an uptrend. This can be an indication to either go long on said asset, or that it is more preferable to take long setups over short setups. Invalidation on long setups is usually found via price action (e.g. previous lows) or simply waiting for an EMA cross in the opposite direction (i.e. shorter EMA crosses under longer term EMA).
This is not a perfect system for trade entry or exit, but it does give a good indication of market trends. The settings for the EMAs can be changed based on user inputs, and by default the candles are coloured based on the crosses to make it more visual. The default settings are based on “Trader XO’s” settings who is an exceptional swing trader.
RSI
Stochastic RSI is a separate indicator that has been added to this script. RSI measures Relative Strength (RSI = Relative Strength Index). When RSI is <20 it is considered oversold, and when >80 it is overbought. These conditions suggests that momentum is very strong in the direction of the trend.
If there is a divergence between the price (e.g. price is creating higher highs, and stoch RSI is creating lower highs) it suggests the strength of the trend is weakening. Whilst this script does not highlight divergences, what it does highlight is when the shorter term RSI (K) crosses over D (the average of last 3 periods). This can give an indication that the trend is losing strength.
Combination
The EMAs indicate when trend shifts (bullish or bearish).
The RSI indicates when the trend is losing momentum.
The combination of the two can be used to suggest when to prefer a directional bias, and subsequently shift in anticipation of a trend reversal.
Note that no signal is 100% accurate and an interpretation of market conditions and price action will need to be overlayed to
Why is it different to others?
I have not found other scripts that are available in this way visually including alerts when Stoch RSI crosses over/under the extremes; or the mid points.
Whilst these indicators are default, the combination of them and how they are presented is not and makes use of the TradingView colouring functionalities.
What are the features?
Customise the variables (averages) used in the script.
Display as one EMA or two EMAs (the crossing ones).
Alerts on EMA crosses.
Alerts on Stoch RSI crosses - slow/fast, upper, lower areas.
- Currently set on the chart to show alerts when Stoch RSI is above 80, then falls below 80 (and colours it red).
Customisable colours.
What are the best conditions for this?
It is designed for high timeframe charts and analysis in crypto, since crypto tends to trend.
It can however be used for lower timeframes.
Disclaimer/Notes:
I have noticed several videos appearing suggesting that this is a "100% win rate indicator" .
NO indicator has 100% win rate.
An indicator is an *indicator* that is all.
Please use responsibly and let me know if there are any mods or updates you would like to see.

GTI BGTI: RSI Suite (Standard • Stochastic • Smoothed)
A three-layer momentum and trend toolkit that combines Standard RSI, Stochastic RSI, and a Smoothed/“Macro” RSI to help you read intraday swings, trend transitions, and high-probability reversal/continuation spots.
All in one pane with intuitive coloring and optional divergence markers and alerts.
Why this works
* Stochastic RSI (K/D) visualizes fast momentum swings and timing.
* Standard RSI moves more gradually, helping confirm trend transitions that may span several Stochastic cycles.
* Smoothed RSI (Average → Macro) adds a second-pass filter and slope persistence to reveal the macro direction while suppressing noise.
Used together, Stochastic guides entries/exits around local highs/lows, while the RSI layers improve confidence when a small swing is likely part of a larger turn.
What you’ll see
* Standard RSI (yellow; pink above Bull line, aqua below Bear line).
* Stochastic RSI (K/D) with contextual colors:
* Greens when RSI is weak/oversold (bearish conditions → watch for bullish reversals/continuations).
* Reds when RSI is strong/overbought (bullish conditions → watch for bearish reversals/continuations).
* Smoothed (Macro) RSI with trend color:
* Red when macro is ascending (bullish),
* Aqua when macro is descending (bearish).
* Divergences (optional markers):
* Bearish: RSI Lower High + Price Higher High (red ⬇).
* Bullish: RSI Higher Low + Price Lower Low (green ⬆).
* No repaint: pivots confirm after the chosen right-bars window.
How to use it
* Bullish Reversal
* Macro RSI is reversing at a higher low after price has been in a overall downtrend
* Stochastic RSI is switching from green to red in an overall downtrend
* Bullish Oversold
* Macro RSI is reversing from a significantly low level after price has a short but strong dip during an overall uptrend
* Stochastic RSI is switching from green to red in an overall uptrend
* Bullish Continuation
* Macro RSI is ascending with a strong slope or forming a higher low above the 50 line
* Stochastic RSI is reaching a bottom but still painted red
* Bearish Reversal
* Macro RSI is reversing at a lower high after price has been in a overall uptrend
* Stochastic RSI is switching from red to green in an overall uptrend
* Bearish Overbought
* Macro RSI is reversing from a significantly high level after price has a short but strong jump during an overall downtrend
* Stochastic RSI is switching from red to green in an overall downtrend
* Bearish Continuation
* Macro RSI is descending with a strong slope or forming a lower high below the 50 line
* Stochastic RSI is reaching a top but still painted green
* Divergences: Use as signals of exhaustion—best when aligned with Macro RSI color/slope and key levels (e.g., Bull/Bear lines, 50 midline).
*** IMPORTANT ***
* Stack confluence, don’t single-signal trade. Look for:
* 1) Macro RSI color & slope (red = ascending/bullish, aqua = descending/bearish)
* 2) Standard RSI location (above/below Bull/Bear lines or 50)
* 3) Stoch flip + direction
* 4) Price structure (HH/HL vs LH/LL)
* 5) Divergence type (regular vs hidden) at meaningful levels
* Trade with the macro
* Prioritize longs when Macro RSI is red or just flipped up
* Prioritize shorts when Macro RSI is aqua or just flipped down
* Counter-trend setups = smaller size and faster management.
* Location > signal
* The same crossover/divergence is higher quality near Bull (~60)/Bear(~40) or extremes than in the mid-range chop around 50.
* Early vs confirmed
* Use the early pivot heads-up for anticipation, but scale in only after the confirmed pivot (right-bars complete). If early signal fails to confirm, stand down.
* Define invalidation upfront
* For divergence entries, place stops beyond the pivot extreme (LL/HH). If Macro RSI flips against your trade or RSI breaks back through 50 with slope, exit or tighten.
* Multi-timeframe alignment
* Best results come when entry timeframe (e.g., 1H) aligns with higher-TF macro (e.g., 4H/D). If they disagree, treat it as mean-reversion only.
* Avoid common traps
* Skip: isolated Stochastic flips without RSI support, divergences without price HH/LL confirmation, and serial divergences when Macro RSI slope is strong against the idea.
* Parameter guidance
* Start with defaults; then tune: confirmBars 3–7, minSlope 0.05–0.15 RSI pts/bar, pivot left/right tighter for faster but noisier signals, wider for cleaner but fewer.
* Alerts = workflow, not auto-trades
* Use Macro Flip + Divergence alerts as a checklist trigger; enter only when your confluence rules are met and risk is defined.
Key inputs (tweak to your market/timeframe)
* RSI / Stochastic lengths and K/D smoothing.
* Bull / Bear Lines (default 61.1 / 43.6).
* Average RSI Method/Length (SMA/EMA/RMA/WMA) + Macro Smooth Length.
* Trend confirmation: bars of persistence and minimum slope to reduce flip noise.
* Pivot look-back (left/right) for divergence confirmation strictness.
Alerts included
* Macro Flip Up / Down (Smoothed RSI regime change).
* RSI Bullish/Bearish Divergence (confirmed at pivot).
* Stochastic RSI continuation/divergence (optional).
Tips
* Level + Slope matter. High/low RSI level flags conditions; slope confirms impulse/continuation.
* Let Stochastic time the swing; let Macro RSI filter the trend.
* Tighten or loosen pivot windows to trade fewer/cleaner vs. more/faster signals.

Cycle Low (RSI + StochRSI) – v5 John.KCycle Low (RSI + StochRSI) – v5 John.K
This tool is designed to detect potential cycle lows by combining RSI and Stochastic RSI oversold signals.
RSI Oversold + Cross → confirms momentum exhaustion
StochRSI Cross from Oversold → confirms short-term cycle turn
Score System (0–4) → evaluates confluence strength
Strict Mode → requires both RSI and StochRSI to be oversold for A+ signals
One-Bar Tolerance → allows RSI & StochRSI to cross within 1 bar
Anchor Option → optional reference level for cycle projection
Signals are plotted directly on the candles as green triangles (CL) when conditions are met.
Adjust thresholds (RSI, Stoch, Score) to control signal frequency.

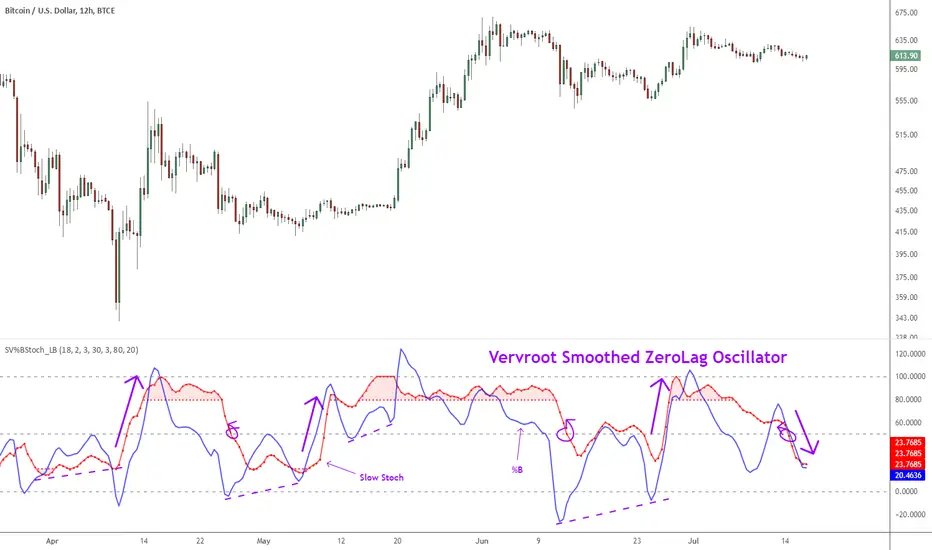
Indicator: Vervoort Smoothed Oscillator [LazyBear]This is Mr. Sylvian Vervoort's take on improving some well-known indicators (%B and Stoch) using smoothing techniques. A combination of TEMA and WMA does a nice job smoothing out %B, derived from zero-lag “Rainbow” data series. The same Rainbow series, averaged with the typical price, smooth the Stochastic K oscillator to produce slowStoch.
Vervroot's strategy for this oscillator (detailed explanation in the reference material below):
- It must be bullish for a buy signal and bearish for a sell signal. This means that both the oscillators must be moving up or down.
- Use the oscillators for detecting divergences. Divergence even in one is still valid.
- Stoch crossing 50 is a good confirmation signal. Momentum usually is an excellent leading indicator, so keep an eye on Stoch.
More info:
www.traders.com
www.scribd.com
Complete list of my indicators (Check the comments, I keep the list updated there):
SMI Color Red/Green📌 TradingView Description – SMI Red/Green Momentum Line
🔥 Stochastics Momentum Index (SMI) – Dynamic Red/Green Version
This indicator is an enhanced and modernized version of the Stochastic Momentum Index (SMI), designed to deliver a more visual, intuitive, and responsive view of trend momentum.
It includes:
✔️ Smoothed SMI
✔️ Dynamic Red/Green momentum coloring
✔️ Signal EMA line
✔️ Overbought/Oversold zones with shading
🎨 Dynamic Red/Green SMI Line
The main SMI line automatically changes color based on momentum direction:
Green → Bullish momentum (SMI rising)
Red → Bearish momentum (SMI falling)
This provides instant visual feedback and highlights early momentum changes even before traditional signal-line crossovers.
📉 Indicator Structure
1️⃣ Smoothed SMI
The SMI is calculated using the price’s position inside its range and then smoothed with an SMA to reduce noise.
2️⃣ EMA Signal Line
A customizable EMA acts as a signal line, providing:
Clear bullish/bearish crossovers
Trend confirmation
Cleaner entry/exit signals
3️⃣ Overbought / Oversold Zones
Extreme levels are highlighted using color-filled zones:
Red Zone (Overbought) → potential bearish reversal
Green Zone (Oversold) → potential bullish reversal
Levels are fully adjustable.
💡 How to Use It
The indicator works exceptionally well across all timeframes.
The most powerful signals are:
✔️ SMI crossing above/below the EMA
SMI crosses above EMA → bullish signal
SMI crosses below EMA → bearish signal
✔️ Leaving Overbought/Oversold zones
SMI exits the oversold zone → potential long setup
SMI exits the overbought zone → potential short setup
✔️ Color shifts (momentum direction)
Red → Green : early bullish momentum
Green → Red : early bearish momentum
Perfect for scalping, day trading, and swing trading.
🚀 Why This Version Is Better
Extremely visual momentum reading
Noise reduction through smoothing
Instantly readable color-coded trend
Strong OB/OS zone visualization
Works on any market and timeframe
Great in combination with RSI, MACD, HMA, ALMA, and trend filters
If you'd like, I can also write:
🔹 a SEO-optimized title,
🔹 recommended TradingView tags,
🔹 or a shorter promotional description.

AII - Average indicator of indicatorsThis Pine Script for TradingView is a technical analysis tool that visualizes the average of several popular indicators in the trading world. The indicators included are the RSI (Relative Strength Index), RVI (Relative Vigor Index), Stochastic RSI, Williams %R, relative MACD (ranging from 0 to 100), and Bollinger Bands price distance from 0 to 100. The script uses the "input" function to customize the length of the indicators and the "plot" function to display the results on the chart. In addition, options are included to turn off certain indicators and change the line colors if the user desires. All indicators can also be activated independently, allowing the user to see only the indicators they want. It is also mentioned that the script will be improved in the future to offer a better user experience. The calculated values are calculated with the default EMA of 14. Overall, this script is an excellent option for those looking for a combined view of several important indicators for making trading decisions.

CA - Indicators ColorsThe following indicator help to have an idea of the current state of the MACD and FullStochastic in 1 hour and 1 day. If you are a trader that is regularly using stochastics and macd indicator and don't have enough space in you screen this might help to increase the space in your screen.
Parameters used on MACD: 12, 26,9
Parameters used on Stochastics: 14,5,5
The whole idea of the indicator is if you see an entry for a long position, you can confirm that a higher timeframe its aligned by both indicators and if you are seeing an entry for a short position you can confirm with a higher timeframe.
This indicator doesn't provide an entry or exit signal, but lets you verify where is the trend going in those timeframes so it helps you decide to make the trade.
Stochastic
Green: going up
Red: going down
Macd
Green: going up
Light Green: previous was green and going down.
Red: going down
Light Red: previous was red and going up
Keep in mind, the colors are going to get updated as long as the market is active.
Any feedback its appreciated.

Multi momentum indicatorScript contains couple momentum oscillators all in one pane
List of indicators:
RSI
Stochastic RSI
MACD
CCI
WaveTrend by LazyBear
MFI
Default active indicators are RSI and Stochastic RSI
Other indicators are disabled by default
RSI, StochRSI and MFI are modified to be bounded to range from 100 to -100. That's why overbought is 40 and 60 instead 70 and 80 while oversold -40 and -60 instead 30 and 20.
MACD and CCI as they are not bounded to 100 or 200 range, they are limited to 100 - -100 by default when activated (extras are simply hidden) but there is an option to show full indicator.
In settings there are couple more options like show crosses or show only histogram.
Default source for all indicators is close (except WaveTrend and MFI which use hlc3) and it could be changed but for all indicators.
There is an option for 2nd RSI which can be set for any timeframe and background calculated by Fibonacci levels.


[COG]StochRSI Zenith📊 StochRSI Zenith
This indicator combines the traditional Stochastic RSI with enhanced visualization features and multi-timeframe analysis capabilities. It's designed to provide traders with a comprehensive view of market conditions through various technical components.
🔑 Key Features:
• Advanced StochRSI Implementation
- Customizable RSI and Stochastic calculation periods
- Multiple moving average type options (SMA, EMA, SMMA, LWMA)
- Adjustable signal line parameters
• Visual Enhancement System
- Dynamic wave effect visualization
- Energy field display for momentum visualization
- Customizable color schemes for bullish and bearish signals
- Adaptive transparency settings
• Multi-Timeframe Analysis
- Higher timeframe confirmation
- Synchronized market structure analysis
- Cross-timeframe signal validation
• Divergence Detection
- Automated bullish and bearish divergence identification
- Customizable lookback period
- Clear visual signals for confirmed divergences
• Signal Generation Framework
- Price action confirmation
- SMA-based trend filtering
- Multiple confirmation levels for reduced noise
- Clear entry signals with customizable display options
📈 Technical Components:
1. Core Oscillator
- Base calculation: 13-period RSI (adjustable)
- Stochastic calculation: 8-period (adjustable)
- Signal lines: 5,3 smoothing (adjustable)
2. Visual Systems
- Wave effect with three layers of visualization
- Energy field display with dynamic intensity
- Reference bands at 20/30/50/70/80 levels
3. Confirmation Mechanisms
- SMA trend filter
- Higher timeframe alignment
- Price action validation
- Divergence confirmation
⚙️ Customization Options:
• Visual Parameters
- Wave effect intensity and speed
- Energy field sensitivity
- Color schemes for bullish/bearish signals
- Signal display preferences
• Technical Parameters
- All core calculation periods
- Moving average types
- Divergence detection settings
- Signal confirmation criteria
• Display Settings
- Chart and indicator signal placement
- SMA line visualization
- Background highlighting options
- Label positioning and size
🔍 Technical Implementation:
The indicator combines several advanced techniques to generate signals. Here are key components with code examples:
1. Core StochRSI Calculation:
// Base RSI calculation
rsi = ta.rsi(close, rsi_length)
// StochRSI transformation
stochRSI = ((ta.highest(rsi, stoch_length) - ta.lowest(rsi, stoch_length)) != 0) ?
(100 * (rsi - ta.lowest(rsi, stoch_length))) /
(ta.highest(rsi, stoch_length) - ta.lowest(rsi, stoch_length)) : 0
2. Signal Generation System:
// Core signal conditions
crossover_buy = crossOver(sk, sd, cross_threshold)
valid_buy_zone = sk < 30 and sd < 30
price_within_sma_bands = close <= sma_high and close >= sma_low
// Enhanced signal generation
if crossover_buy and valid_buy_zone and price_within_sma_bands and htf_allows_long
if is_bullish_candle
long_signal := true
else
awaiting_bull_confirmation := true
3. Multi-Timeframe Analysis:
= request.security(syminfo.tickerid, mtf_period,
)
The HTF filter looks at a higher timeframe (default: 4H) to confirm the trend
It only allows:
Long trades when the higher timeframe is bullish
Short trades when the higher timeframe is bearish
📈 Trading Application Guide:
1. Signal Identification
• Oversold Opportunities (< 30 level)
- Look for bullish crosses of K-line above D-line
- Confirm with higher timeframe alignment
- Wait for price action confirmation (bullish candle)
• Overbought Conditions (> 70 level)
- Watch for bearish crosses of K-line below D-line
- Verify higher timeframe condition
- Confirm with bearish price action
2. Divergence Trading
• Bullish Divergence
- Price makes lower lows while indicator makes higher lows
- Most effective when occurring in oversold territory
- Use with support levels for entry timing
• Bearish Divergence
- Price makes higher highs while indicator shows lower highs
- Most reliable in overbought conditions
- Combine with resistance levels
3. Wave Effect Analysis
• Strong Waves
- Multiple wave lines moving in same direction indicate momentum
- Wider wave spread suggests increased volatility
- Use for trend strength confirmation
• Energy Field
- Higher intensity in trading zones suggests stronger moves
- Use for momentum confirmation
- Watch for energy field convergence with price action
The energy field is like a heat map that shows momentum strength
It gets stronger (more visible) when:
Price is in oversold (<30) or overbought (>70) zones
The indicator lines are moving apart quickly
A strong signal is forming
Think of it as a "strength meter" - the more visible the energy field, the stronger the potential move
4. Risk Management Integration
• Entry Confirmation
- Wait for all signal components to align
- Use higher timeframe for trend direction
- Confirm with price action and SMA positions
• Stop Loss Placement
- Consider placing stops beyond recent swing points
- Use ATR for dynamic stop calculation
- Account for market volatility
5. Position Management
• Partial Profit Taking
- Consider scaling out at overbought/oversold levels
- Use wave effect intensity for exit timing
- Monitor energy field for momentum shifts
• Trade Duration
- Short-term: Use primary signals in trading zones
- Swing trades: Focus on divergence signals
- Position trades: Utilize higher timeframe signals
⚠️ Important Usage Notes:
• Avoid:
- Trading against strong trends
- Relying solely on single signals
- Ignoring higher timeframe context
- Over-leveraging based on signals
Remember: This tool is designed to assist in analysis but should never be used as the sole decision-maker for trades. Always maintain proper risk management and combine with other forms of analysis.

mystochrsirsi + stochrsi
Indicator where rsi and stoch rsi are both together. Please adjust the color etc settings from the style tab.
Guth_3X_ConfirmThis indicator has three built in indicators based on the SMA of HIGH, SMA of LOW, and Stochastic. The baseline indicator is the retreats after departures from SMA of HIGH and LOW.
The first time a HIGH that is above the SMA HIGH has a lower HIGH but it still above the SMA HIGH, a (-) will appear at the bottom. This signals an aggressive entry point for potential coming downtrend. The second time the HIGH produces a lower high but is still above the SMA HIGH, a (S) will appear at the bottom which signals a more conservative entry point for potential coming downtrend. All of the opposite information is true of reversals beyond the SMA LOW.
When these reversals appear the same time the Stochastic is overbought or oversold, a red bar (overbought and potentially coming down) or a green bar (oversold and potentially coming up) will appear. NOTE: Aggressive symbols occur more often and will always occur when a conservative symbol appears. When a conservative indicator and respective overbought/oversold level occur at the same time, the bar is darker in color.
You can enter positions at any one of the indicators, however, the darker bars are what I look for. This has a high success rate but cannot guarantee results every time. I recommend adjusting the SMA, and Stoch parameters as well as time periods. I have had success with this indicator while day trading the 5, 10, 15, 30, 65 minute periods as well as daily and weekly periods. Every symbol traded can provide differing results based on the parameters used.
Please feel free to leave feedback and I know this can work well for you!
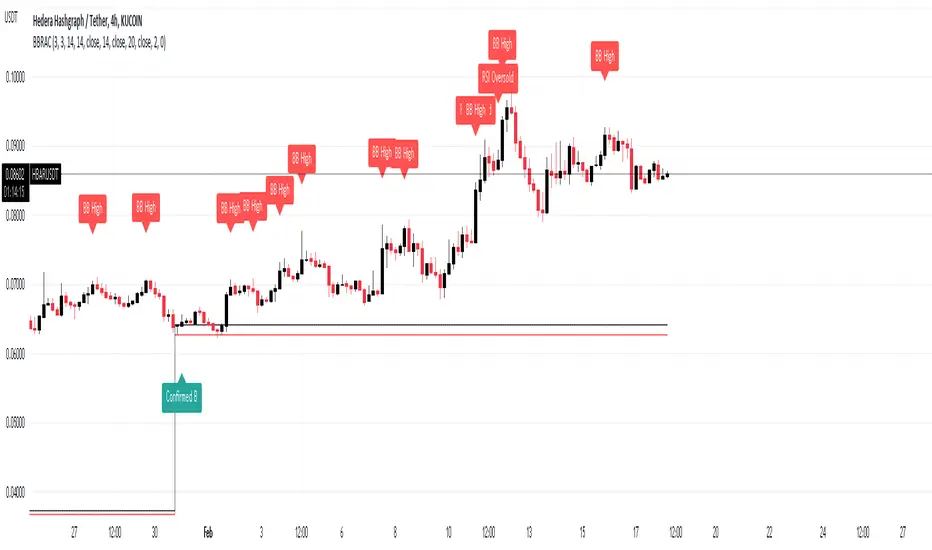
BB Running Away CandleHello,
here is an indicator that can be helpful for your trading that is simple and easy to use.
Our culprit here is a candle that opens and closes below the lower band of Bollinger Band, Black and red lines are put on the high and low of that candle.
Green Arrows are happening when:
1- When candle closes above the black line and Stochastic RSI is in the oversold area >> "Confirmed B"
2- When candle closes above the black line >> "B"
Note that you can choose from the settings whether you want it confirmed or not.
Red Arrows are happening when:
1- Price reached the higher band of Bollinger Bands >> "BB High"
2- Stochastic crosses down from above 80 level >> "Stoch Crossdown"
3- RSI reached above 70 levle >> "RSI Oversold"
Note that you can choose to turn these on or off from the settings.
Settings of indicators are set to default.
NOTE: Alerts are put there however i didn't get the chance to test them, so would like to hear your feedback about them.
THE USE OF THIS INDICATOR IS YOUR OWN RESPONSIBILITY.
wishing you the best.
+ JMA KDJ with RSI OB/OS SignalsSo, what is the KDJ indicator? If you're familiar with the Stochastic, then you'll know that the two oscillating lines are called the 'K' and 'D' lines. Now you know that this is some sort of implementation of the Stochastic. But, then, what is the J? The 'J' is simply the measure of convergence/divergence of the 'K' and 'D' lines, and the 'J' crossing the 'K' and 'D' lines is representational of the 'K' and 'D' lines themselves crossing. Is this an improvement over simply using the Stochastic as it is? Beats me. I don't use the Stochastic. I stumbled upon the KDJ while surfing around the web, and it sounded cool, so I thought I'd look at it. I do like it a bit more as the 'J' line being far overextended from the other two (usually into overbought/sold territory) does give a clear visual representation of the divergence of the 'K' and 'D' lines, which you might not notice otherwise. So, from that perspective I suppose it is nicer.
But let's get to the good stuff now, shall we? What did I do here?
Well, first thing you're wondering is why there are only two lines when based on my explanation (or your previous experience with the indicator) there should be three. I found this script here on TV, by x4random, who took the 'K' and 'D' lines and made an average of them, so there is only one line instead of the two. So, fewer lines on the indicator, but still the same usefulness. It was in older TV code, so I took it to version4 and cleaned up the code slightly. His indicator included the RSI ob/os plots, and I thought this was neat (even though the RSI being os/ob doesn't tell you much except that the trend is strong, and you should be buying pullback or selling rallies) so I kept them in. His indicator was also the most visually appealing one that I saw on here, so that attracted me too. Credit to x4random for the indicator, though.
Aside from code cleanup and adding the usual bells and whistles (which I will get to) the big thing I did here was change is RMA that he was using for the 'K' and 'D' lines to a Jurik MA's, which smooth a lot of the noise of other moving averages while maintaining responsiveness. This eliminates noise (false signals) while keeping the signals of significance. It took me a while to figure out how to substitute the JMA for the RMA, but thanks to QuantTherapy's "Jurik PPO" indicator I was able to nail down the implementation. One thing you might notice is that there is no input to change signal length. I fiddled with this for a time before sticking to using the period, instead of the signal (thus eliminating the use of the signal input altogether), length to generate the 'K' and 'D' calculations. To make any adjustments other than the period length use the Jurik Power input. You can use the phase input as well, but it has much less of an effect.
Everything else I changed is pretty much cosmetic.
Candle coloring with the option to color candles based on either the 'J' line or the 'KD' line.
color.from_gradients with color inputs to make it beautiful (this is probably my best looking indicator, imo)
plots for when crosses occur (really wish there was a way to plot these over candlesticks! If anyone has any suggestions I'd love to see!)
I think that's about it. Alerts of course.
Enjoy!
Below is a comparison chart of my JMA implementation to the original RMA script.
You can see how much smoother the JMA version is. Both of these had the default period of 55 set, and the JMA version is using the default settings, while the original version is using a length of 3 for the signal line.

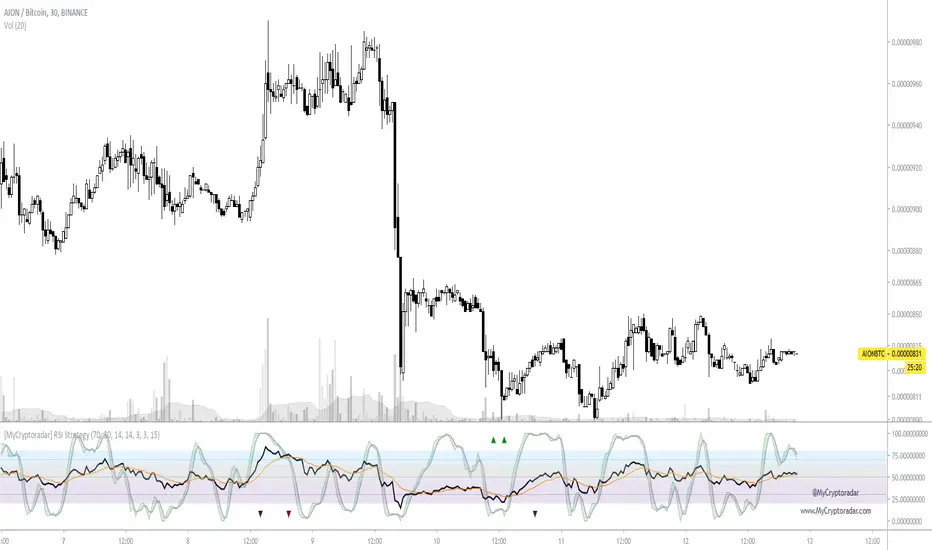
[Coingrats]RSI Divergence + StochRSIThis indicator shows the RSI and StochRSI. RSI divergence will also be marked.
- Bullish divergence - green triangle,
- Hidden bullish divergence - gray triangle
- Bearish divergence = red triangle
- Hidden bearish divergence - gray triangle
Credits to BabyWhale83 for the code to spotting divergence
WANNA TIP ME? BUY ME SOME BEERS!
BTC: 3BMEXX5JrX94ziUSoQMLEmi51WcYwphAg3
ETH: 0x541e504bb461aa141de6ddce09dc89eb16f58f9c
LTC: LPBJXzUZJksCuCK27AY2qAVYGGGiUfejok
DON'T FORGET TO LOOK AT OUR SITE MYCRYPTODARAR.COM
Multi-Timeframe Stochs by Tom L.I find it really usefull. Can put 4 different timeframes.
Thanks again to Tom !
PMA4LIFE
RAF3x

Dual Stochastic with Trend FilterThe "Dual Stochastic with Trend Filter" is an oscillator indicator designed to provide clearer, trend-aligned trading signals. It uses two distinct stochastic oscillators to identify potential entry points and incorporates an optional EMA-based trend filter to ensure that you are trading in the direction of the broader market momentum.
How It Works and How to Use It
This indicator combines two key technical analysis concepts: momentum (via stochastics) and trend (via moving averages).
Core Components:
Dual Stochastic Oscillators:
Signal Line 1 (Blue): A standard stochastic oscillator.
Signal Line 2 (Red): A second stochastic oscillator, often using a different source (like hlcc4) to provide a smoother, more reliable signal.
A buy signal is generated when the Blue Line (d1) crosses above the Red Line (d2).
A sell signal is generated when the Blue Line (d1) crosses below the Red Line (d2).
Trend Filter (Optional):
This feature uses a fast and a slow Exponential Moving Average (EMA) to determine the overall market trend.
When the fast EMA is above the slow EMA, the background will turn green, indicating an uptrend.
When the fast EMA is below the slow EMA, the background will turn red, indicating a downtrend.
This filter can be toggled on or off in the indicator settings.
How to Use:
With Trend Filter Enabled (Recommended):
Long (Buy) Entry: Look for a green triangle buy signal (▲). This signal only appears when:
The Blue Signal Line crosses above the Red Signal Line.
The market is in a confirmed uptrend (green background).
Short (Sell) Entry: Look for a red triangle sell signal (▼). This signal only appears when:
The Blue Signal Line crosses below the Red Signal Line.
The market is in a confirmed downtrend (red background).
Exit Signal:
A yellow circle (●) appears to suggest closing an open trade. This signal is triggered for a long position if either the stochastics have a bearish cross or the trend flips to a downtrend. Conversely, for a short position, it's triggered by a bullish stochastic cross or a trend flip to an uptrend.
With Trend Filter Disabled:
If you turn off the "Use Trend Filter" option, the indicator will function as a simple dual stochastic crossover system.
A green triangle (▲) will appear every time the Blue Line crosses above the Red Line.
A red triangle (▼) will appear every time the Blue Line crosses below the Red Line.
The background coloring and exit signals based on trend flips will be deactivated. This mode is more sensitive but may produce more false signals in choppy markets.
Key Visuals:
Blue Line: The primary signal line.
Red Line: The secondary, often smoother, signal line.
Green Triangle (▲): Bullish entry signal.
Red Triangle (▼): Bearish entry signal.
Yellow Circle (●): Suggested trade exit/stop.
Green/Red Background: Visual confirmation of the current uptrend or downtrend.
By filtering stochastic signals with the dominant trend, this indicator helps traders avoid common pitfalls like entering short positions during a strong uptrend or buying into a bearish market. This alignment of momentum and trend is key to improving signal quality.
Disclaimer
This indicator is provided for educational and informational purposes only and should not be considered as financial advice or a recommendation to buy or sell any asset. All trading and investment decisions are your own sole responsibility.
Trading financial markets involves a high level of risk, and you may lose more than your initial investment. Past performance is not indicative of future results. The signals generated by this indicator are not guaranteed to be accurate, and you should always use this tool in conjunction with other forms of analysis and sound risk management practices.
Before using this indicator in a live trading environment, it is strongly recommended that you backtest it thoroughly and practice with it on a demo account. The author is not responsible for any financial losses you may incur from using this script.
