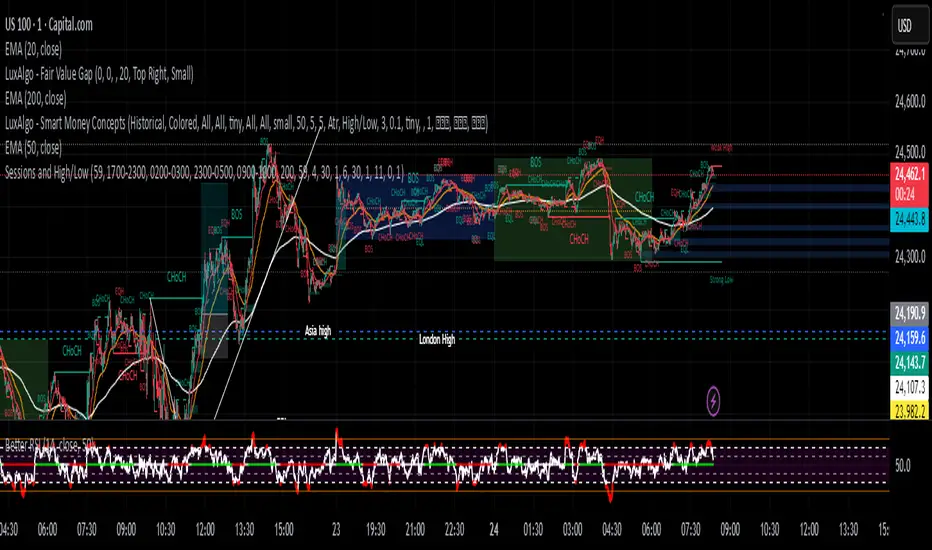
Sessions and High/LowCan be used to mark highs and lows of any sessions you desire can do 4 sessions อินดิเคเตอร์ Pine Script®โดย armaan19935
Sessions+Days Marker (SigmaSita)An indicator that marks the sessions and days. You can adjust session start times. Sessions are Asian, London and New York.อินดิเคเตอร์ Pine Script®โดย SigmaSita1113
Sessions[Lenny Kiruthu]The script below is designed to show up to 4 different trading sessions i.e. London, New York, Tokyo and Sydney sessions, it also displays the days each session is taking place in as well as two horizontal lines one for the previous days high and the other for the previous days low. It also displays a table that shows the user the highest and lowest price for 4 different currency pairs the previous day as well as their current prices and below it a confirmation row that shows whether price is currently above, below or within yesterdays range. Note that it only states "High Broken" or "Low Broken" if the current close is above or below the lines. What you can change Your time zone for example GMT -4 or GMT +3 The session start and end time The colors, border type and border width of the session ranges Displaying the table Ability to choose the 4 symbols to view on the table อินดิเคเตอร์ Pine Script®โดย Lenny_Kiruthuที่อัปเดต: 88266
Sessions [New_ProfitEfex]This script is use for displaying session in a very attractive an clarity way You can give it a try for freeอินดิเคเตอร์ Pine Script®โดย pytyyy114
Sessions with timeframe filter🕒 Smart Timeframe Filtering This session indicator includes an automatic filter that disables all session boxes when the chart timeframe is greater than the user-defined input. This helps keep higher-timeframe charts clean and focused by hiding intraday sessions when they’re no longer relevant — especially helpful for multi-timeframe traders. 🔍 Features: 📦 Draws up to 3 customizable session boxes with dynamic high/low tracking. ⏱️ Auto-disables on higher timeframes (Smart Timeframe Filter). 🌍 Fully customizable session times, box colors, and time zone (GMT-based). ⚡ Optimized for performance using lightweight, non-overlapping box logic. 👨🍳 UI is organized like a chef’s kitchen: clean, intuitive, and easy to navigate. Settings are grouped and filtered to avoid clutter. ✅ Best Use: This indicator is most useful for intraday traders on 1m–15m charts. It’s designed to keep your workspace clean on 30m+ charts or whatever threshold you define. อินดิเคเตอร์ Pine Script®โดย KevZ3R114
Sessions by SHARK [Kyiv Time]Why Forex Sessions Matter First of all, it is very convenient for a trader to structure their working hours. The best times to open positions are during the London Kill Zone (KZ) and New York Kill Zone (KZ). Based on what happens within each session, you can build your future analysis while considering the overall context. We must understand that there are specific times of the day that are more or less volatile. Knowing this will help you determine when you should be looking for trade setups and when you should avoid them. Trading outside of the Kill Zones can lead to holding positions for too long because market liquidity decreases, which in turn leads to lower volatility.อินดิเคเตอร์ Pine Script®โดย y_batko22101
Sessions ny vizScript Purpose This indicator draws a colored background during the New York trading session. It's useful for traders who want to have a visual overview of when the American (NY) trading session is active. Main Features NY Session Visualization - draws a gray bar in the background of the chart during NY trading hours (15:00-19:00 CET) Customization - allows users to: Set custom session time range Adjust background color and transparency Limit display to only the last 24 hours Input Parameters sessionRange - session time range (default 15:00-19:00 CET) sessionColour - background color (default gray with 90% transparency) onlyLast24Hours - toggle for showing only the last 24 hours (default false) Technical Details Script is written in Pine Script version 5 Uses UNIX timestamp for time period calculations Runs as an overlay indicator (overlay=true), meaning it displays directly on the price chart Uses the bgcolor() function for background rendering Contains logic to check if current time is within defined session Usage This indicator is useful for: Monitoring active NY trading session hours Planning trades during the most liquid hours of the US market Visual orientation in the chart during different trading sessionsอินดิเคเตอร์ Pine Script®โดย dxmb3
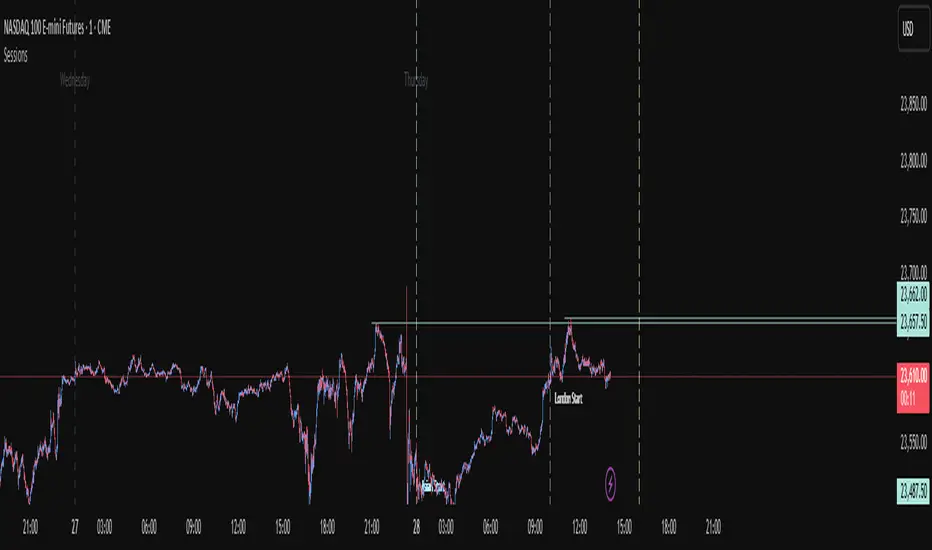
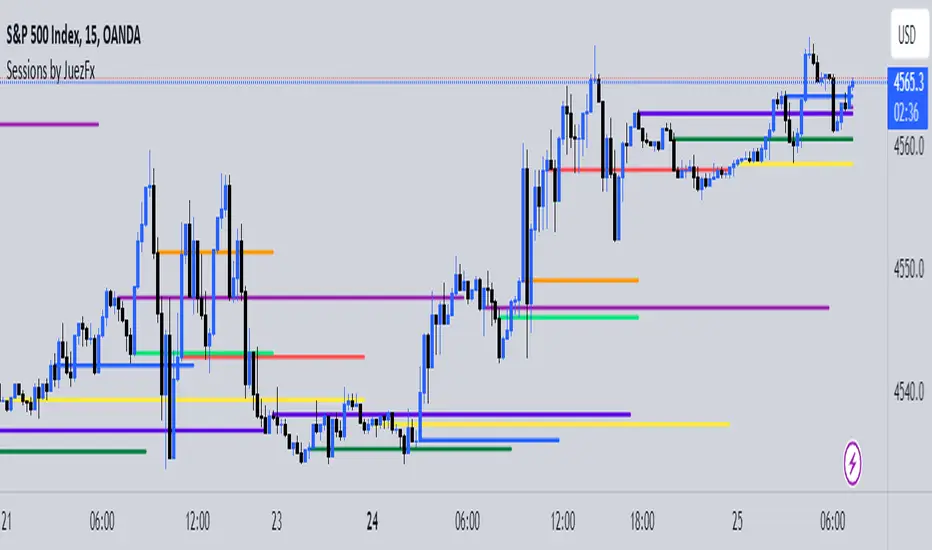
Sessions by JuezFxLines Plotted at the opening price of London, New York, New York Stock Exchange, and Asia. It could also plot lines of the closing price of the session. The script is just plotting a line at those levels to give us a visual indicator of those specific levels as they could be very beneficial for your trading. Opening and closing of the session hold the most liquidity, attracting the market towards it. I hope this script will help you in your trading and you can use those levels along with other confluences in order to identify key levels that the market could react from! There are some similar scripts but this one have more lines to plot at could be identified by different color and line thickness! อินดิเคเตอร์ Pine Script®โดย juezTrades83
Sessions Lines & BackgroundDisplay Asia, London & New York sessions as background colors or lines (for a cleaner chart).อินดิเคเตอร์ Pine Script®โดย alexonmarketsที่อัปเดต: 59
Sessions by Aegean This script has the full 8 hours for the 3 major sessions and 1 hour for the Frankfurt, Germany sessionอินดิเคเตอร์ Pine Script®โดย AegeanFX25
Session Bar Color (US Time)This script is designed to change the color of bars on a trading chart based on different trading sessions in Eastern Time (ET). It is different from currently published scripts in that it specifically focuses on US time sessions and provides a customizable approach to defining and coloring each session. To use this script, you can apply it to a chart by selecting it from the list of available indicators or overlays. The script is meant for traders who are interested in visualizing different trading sessions on their charts. By coloring the bars based on session boundaries, it can help traders quickly identify session changes and potentially adjust their trading strategies accordingly. Mostly it's used to draw the high and low zones of each session. The markets this script is suitable for are those that operate within the US time zones, as it specifically focuses on Eastern Time (ET) sessions. It can be used for various types of markets, including stocks, futures, and forex. The conditions for each session are defined using the input. session function, which allows you to specify the start and end times for each session. The script includes four sessions: Asian, London, USA, and New York. By modifying the defval parameter for each session input, you can customize the session times to fit your specific trading preferences or time zone. The script uses the time function to check if the current bar falls within a particular session. If the condition is met, it sets the color of the bar using the bar color function. Each session is assigned a different color: black for the Asian session, teal for the London session, a custom RGB color (dark red) for the USA session, and red for the New York session. It's important to note that this script assumes the time zone of the trading platform is set to "Etc/GMT+4" to align with Eastern Time (ET). If your platform uses a different time zone, you may need to adjust the time function calls to match your desired time zone.อินดิเคเตอร์ Pine Script®โดย DOSALGOที่อัปเดต: 11197
Session-Based Sentiment Oscillator [TradeDots]Track, analyze, and monitor market sentiment across global trading sessions with this advanced multi-session sentiment analysis tool. This script provides session-specific sentiment readings for Asian (Tokyo), European (London), and US (New York) markets, combining price action, volume analysis, and volatility factors into a comprehensive sentiment oscillator. It is an original indicator designed to help traders understand regional market psychology and capitalize on cross-session sentiment shifts directly on TradingView. 📝 HOW IT WORKS 1. Multi-Component Sentiment Engine Price Action Momentum : Calculates normalized price movement relative to recent trading ranges, providing directional sentiment readings. Volume-Weighted Analysis : When volume data is available, incorporates volume flow direction to validate price-based sentiment signals. Volatility-Adjusted Factors : Accounts for changing market volatility conditions by comparing current ATR against historical averages. Weighted Combination : Merges all components using optimized weightings (Price: 1.0, Volume: 0.3, Volatility: 0.2) for balanced sentiment readings. 2. Session-Segregated Tracking Automatic Session Detection : Precisely identifies active trading sessions based on user-configured time parameters. Independent Calculations : Maintains separate sentiment accumulation for each major session, updated only during respective active hours. Historical Preservation : Stores session-specific sentiment values even when sessions are closed, enabling cross-session comparison. Real-Time Updates : Continuously processes sentiment during active sessions while preserving inactive session data. 3. Cross-Session Transition Analysis Sentiment Differential Detection : Monitors sentiment changes when transitioning between trading sessions. Configurable Thresholds : Generates signals only when sentiment shifts exceed user-defined minimum thresholds. Directional Signals : Provides distinct bullish and bearish transition alerts with visual markers. Smart Filtering : Applies smoothing algorithms to reduce false signals from minor sentiment variations. ⚙️ KEY FEATURES 1. Session-Specific Dashboard Real-Time Status Display : Shows current session activity (ACTIVE/CLOSED) for all three major sessions. Sentiment Percentages : Displays precise sentiment readings as percentages for easy interpretation. Strength Classification : Automatically categorizes sentiment as HIGH (>50%), MEDIUM (20-50%), or LOW (<20%). Customizable Positioning : Place dashboard in any corner with adjustable size options. 2. Advanced Signal Generation Transition Alerts : Triangle markers indicate significant sentiment shifts between sessions. Extreme Conditions : Diamond markers highlight overbought/oversold threshold breaches. Configurable Sensitivity : Adjust signal thresholds from 0.05 to 0.50 based on trading style. Alert Integration : Built-in TradingView alert conditions for automated notifications. 3. Forex Currency Strength Analysis Base/Quote Decomposition : For forex pairs, separates sentiment into individual currency strength components. Major Currency Support : Analyzes USD, EUR, GBP, JPY, CHF, CAD, AUD, NZD strength relationships. Relative Strength Display : Shows which currency is driving pair movement during active sessions. 4. Visual Enhancement System Session Background Colors : Distinct background shading for each active trading session. Overbought/Oversold Zones : Configurable extreme sentiment level visualization with colored zones. Multi-Timeframe Compatibility : Works across all timeframes while maintaining session accuracy. Customizable Color Schemes : Full color customization for dashboard, signals, and plot elements. 🚀 HOW TO USE IT 1. Add the Script Search for "Session-Based Sentiment Oscillator " in the Indicators tab or manually add it to your chart. The indicator will appear in a separate pane below your main chart. 2. Configure Session Times Asian Session : Set Tokyo market hours (default: 00:00-09:00) based on your chart timezone. European Session : Configure London market hours (default: 07:00-16:00) for European analysis. US Session : Define New York market hours (default: 13:00-22:00) for American markets. Timezone Adjustment : Ensure session times match your broker's specifications and account for daylight saving changes. 3. Optimize Analysis Parameters Sentiment Period : Choose 5-50 bars (default: 14) for sentiment calculation lookback period. Smoothing Settings : Select 1-10 bars smoothing (default: 3) with SMA, EMA, or RMA options. Component Selection : Enable/disable volume analysis, price action, and volatility factors based on available data. Signal Sensitivity : Adjust threshold from 0.05-0.50 (default: 0.15) for transition signal generation. 4. Interpret Readings and Signals Positive Values : Indicate bullish sentiment for the active session. Negative Values : Suggest bearish sentiment conditions. Dashboard Status : Monitor which session is currently active and their respective sentiment strengths. Transition Signals : Watch for triangle markers indicating significant cross-session sentiment changes. Extreme Alerts : Note diamond markers when sentiment reaches overbought (>70%) or oversold (<-70%) levels. 5. Set Up Alerts Configure TradingView alerts for: - Bullish session transitions - Bearish session transitions - Overbought condition alerts - Oversold condition alerts ❗️LIMITATIONS 1. Data Dependency Volume Requirements : Volume-based analysis only functions when volume data is provided by your broker. Many forex brokers do not supply reliable volume data. Price Action Focus : In absence of volume data, sentiment calculations rely primarily on price movement and volatility factors. 2. Session Time Sensitivity Manual Adjustment Required : Session times must be manually updated for daylight saving time changes. Broker Variations : Different brokers may have slightly different session definitions requiring time parameter adjustments. 3. Ranging Market Limitations Trend Bias : Sentiment calculations may be less reliable during extended sideways or low-volatility market conditions. Lag Consideration : As with all sentiment indicators, readings may lag during rapid market transitions. 4. Regional Market Focus Major Session Coverage : Designed primarily for major global sessions; may not capture sentiment from smaller regional markets. Weekend Gaps : Does not account for weekend gap effects on sentiment calculations. ⚠️ RISK DISCLAIMER Trading and investing carry significant risk and can result in financial loss. The "Session-Based Sentiment Oscillator " is provided for informational and educational purposes only. It does not constitute financial advice. - Always conduct your own research and analysis - Use proper risk management and position sizing in all trades - Past sentiment patterns do not guarantee future market behavior - Combine this indicator with other technical and fundamental analysis tools - Consider overall market context and your personal risk tolerance This script is an original creation by TradeDots, published under the Mozilla Public License 2.0. Session-based sentiment analysis should be used as part of a comprehensive trading strategy. No single indicator can predict market movements with certainty. Exercise proper risk management and maintain realistic expectations about indicator performance across varying market conditions.อินดิเคเตอร์ Pine Script®โดย tradedots119
RCV Essentials════════════════════════════════════════════ RCV ESSENTIALS - MULTI-TIMEFRAME & SESSION ANALYSIS TOOL ════════════════════════════════════════════ 📊 WHAT THIS INDICATOR DOES This professional-grade indicator combines two powerful analysis modules: 1. TRADING SESSION TRACKER - Visualizes high/low ranges for major global market sessions (NY Open, London Open, Asian Session, etc.) 2. MULTI-TIMEFRAME CANDLE DISPLAY - Shows up to 8 higher timeframes simultaneously on your chart (15m, 30m, 1H, 4H, 1D, 1W, 1M, 3M) ════════════════════════════════════════════ 🎯 KEY FEATURES ════════════════════════════════════════════ TRADING SESSIONS MODULE: ✓ Track up to 6 custom trading sessions simultaneously ✓ Real-time high/low range detection during active sessions ✓ Pre-configured for NYO (7-9am), LNO (2-3am), Asian Session (4:30pm-12am) ✓ 60+ global timezone options ✓ Customizable colors, labels, and transparency ✓ Daily divider lines (optional Sunday skip for traditional markets) ✓ Only displays on ≤30m timeframes for optimal clarity MULTI-TIMEFRAME CANDLES MODULE: ✓ Display 1-8 higher timeframes with up to 10 candles each ✓ Real-time candle updates (non-repainting) ✓ Fully customizable colors (separate bullish/bearish for body/border/wick) ✓ Adjustable candle width, spacing, and positioning ✓ Smart label system (top/bottom/both, aligned or follow candles) ✓ Automatic timeframe validation (only shows TFs higher than chart) ✓ Memory-optimized with automatic cleanup ════════════════════════════════════════════ 🔧 HOW IT WORKS ════════════════════════════════════════════ TECHNICAL IMPLEMENTATION: Session Tracking Algorithm: • Detects session start/end using time() function with timezone support • Continuously monitors and updates high/low during active session • Finalizes range when session ends using var persistence • Draws boxes using real-time bar_index positioning • Maintains session ranges across multiple days for reference Multi-Timeframe System: • Uses ta.change(time()) detection to identify new MTF candle formation • Constructs candles using custom Type definitions (Candle, CandleSet, Config) • Stores OHLC data in arrays with automatic size management • Renders using box objects (bodies) and line objects (wicks) • Updates current candle every tick; historical candles remain static • Calculates dynamic positioning based on user settings (offset, spacing, width) Object-Oriented Architecture: • Custom Type "Candle" - Stores OHLC values, timestamps, visual elements • Custom Type "CandleSet" - Manages arrays of candles + settings per timeframe • Custom Type "Config" - Centralizes all display configuration • Efficient memory management via unshift() for new candles, pop() for old Performance Optimizations: • var declarations minimize recalculation overhead • Conditional execution (sessions only on short timeframes) • Maximum display limits prevent excessive object creation • Timeframe validation at barstate.isfirst reduces redundant checks ════════════════════════════════════════════ 📈 HOW TO USE ════════════════════════════════════════════ SETUP: 1. Add indicator to chart (works best on 1m-30m timeframes) 2. Open Settings → "Trading Sessions" group - Enable desired sessions (NYO, LNO, AS, or custom) - Select your timezone from 60+ options - Adjust colors and transparency 3. Open Settings → "Multi-TF Candles" group - Enable timeframes (TF1-TF8) - Configure each timeframe and display count - Customize colors and layout READING THE CHART: • Session boxes show high/low ranges during active sessions • MTF candles display to the right of current price • Labels identify each timeframe (15m, 1H, 4H, etc.) • Real-time updates on the most recent MTF candle TRADING APPLICATIONS: Session Breakout Strategy: → Identify session high/low (e.g., Asian session 16:30-00:00) → Wait for break above/below range → Confirm with higher timeframe candle close → Enter in breakout direction, stop at opposite side of range Multi-Timeframe Confirmation: → Spot setup on primary chart (e.g., 5m) → Verify 15m, 1H, 4H candles align with trade direction → Only take trades where higher TFs confirm → Exit when higher TF candles show reversal Combined Session + MTF: → Asian session establishes range overnight → London Open breaks Asian high → Confirm with bullish 15m + 1H candles → Enter long with stop below Asian high ════════════════════════════════════════════ 🎨 ORIGINALITY & INNOVATION ════════════════════════════════════════════ What makes this indicator original: 1. INTEGRATED DUAL-MODULE DESIGN Unlike separate session or MTF indicators, this combines both in a single performance-optimized script, enabling powerful correlation analysis between session behavior and timeframe structure. 2. ADVANCED RENDERING SYSTEM Uses custom Pine Script v5 Types with dynamic box/line object management instead of basic plot functions. This enables: • Precise visual control over positioning and spacing • Real-time updates without repainting • Efficient memory handling via automatic cleanup • Support for 8 simultaneous timeframes with independent settings 3. INTELLIGENT SESSION TRACKING The algorithm continuously recalculates ranges bar-by-bar during active sessions, then preserves the final range. This differs from static zone indicators that simply draw fixed boxes at predefined levels. 4. MODULAR ARCHITECTURE Custom Type definitions (Candle, CandleSet, Config) create extensible, maintainable code structure while supporting complex multi-timeframe operations with minimal performance impact. 5. PROFESSIONAL FLEXIBILITY Extensive customization: 6 configurable sessions, 8 timeframe slots, 60+ timezones, granular color/sizing/spacing controls, multiple label positioning modes—adaptable to any market or trading style. 6. SMART VISUAL DESIGN Automatic timeframe validation, dynamic label alignment options, and intelligent spacing calculations ensure clarity even with multiple timeframes displayed simultaneously. ════════════════════════════════════════════ ⚙️ CONFIGURATION OPTIONS ════════════════════════════════════════════ TRADING SESSIONS: • Session 1-6: On/Off toggles • Time Ranges: Custom start-end times • Labels: Custom text for each session • Colors: Individual color per session • Timezone: 60+ options (Americas, Europe, Asia, Pacific, Africa) • Range Transparency: 0-100% • Outline: Optional border • Label Display: Show/hide session names • Daily Divider: Dotted lines at day changes • Skip Sunday: For traditional markets vs 24/7 crypto MULTI-TF CANDLES: • Timeframes 1-8: Enable/disable individually • Timeframe Selection: Any TF (seconds to months) • Display Count: 1-10 candles per timeframe • Bullish Colors: Body/Border/Wick (independent) • Bearish Colors: Body/Border/Wick (independent) • Candle Width: 1-10+ bars • Right Margin: 0-200+ bars from edge • TF Spacing: Gap between timeframe groups • Label Color: Any color • Label Size: Tiny/Small/Normal/Large/Huge • Label Position: Top/Bottom/Both • Label Alignment: Follow Candles or Align ════════════════════════════════════════════ 📋 TECHNICAL SPECIFICATIONS ════════════════════════════════════════════ • Pine Script Version: v5 • Chart Overlay: True • Max Boxes: 500 • Max Lines: 500 • Max Labels: 500 • Max Bars Back: 5000 • Update Frequency: Real-time (every tick) • Timeframe Compatibility: Chart TF must be lower than selected MTFs • Session Display: Activates only on ≤30 minute timeframes • Memory Management: Automatic cleanup via array operationsอินดิเคเตอร์ Pine Script®โดย RCVisionaries60
Last 10 Sessions: High, Low, Pivot, GapLast 10 Sessions: High, Low, Pivot, Gap This indicator highlights the most important price levels from the last 10 completed trading sessions to help intraday and swing traders quickly spot potential support, resistance, and price reaction zones. Key Features: Previous Highs and Lows : Visualize the high and low from each of the past 10 sessions. These are the most commonly tested breakout and reversal points for day trading. Session Pivots: The classic pivot formula ((High + Low + Close) / 3) for each of the last 10 sessions, often acting as a market “equilibrium” or intraday magnet. Gaps: Displays the difference between each day’s open and the previous session’s close (“gap”), showing sentiment shifts and possible gap fill targets. Clean, Faded Visuals: All lines and labels are subtly faded so your chart remains clear and uncluttered, with each level labeled by how many sessions ago it occurred. Full Customization: Instantly toggle any level type (High, Low, Pivot, Gap) ON/OFF in settings, extend lines to the right, and adjust their forward length. Bulletproof Logic: Never throws runtime errors. Lines and labels only display when valid data is present. How to Use: Use recent highs/lows for breakout, breakdown, or mean reversion trades. Spot where multiple levels from past sessions cluster together for high-probability reversal or breakout areas. Watch pivots for intraday bias, and gaps for sentiment and possible fill plays. Perfect for all intraday timeframes. If you want a powerful yet minimal map of where price is most likely to react, this indicator is for you! Developed by อินดิเคเตอร์ Pine Script®โดย nvijaybhargav771137
Forex Sessions UTC + customise (DST Support)This Pine Script is designed to highlight forex trading sessions on a TradingView chart, showing which session (Asia, London, New York, Frankfurt, Sydney) is active based on your selected timezone offset and daylight saving time (DST) settings. It also includes an option to highlight session overlaps, like the London-New York and Asia-London overlaps. Let's break down the script in detail: ### 1. **Inputs**: * **`timezoneOffset`**: * This input allows you to select your local timezone offset in hours relative to UTC (e.g., -2 for UTC-2 or +3 for UTC+3). It helps adjust the session times based on your local time. * **`isDST`**: * A boolean input that determines if Daylight Saving Time (DST) is active or not. If DST is enabled, the session times will be adjusted by one hour. ### 2. **Function: `timeInDailyRange`**: This function checks if the current time (bar) is within a given session's start and end time. * **`startH, startM`**: Start time of the session (hours and minutes). * **`endH, endM`**: End time of the session (hours and minutes). * **`tzOffset`**: The timezone offset in hours (which adjusts the start and end times for different regions). The function handles sessions that cross over midnight. For example, the Asia session starts at 23:00 UTC and ends at 07:00 UTC, so it checks if the current time falls within that period. ### 3. **Session Times (in UTC)**: Each trading session has specific times defined in UTC: * **Asia Session**: 23:00 UTC to 07:00 UTC * **London Session**: 08:00 UTC to 16:00 UTC * **New York Session**: 13:00 UTC to 21:00 UTC * **Frankfurt Session**: 07:00 UTC to 15:00 UTC * **Sydney Session**: 21:00 UTC to 05:00 UTC These times are defined in 24-hour format, and they represent the opening and closing hours for each market. The script uses specific colors to represent different sessions: * **Asia**: Yellow (`asiaColor`) * **London**: Red (`londonColor`) * **New York**: Navy Blue (`nyColor`) * **Frankfurt**: Blue (`frankfurtColor`) * **Sydney**: Green (`sydneyColor`) * **Overlaps**: * London-NY overlap: Purple (`overlapLN`) * Asia-London overlap: Orange (`overlapAL`) These colors are used to highlight the background during active sessions. ### 5. **Session Highlighting**: The script uses the `bgcolor` function to change the background color of the chart when a session is active. * For each session, it checks whether the current time (bar) falls within the session's time range (adjusted by the `timezoneOffset`). * If a session is active, it will highlight the chart background in the corresponding session color. ### 6. **Overlaps**: * **London-NY Overlap**: The script checks if both the London session and the New York session are active at the same time (i.e., if their time ranges overlap). If so, it highlights the overlap area in purple. * **Asia-London Overlap**: Similarly, the script checks if both the Asia and London sessions are active at the same time, and if so, it highlights the overlap area in orange. ### 7. **Daylight Saving Time (DST) Adjustment**: * If the **`isDST`** flag is enabled (i.e., DST is active), the script adjusts the session start and end times by adding one hour to each session. This is because during DST, trading hours shift by one hour (usually in regions that observe DST). * This adjustment is applied to all session times, so the script accounts for the time change and ensures that the session times are correctly displayed. ### 8. **Final Background Color Logic**: * The `bgcolor` function checks whether each session is active by calling `timeInDailyRange` for each session and then colors the chart accordingly. * It also checks for overlapping sessions and colors the chart with the appropriate overlap color. ### Example Scenario: 1. **Timezone Offset**: If you select `timezoneOffset = 3` (UTC+3), the session times will be adjusted by adding 3 hours to the start and end times. 2. **Daylight Saving Time (DST)**: If `isDST = true` is selected, the session start times will shift by 1 hour forward (e.g., 23:00 UTC becomes 00:00 UTC for Asia). 3. **Visual Outcome**: The chart will display different colors in the background depending on which trading session is active (e.g., red for London, navy for New York), and purple or orange for overlap sessions. ### Key Features: * **Customizable Timezone Offset**: Adjust session times to reflect your local timezone. * **Daylight Saving Time Support**: Automatically adjusts session times during DST. * **Highlighting Sessions**: Color the chart background to visualize when different trading sessions are active. * **Overlap Highlighting**: Highlights the periods when certain sessions overlap (London-NY, Asia-London). In summary, this script is useful for traders who want to visually see when different forex trading sessions are active on the chart, with flexibility for timezone and DST adjustments. อินดิเคเตอร์ Pine Script®โดย essib913
Trading Sessions with Highs and LowsTrading Sessions with Highs and Lows is designed to visually highlight specific trading sessions on the chart, providing traders with key insights into market behavior during these time periods. Here’s a detailed explanation of how the indicator works: Key Features 1. Session Boxes: • The indicator plots colored boxes on the chart to represent the price range of defined trading sessions. • Each box spans the session’s start and end times and encapsulates the high and low prices during that period. • Two trading sessions are defined by default: • USA Trading Session: 9:30 AM - 4:00 PM (New York Time). • UK Trading Session: 8:00 AM - 4:30 PM (London Time). 2. Session Labels: • The name of the session (e.g., “USA” or “UK”) is displayed above the session box for clear identification. 3. High and Low Markers: • Markers are added to the chart at the session’s high and low points: • High Marker: A green label indicating the session high. • Low Marker: A red label indicating the session low. 4. Dynamic Reset: • After the session ends, the session high and low values are reset to na to prepare for the next trading day. 5. Customizable Background Colors: • Each session’s box has a distinct, semi-transparent background color for better visual separation. How It Works 1. Core Functionality: • A function, plot_box, takes the session name, start time, end time, and background color as input. • It calculates whether the current time is within the session. • During the session: • It tracks the session’s highest and lowest prices. • It identifies the bars where the high and low occurred. • At the session’s end: • It plots a box on the chart covering the session’s time and price range. • Labels are created for the session name and its high/low points. 2. Session Timing: • Timestamps for the USA and UK trading sessions are calculated using the timestamp function with respective time zones. 3. Visual Elements: • The box.new function draws the session boxes on the chart. • The label.new function creates session name and high/low labels. Usage • Overlay Mode: The indicator is applied directly on the price chart (overlay=true), making it easy to visualize session-specific price behavior. • Trading Strategy: • Identify session-specific support and resistance levels. • Observe price action trends during key trading periods. • Align trading decisions with session dynamics. Customization While the indicator is preset for the USA and UK trading sessions, it can be easily modified: 1. Add/Remove Sessions: Define additional sessions by providing their start and end times. 2. Change Colors: Update the background_color in the plot_box calls to use different colors for sessions. 3. Adjust Time Zones: Replace the current time zones with others relevant to your trading style. Visualization Example • USA Session: • Time: 9:30 AM - 4:00 PM (New York Time). • Box Color: Semi-transparent orange. • UK Session: • Time: 8:00 AM - 4:30 PM (London Time). • Box Color: Semi-transparent green. Why Use This Indicator? 1. Market Awareness: Easily spot price behavior during high-liquidity trading periods. 2. Trend Analysis: Analyze how sessions overlap or affect each other. 3. Session Boundaries: Use session high/low levels as dynamic support and resistance zones. This indicator is an essential tool for intraday and swing traders who want to align their strategies with key market timings.อินดิเคเตอร์ Pine Script®โดย djanmamur303
Forex Session Tracker [MacroGlide]Forex Session Tracker is a tool designed to track and visualize trading activity across the four key Forex market sessions: New York, London, Tokyo, and Sydney. The indicator helps traders see the time intervals of each session, their impact on price movements, and analyze volatility within these sessions. Key Features: • Session Visualization: The indicator highlights price ranges during the New York, London, Tokyo, and Sydney sessions using different colors, making data easier to visually interpret and analyze. Users can customize the color scheme for each session. • Price Change Analysis: The indicator tracks the opening prices of each session and calculates the price changes by the session's close. This allows traders to assess market dynamics within each session and make informed trading decisions. • Average Price Changes: The average price change for a specified number of sessions is calculated for each session, helping to identify trends and volatility levels. • Time Zone Support: The indicator takes into account time zones, allowing users to adjust the display according to their location or use the market's time zone. • Interactive Dashboard: The built-in dashboard shows the status of each session in real-time (active or inactive), recent price changes, and average changes, providing quick access to key information directly on the chart. How to Use: • Add the indicator to your chart and configure the displayed sessions according to your needs. • Use color differentiation to easily identify active trading sessions and assess their impact on price movements. • Monitor price changes in each session and analyze averages for a deeper understanding of market trends. Methodology: The indicator uses the time intervals of each trading session to calculate and display opening prices, price ranges, and price changes for the session. Based on this data, the Forex Session Tracker visualizes the session's high and low prices and calculates the average price change over the last several sessions. All data is displayed in real-time, considering the user's time zone settings or the market's time zone. Originality and Usefulness: Forex Session Tracker stands out for its ability to combine price change information from several key trading sessions into one indicator, providing traders with a simple and clear way to analyze market activity across different time zones. Charts: The indicator displays clean and clear charts, where each trading session is highlighted with its own color, making visual interpretation easier. The charts focus only on essential information for analysis: opening prices, session ranges, and price changes. The integrated dashboard provides quick access to key session metrics, such as activity status, recent price changes, and average values for the selected period. These features make the charts highly useful for rapid analysis and trading decision-making. Enjoy the game! อินดิเคเตอร์ Pine Script®โดย MacroGlide250
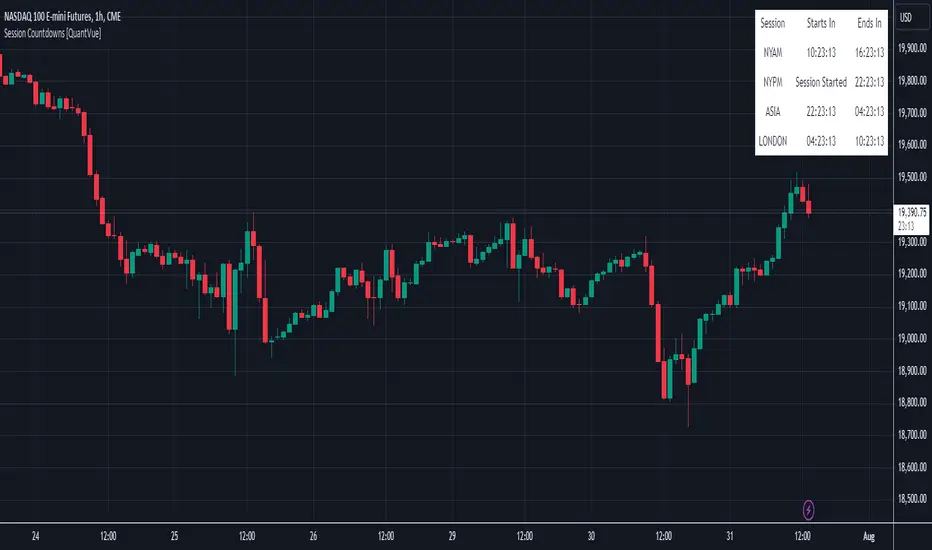
Session Countdowns [QuantVue]The Session Countdowns indicator is a powerful tool designed for traders who want to keep track of multiple trading sessions throughout the day. This indicator allows users to customize and monitor up to four different trading sessions with real-time countdowns until the session starts and ends. Customizable Sessions: Define up to four trading sessions with specific start and end times. Customize session names for easy identification (e.g., NYAM, NYPM, ASIA, LONDON). Real-Time Countdown: Displays countdown timers for each session, showing time remaining until the session starts and ends. Real-time updates ensure accurate and timely information. Display Options: Choose the display position on the chart (Top, Middle, Bottom) and alignment (Left, Center, Right). Select table size. Dynamic color theme adjusts the text and background colors based on the session status (upcoming, active, ending soon). Alerts: Receive alerts 30 minutes before a session starts, ensuring you never miss a crucial trading period. Alerts can be customized for each session, providing timely reminders. Give this indicator a BOOST and COMMENT your thoughts below! We hope you enjoy. Cheers!อินดิเคเตอร์ Pine Script®โดย QuantVue125
Session Status Table📌 Session Status Table Session Status Table is an indicator that displays the real-time status of the four major trading sessions: * 🇯🇵 Asia (Tokyo) * 🇬🇧 London * 🇺🇸 New York AM * 🇺🇸 New York PM It shows which sessions are currently open, how much time remains until they open or close, and optionally sends alerts in advance. 🧩 Features: * Real-time session table — shows the status of each session on the chart. * Color-coded statuses: * 🟢 Green – Session is open * 🔴 Red – Session is closed * ⚪ Gray – Weekend * Countdown timers until session open or close. * User alerts — receive a notification a custom number of minutes before a session starts. ⚙️ Customization: * Table position — fully configurable. * Session colors — customizable for open, closed, and weekend states. * Session labels — customizable with icons. * Notifications: * Enabled through TradingView's Alerts panel. * User-defined lead time before session opens. 🕒 Time Zones: All times are calculated in UTC to ensure consistency across different markets and regions, avoiding discrepancies from time zones and daylight saving time. 🚨 How to enable alerts: 1. Open the "Alerts" panel in TradingView. 2. Click "Create Alert". 3. In the condition dropdown, choose "Session Status Table". 4. Set to any alert() trigger. 5. Save — you'll be notified a set number of minutes before each session begins. ℹ️ Technical Notes: * Built with Pine Script version 6. * Logically divided into clear sections: inputs, session calculations, table rendering, and alerts. * Optimized for performance and reliability on all timeframes. Ideal for traders who use session activity in their strategies — especially in Forex, crypto, and futures markets. อินดิเคเตอร์ Pine Script®โดย Gleb_Cryptoxที่อัปเดต: 1189
Session CandlesThis indicator is designed to visually represent different trading sessions on a price chart, highlighting candlestick colors to distinguish between bullish (upward movement) and bearish (downward movement) trends during various market sessions. Here's an overview of how the indicator works: 1. Session Definition: The indicator defines four distinct trading sessions: - London Session: Typically covering the European trading hours. - New York AM Session: Representing the morning hours of the New York trading session. - New York PM Session: Representing the afternoon hours of the New York trading session. - Asia Session: Encompassing the trading hours of the Asian markets. 2. Configuration Options: Users can customize the behavior of the indicator through input options. For each session, users can enable or disable the display of session-specific candles. 3. Candle Coloring: The indicator determines the color of candles based on the following criteria: - For each session, it checks whether the current candle's closing price is higher than its opening price. - If the closing price is higher, the candle is considered bullish, and a user-defined green color is used for the candle. - If the closing price is lower, the candle is considered bearish, and a user-defined red color is applied. 4. Display: The indicator then applies the calculated candle colors to the respective candles of each trading session on the price chart. This visual distinction helps traders quickly identify the prevailing trend during different market sessions. To use the indicator, traders can overlay it on their price charts in TradingView. By enabling or disabling specific trading sessions, they can focus on the trends and price movements during those specific time periods. Please note that the actual appearance of the indicator on the chart depends on the user's chosen settings for session enablement and color preferences.อินดิเคเตอร์ Pine Script®โดย SIeyder66129
ICT Sessions_One Setup for Life [MK]The script plots the High/Low of the following trading sessions: London - 02:00-05:00 NY AM - 09:30-12:00 New York Lunch - 12:00-13:30 New York PM - 13:30-16:00 Due to the high level of liquidity (resting orders), highs and lows of these sessions may be used as buy/sell areas and also as profit target areas. Typically, buy orders would be initiated below a session low and sell orders would be initiated above a session high. The script also plots 'RTH (Regular Trading Hours) Opening Gaps'. The RTH gaps are drawn from the closing price of regular trading at 16:15 (EST) to the open price of regular trading at 09:30 (EST). Gaps can be areas that traders might anticipate to be filled at some time in the future. A gap 'midline' is available if needed and yesterday RTH close line can be shown and extended to the current bar. This script is simply a means to draw boxes around certain areas/periods on the charts. It is in no way a trading strategy and users should spend much time to study the concept and should also perform extensive back-testing before taking any trades. By setting the lookback value to a much higher value then the default of 6, users can utilise the script to perform their own backtesting studies. The above chart shows the default setup of the indicator. Note that the user has to choose how far (in days) to lookback and draw the sessions/gaps. It is also possible to show the session high//low lines and extend them to the current bar time. If this is used it is advised to keep the lookback period as low as possible to ensure charts stay clean/uncluttered. All boxes/lines styles/colors are fully customisable.อินดิเคเตอร์ Pine Script®โดย malk1903ที่อัปเดต: 7373 1.5 K
First presented ineficiency indicator - 10 sessions📊 Enhanced FVG Indicator with Multi-Session Support Overview The Enhanced FVG (Fair Value Gap) Indicator is a professional-grade tool designed for traders who want to identify and track Fair Value Gaps across multiple trading sessions. This indicator combines advanced FVG detection with smart extension modes, customizable alerts, and automatic instrument calibration. 🎯 What is a Fair Value Gap (FVG)? A Fair Value Gap occurs when there's a price imbalance in the market, creating a "gap" that the price often revisits. This happens when: Bullish FVG: The high of candle 2 bars ago is below the low of the current candle Bearish FVG: The low of candle 2 bars ago is above the high of the current candle FVGs are powerful supply and demand zones that smart money traders use to identify potential reversal or continuation points. ✨ Key Features 🔟 Multiple Session Support 10 Configurable Sessions: Track FVGs across different time windows throughout the day Independent Control: Enable/disable each session individually Custom Session Times: Define your own session hours in any timezone Unique Colors: Each session has its own customizable color scheme Session Labels: Clear identification with customizable labels (S1-S10) 🎨 Modern Label System Text-Only Labels: Clean, modern design without background boxes 9 Position Options: Place labels anywhere on the FVG (Top/Middle/Bottom × Left/Center/Right) Dynamic Information: Shows session name, direction (↑/↓), and size in points Adjustable Size: Choose from Tiny, Small, Normal, Large, or Huge text Custom Colors: Full control over label text color 📏 Smart Extension Modes 1. Follow Current Bar FVGs dynamically extend to follow the current price action Configurable bar offset (-50 to +50) to project ahead or stop before current bar Perfect for real-time trading and keeping your chart clean 2. Until Time Extend FVGs until a specific time of day (HHMM format) Ideal for intraday traders with specific market closure times Example: Stop all FVGs at 1600 (4:00 PM) 3. Until Retest Automatically stop extending when price retests the FVG Three sensitivity levels: Touch: Wick touches the FVG zone Close Inside: Close price enters the FVG Full Body Inside: Entire candle body within the FVG Great for validating FVG fills and trading opportunities 🔔 Advanced Alert System Creation Alerts: Get notified when a new FVG forms Format: "FVG Created: S1 ↑ 79pts @ 70339.00-70418.30" Retest Alerts: One-time alert when price revisits a FVG Format: "FVG Retested: S1 @ 70380.00" Configurable: Enable/disable alerts independently No Spam: Each FVG only triggers one retest alert 🧮 Automatic Point Calculation The indicator automatically detects your instrument type and calculates FVG size correctly: Crypto: Bitcoin, Ethereum, Altcoins (÷10 or ÷100) Forex: All major pairs with correct pip calculation Futures: ES, NQ, YM, CL, GC with proper point values Indices: S&P500, NASDAQ, etc. (1 point = 1 point) Stocks: Penny and dollar stocks (cents calculation) Manual Override: Option to set custom divisor if needed 🎯 Consequent Encroachment (CE) Middle Line: Shows the 50% level of each FVG Customizable Style: Solid, Dashed, or Dotted Adjustable Thickness: 1-5 pixel width Custom Color: Match your chart theme Toggle On/Off: Show or hide as needed 🌍 Timezone Support 4 Major Timezones: America/New_York, UTC, Europe/London, Asia/Tokyo Session-Based: Define sessions in your preferred timezone Global Trading: Works for traders anywhere in the world 📋 Default Configuration Active Sessions (1-5): Session 1: 09:31-09:49 (Market Open) Session 2: 09:50-10:30 (Morning Momentum) Session 3: 10:50-11:10 (Mid-Morning) Session 4: 11:50-12:10 (Pre-Lunch) Session 5: 13:30-14:10 (Post-Lunch) Additional Sessions (6-10): Disabled by default, customize as needed Colors: S1: Blue | S2: Purple | S3: Orange | S4: Yellow | S5: Aqua S6: Green | S7: Red | S8: Fuchsia | S9: Lime | S10: Teal 🚀 How to Use Basic Setup Add the indicator to your chart Select your timezone Enable desired sessions (1-5 active by default) Choose your extension mode Configure alerts if needed Trading Strategies Intraday Scalping: Use "Until Retest" mode with "Touch" sensitivity Enable alerts for quick entries Focus on Sessions 1-2 for high volatility Swing Trading: Use "Until Time" mode to extend FVGs to market close Set retest sensitivity to "Close Inside" for confirmation Track multiple sessions for confluence zones Smart Money Concepts: Combine FVGs with order blocks and liquidity zones Use CE line for partial profit targets Watch for FVG retests at key support/resistance levels ⚙️ Performance Optimizations Efficient Rendering: Max 500 boxes, labels, and lines Historical Limit: Display up to 30 days of FVGs Memory Management: Inactive FVGs automatically marked Real-Time Updates: Dynamic extension without lag 📊 Compatible Instruments ✅ Cryptocurrencies (Bitcoin, Ethereum, Altcoins) ✅ Forex Pairs (All majors and crosses) ✅ Futures Contracts (Indices, Commodities, Metals) ✅ Stock Indices (S&P500, NASDAQ, DOW) ✅ Individual Stocks ✅ Any instrument on TradingView 🎓 Understanding FVG Trading Why FVGs Matter: Represent inefficient price action Act as magnets for price retracement Often mark institutional order flow High probability reversal zones Best Practices: Combine with volume analysis Use higher timeframe FVGs for stronger zones Wait for confirmation before entry Place stops beyond the FVG boundaries 🔧 Customization Options Visual Settings: 10 session colors Border color (transparent by default) CE line color, style, and thickness Label size, color, and position Functional Settings: Extension mode (Follow/Time/Retest) Bar offset (-50 to +50) Retest sensitivity (3 levels) Alert preferences Calculation Settings: Auto-detect point divisor Manual divisor override Maximum days to display 💡 Tips & Tricks Reduce Chart Clutter: Disable sessions you don't trade Session Optimization: Adjust session times to match your market's volatility Confluence Trading: Enable multiple sessions to find overlapping FVGs Mobile Trading: Use alerts to trade on-the-go Backtesting: Increase max days to analyze historical FVG behavior 📝 Version History v1.0 - Initial Release 10 configurable sessions 3 extension modes Automatic point calculation Alert system Modern label design Consequent encroachment support 🤝 Support & Feedback If you find this indicator helpful, please leave a review and share your experience! For questions or feature requests, feel free to comment below. Happy Trading! 🎯📈 อินดิเคเตอร์ Pine Script®โดย Frenchy_Trades28
Quantura - Session High/LowIntroduction “Quantura – Session High/Low” is a professional-grade session mapping indicator that automatically identifies and visualizes the highs, lows, and ranges of key global trading sessions — London, New York, and Asia. It helps traders understand when and where liquidity tends to accumulate, allowing for better market structure analysis and session-based strategy alignment. Originality & Value This indicator unifies the three most influential global sessions into a single, adaptive visualization tool. Unlike typical session indicators, it dynamically updates live session highs and lows in real time while marking session boundaries and transitions. Its multi-session management system allows for immediate recognition of overlapping liquidity zones — a crucial feature for institutional and intraday traders. The value and originality come from: Real-time tracking of session highs, lows, and developing ranges. Simultaneous visualization of multiple global sessions. Optional vertical range lines for clearer visual segmentation. Customizable session times, colors, and time zone offset for global accuracy. Automatically extending and updating lines as each session progresses. Functionality & Core Logic Detects the start and end of each trading session (London, New York, Asia) using built-in time logic and user-defined UTC offsets. Initializes session-specific high and low variables at the start of each new session. Continuously updates session high/low levels as new candles form. Draws color-coded horizontal lines for each session’s high and low. Optionally adds vertical dotted lines to visually connect session range extremes. Locks each session’s range once it ends, preserving historical structure for review. Parameters & Customization New York Session: Enable/disable, customize time (default 15:30–21:30), and set color. London Session: Enable/disable, customize time (default 09:00–16:30), and set color. Asia Session: Enable/disable, customize time (default 02:30–08:00), and set color. Vertical Line: Toggle dotted vertical lines connecting session high and low levels. UTC Offset: Adjust session timing to align with your chart’s local time zone. Visualization & Display Each session is color-coded for quick identification (default: blue for London, red for New York, green for Asia). Horizontal lines track evolving session highs and lows in real time. Once a session closes, the lines remain fixed to mark historical range boundaries. Vertical dotted lines (optional) visually connect the session’s high and low for clarity. Supports full overlay display without interfering with other technical indicators. Use Cases Identify liquidity zones and range extremes formed during active trading sessions. Observe session overlaps (London–New York) to anticipate volatility spikes. Combine with volume or market structure tools for session-based confluence. Track how price interacts with prior session highs/lows to detect potential reversals. Analyze session-specific performance patterns for algorithmic or discretionary systems. Limitations & Recommendations The indicator is designed for intraday analysis and may not provide meaningful output on daily or higher timeframes. Adjust session times and UTC offset based on your broker’s or exchange’s timezone. Does not provide trading signals — it visualizes session structure only. Combine with liquidity and volatility indicators for full contextual understanding. Markets & Timeframes Compatible with all asset classes — including crypto, forex, indices, and commodities — and optimized for intraday timeframes (1m–4h). Particularly useful for traders analyzing session overlaps and volatility transitions. Author & Access Developed 100% by Quantura. Published as a Open-source script indicator. Access is free. Compliance Note This description fully complies with TradingView’s Script Publishing Rules and House Rules . It provides a detailed explanation of functionality, parameters, and realistic use cases without making any performance or predictive claims.อินดิเคเตอร์ Pine Script®โดย Quantura110