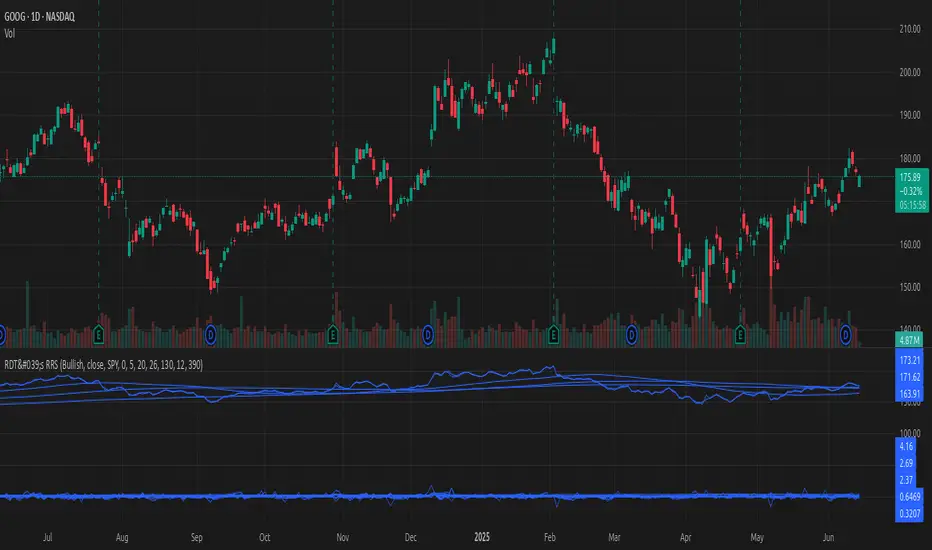
[#ps #mft] RDT's Real Relative StrengthIndicator to use with Pine Screener for filtering watchlists with RDT's Real Relative Strength.
See r/realdaytrading for more info on the RRS.
How to:
1. Mark the indicator as "Favorite".
2. Open Pine Screener.
3. Choose a watchlist.
4. Choose this indicator.
5. Change the settings as needed.
6. Make sure you set timeframe to "5 minutes" and not the default "1 day".
If you choose "Bullish trend", then "Signal X" is a shortcut for RRS > 0 for that timeframe. Similarly "Bearish trend" for "Signal X" means RRS < 0.
Pro-tip #1: use Symbol syncing between tabs to easily go over the results.
Pro-tip #2: you can have two tabs open for "Bullish" and "Bearish" pine screeners (even synced to the same color), so you don't have to change settings everytime.
ค้นหาในสคริปต์สำหรับ "screener"
Correlation AnalysisAs the name suggests, this indicator is a market correlation analysis tool.
It contains two main features:
- The Curve: represents the historic correlation coefficient between the current chart and the “Reference Market” input from the settings menu. It aims to give more depth to the current correlation values found in the second feature.
- The Screener: this second feature displays all correlation coefficient values between the (max) 20 markets inputs. You can use it to create several screeners for several market types (crypto, forex, metals, etc.) or even replicate your current portfolio of investments and gauge the correlation of its components.
Aside from these two previous features, you can visually plot the variation rate from one bar to another along with the covariance coefficient (both used in the correlation calculation). Finally, a simple “signal” moving average can be applied to the correlation coefficient .
I might add alerts to this script or even turn it into a strategy to do some backtesting. Do not hesitate to contact me or comment below if this is something you would be interested in or if you have any suggestions for improvement.
Enjoy!!

Gabriel's Squeeze Momentum📊 Gabriel’s Squeeze Momentum — Deluxe Volatility + Momentum Suite
An advanced, all-in-one squeeze & momentum framework that times volatility compression/expansion and trend shifts, with optional CVD (cumulative volume delta) momentum, ATR zone context, Discontinued Signal Lines (DSL) scalps, Colored DMI trend label, Williams VIX Fix (WVF) low-volatility exhaustion pings, Buff’s VTTI/VPCI volume confirmation, and real-time divergence detection.
What it does:
Discover Squeezes. They occur when volatility contracts, often preceding significant price moves.
Measures momentum with a fast, ATR-normalized linear regression—optionally on Price or CVD—so you see direction and “how hard it’s pushing.”
🧭 Signal Legend ~ Colors the squeeze so you instantly know regime:
🟡 / 🟣 (Tight/Very Tight): Coiled spring; prepare a plan.
🔴 / ⚫ = (Regular/Wide): Watch for Divergences between Price and Momentum.
🟢 (Fired): Expansion started; trade with momentum cross and bias.
Adds context bands at ±1/±2/±3 ATR (“trend / expansion / OB-OS”) to filter late or weak signals.
DSL (Discontinued Signal Lines) give early scalp flips on momentum vs. adaptive bands.
DMI label & triangles communicate trend strength and whether +DI / −DI is in control.
Williams VIX Fix flags capitulation/exhaustion style spikes (with optional VIX proxy).
VTTI/VPCI modules confirm when volume aligns with price trend or contradicts it.
Divergences (regular & hidden) auto-draw with optional live (may repaint) or on-close.
🎢 Squeeze Momentum — How the Logic Works 🎢
The Squeeze Momentum model is built on the principle of volatility compression and expansion. In markets, periods of low volatility are often followed by explosive moves, while high volatility eventually contracts. The “squeeze” seeks to identify these compression phases and prepare traders for the likely expansion that follows.
This indicator achieves that by comparing Bollinger Bands (BB) to Keltner Channels (KC).
Bands: Bollinger vs. Keltner
Bollinger Bands (BB): Calculated using a Simple Moving Average (SMA) of price and standard deviations (σ) of the closing price. The bands expand and contract depending on volatility.
Keltner Channels (KC): Built from an SMA plus/minus multiples of the Average True Range (ATR). Unlike some simplified squeeze indicators that approximate ATR, this implementation uses a true ATR-based KC, ensuring accuracy across different assets and timeframes.
By comparing whether the Bollinger Bands are inside or outside the Keltner Channels, the indicator identifies different squeeze regimes, each representing a distinct volatility environment.
📦 Regime Colors
The squeeze states are color-coded for quick interpretation:
🔹Wide Squeeze (⚫): BB inside KC with a high ATR multiplier. Extremely low volatility, often before major expansion.
🔹Normal Squeeze (🔴): BB inside KC with a moderate ATR multiplier (about 25% more sensitive than Wide). Typical compression setting.
🔹Narrow Squeeze (🟡): BB inside KC with a lower ATR multiplier (about 50% more sensitive than Wide). Signals tighter compression.
🔹Very Narrow Squeeze (🟣): BB inside KC with the lowest ATR multiplier (100% more sensitive than Wide). Indicates extreme coiling.
🔹Fired Squeeze (🟢): BB break outside KC. Marks the release of volatility and potential trend acceleration.
This multi-layered system improves upon classical SQZPRO by using precisely calculated Keltner Channels and multiple sensitivity levels, giving traders more granular information about volatility states.
🔒 Multi-Timeframe Support
The indicator automatically adjusts squeeze thresholds for different timeframes — hourly, 4-hour, daily, weekly, and monthly charts. Each regime has been manually tuned for its timeframe, allowing traders to use the same tool whether scalping, swing trading, or holding longer-term positions.
🎯 Momentum Core
Detecting a squeeze is only half the equation — the indicator also includes a momentum engine to determine direction and strength.
Price momentum is measured as the distance of Close from its Highest High and Lowest Low range, smoothed with a Simple Moving Average, and refined with Linear Regression.
This value is then divided by ATR, normalizing momentum relative to volatility.
Optionally, CVD Mode (Cumulative Volume Delta ÷ Volume) can replace price momentum for assets where order-flow and volume dynamics dominate (e.g., crypto).
🦆 Signal Line
Momentum is paired with a Simple Moving Average signal line:
🔹Bullish: Momentum > Signal.
🔹Bearish: Momentum < Signal.
This crossover logic provides directional bias and filters for false squeezes.
🚀 When to Use Price vs. CVD
CVD Mode (Crypto, FX with tick volume): Best for assets with strong volume/order-flow signals.
Price Mode (Equities, Commodities, Higher TFs): Best for assets with irregular or thin volume data.
🛢️ATR Zones (context filter) 🛢️
Its design is straightforward yet effective: it measures the difference between the current price from its highest highs, lowest lows, and a moving average over a chosen period, then expresses that difference in terms of the Average True Range (ATR) over the same period. By normalizing price deviations against volatility, ATR provides a clear sense of how far and how fast price is moving relative to its “normal” range.
Interpreting the Zone
Positive Values: When it is above zero, price is trading above its HH, LL, and moving average, suggesting bullish momentum. The higher the value, the stronger the momentum relative to volatility.
Negative Values: When the Momentum is below zero, price is trading below its HH, LL, and moving average, signaling bearish momentum. The deeper the reading, the stronger the downside pressure.
Magnitude Matters: Because the Momentum is expressed in ATR units, traders can immediately gauge whether the move is small (less than 1 ATR), moderate (1–2 ATRs), or extreme (3+ ATRs). This makes it especially useful for assessing overbought or oversold conditions in a normalized way.
Strengths:
🔹Volatility-Normalized: Unlike simple squeeze momentum oscillators that have different OB/OS levels, this Momentum adjusts for volatility. This makes signals more consistent across assets with different volatility profiles.
🔹Simplicity:
±1 ATR: trending zone (bulls above +1, bears below −1)
±2 ATR: expansion (keep, add, or trail). Stretch/risk of mean reversion.
±3 ATR: potential exhaustion/mean-revert zone.
🔹Momentum Clarity: By framing momentum in ATR terms, it is easier to distinguish between a small deviation from trend and a genuinely significant move. Sometimes it is a good sign that it trend to ±3/2 ATR, looks for similar directional moves.
Color: The script shades +2/+3 (OB) and −2/−3 (OS) areas and provides swing alerts at ±1 ATR.
💚 What Are Discontinued Signal Lines (DSL)? 💚
In technical analysis, one of the most common tools for smoothing out noisy data is the signal line. This concept appears in many indicators, such as the MACD or stochastic oscillator, where the raw value of an indicator is compared to a smoothed version of itself. The signal line acts as a lagging filter, making it easier to identify shifts in momentum, crossovers, and directional changes.
While useful, the classic signal line approach has limitations. By design, a single smoothed line introduces lag, which means traders may receive signals later than ideal. Additionally, a one-size-fits-all smoothing process often struggles to adapt to different levels of volatility or rapidly changing market conditions.
This is where Discontinued Signal Lines (DSL) come in. DSL is an advanced extension of the traditional signal line concept. Instead of relying on just one smoothed comparison, DSL employs multiple adaptive lines that adjust dynamically to the current state of the indicator. These adaptive lines effectively “discontinue” the dependence on a single, fixed smoothing method, producing a more flexible and nuanced representation of market conditions.
How DSL Works?
Traditional Signal Line: Compares an the Momentum against its own moving average. Provides crossover signals when the raw indicator value moves above or below the smoothed line.
Strength: reduces noise. Weakness: delayed signals and limited adaptability.
DSL Extension: Uses multiple adaptive lines that respond differently to the indicator’s current behavior. Instead of one static moving average, the DSL approach creates faster and slower “reaction lines.” These lines adapt dynamically, capturing acceleration or deceleration in the indicator’s state.
Result: Traders see how momentum is evolving across multiple adaptive thresholds. This reduces false signals and improves responsiveness in volatile conditions.
Benefits of Discontinued Signal Lines
🔹Nuanced Trend Detection
DSL doesn’t just flag when momentum changes direction—it shows the quality of that shift, highlighting whether it is gaining strength, losing steam, or consolidating.
🔹Adaptability Across Markets
Because DSL adjusts to the Momentum’s own dynamics, it works well across different asset classes and timeframes, from equities and futures to forex and crypto.
🔹Earlier Signal Recognition
Multiple adaptive lines allow traders to spot developing trends earlier than with a single smoothed signal line, without being overwhelmed by raw indicator noise.
🔹Better Confirmation
DSL is particularly useful for confirmation. If both adaptive lines agree then a fill is applied in the direction, confidence in the trend is higher as the color turns bull/bear.
🔹Practical Uses
Momentum Trading: Spot acceleration or deceleration in trend strength.
Trend Confirmation: Verify whether a breakout has momentum behind it.
Noise Filtering: Smooth out erratic moves while retaining adaptability.
⚖️ Colored Directional Movement Index (CDMI) ⚖️
The Directional Movement Index (DMI), created by J. Welles Wilder, is one of the most respected trend-following indicators in technical analysis. It is actually a family of three separate indicators combined into one: the +DI (Positive Directional Indicator), the –DI (Negative Directional Indicator), and the ADX (Average Directional Index). Together, they measure not only whether the market is trending but also the strength of that trend. Traders have used the DMI for decades to identify trend direction, gauge momentum, and filter out periods of market noise.
However, despite its reliability, the traditional DMI can be challenging to interpret. Reading three separate lines at once and extracting meaningful signals requires both experience and careful observation. This complexity often discourages newer traders from fully utilizing its power.
The Colored Directional Movement Index (CDMI) is a modern reinterpretation of Wilder’s classic tool. It condenses the same information into a single visual line while using color, shape, and density to communicate what’s happening beneath the surface. The goal is simple: make the DMI’s insights faster to read, easier to act upon, and more intuitive to integrate into trading decisions.
Key Features of CDMI
🔹Color Scale for Trend Strength
The main triangle changes its base color depending on the strength of the DI reading. Dark Red or Green, colors correspond to stronger trends, while faded Gray or lighter yellow tones signal weaker or fading trends. This makes it visually clear when the market is consolidating versus trending strongly.
🔹Color Density for Momentum
Beyond strength, the CDMI uses color density to represent momentum in the trend’s strength. If the ADX is rising (trend gaining momentum), the triangles grows more darker. If the ADX is falling (trend losing momentum), the triangle becomes paler. This provides an instant sense of whether a trend is accelerating or decelerating.
🔹Directional Triangles for Trend Direction
To replace the separate +DI and –DI lines, the CDMI plots small triangle shapes along the bottom axis. An upward-facing triangle indicates that +DI is dominant, confirming bullish direction. A downward-facing triangle signals –DI dominance, confirming bearish direction. This way, both strength and direction are shown without the clutter of multiple overlapping lines.
🔹Label Display for Detailed Values
For traders who want precise data alongside the visuals, CDMI includes a label that shows:
Current trend strength (ADX value).
Current +DI and –DI values.
Momentum status of the ADX (rising or falling).
Historical values of DMI readings, so traders can track how the indicator has evolved over time.
Tooltips are also available to explain “How to read the colored DMI line”, making this version more beginner-friendly.
Why CDMI Matters
The CDMI retains the proven reliability of Wilder’s DMI while solving its biggest drawback—interpretation difficulty. Instead of juggling three separate plots, traders get a single, information-rich line supplemented with intuitive shapes and labels. This streamlined format makes trend verification, momentum analysis, and signal confirmation much faster.
For trading applications, the CDMI can help:
Confirm Entries by showing whether the market is trending strongly enough to justify a position.
Avoid False Signals by filtering out periods of low ADX (weak trend).
Enhance Timing by tracking momentum shifts in trend strength.
By simplifying the complexity of the original DMI into an elegant, color-coded tool, the CDMI makes one of technical analysis’ most advanced indicators practical for everyday use.
😅 The VIX, the Williams Vix Fix, and Market Bottoms 😎
The VIX, formally known as the CBOE Volatility Index, has long been considered one of the most reliable indicators for spotting major market bottoms. Often referred to as the “fear gauge,” it measures the market’s expectation of volatility in the S&P 500 over the next 30 days. When fear grips investors and volatility spikes, the VIX rises sharply. Historically, these moments of extreme fear often coincide with powerful buying opportunities, as markets have a tendency to rebound once panic selling exhausts itself.
Larry Williams, a well-known trader and author, developed the Williams Vix Fix as a way to replicate the insights of the VIX across any tradable asset. While the VIX itself is tied specifically to S&P 500 options, Williams wanted a tool that could capture similar panic-driven dynamics in stocks, futures, forex, and other markets where the VIX is not directly applicable. His “fix” uses price action and volatility formulas to approximate the same emotional extremes reflected in the official VIX, creating almost identical results in practice. This makes the Williams Vix Fix a powerful addition to the trader’s toolbox, allowing the same principle that works on U.S. equities to be applied universally.
One of the most important characteristics of both the VIX and the Williams Vix Fix is that they are far more reliable at signaling market bottoms than market tops. The reason is psychological as much as it is mathematical. At market bottoms, fear and panic are widespread. Retail investors often capitulate, selling in a frenzy as prices drop. This panic drives volatility higher, producing the spikes we see in the VIX. At the same time, professional traders and institutions—those with larger capital and more disciplined strategies—tend to step in when volatility is stretched. They buy when others are fearful, using the panic of retail investors as an opportunity to acquire assets at discounted prices. This confluence of retail panic and institutional buying power is what makes the VIX such a strong bottom-finding tool.
In contrast, at market tops, the dynamic is very different. Tops tend not to be marked by panic or fear. Instead, they form quietly as enthusiasm fades, liquidity dries up, and buying interest wanes. Investors are often complacent, assuming prices will continue to rise, while professional money begins distributing their positions. Because there is no surge in fear, volatility remains muted, and the VIX does not offer a clear warning. This is why traders who rely on the VIX or the Williams Vix Fix must understand its limitations: it is exceptional for detecting bottoms but less useful for anticipating tops.
For traders, the lesson is straightforward. When you see the VIX or Williams Vix Fix spiking to extreme levels, it often indicates a high-probability environment for a rebound. These tools should not be used in isolation, but when combined with support levels, sentiment indicators, and market breadth, they can provide some of the most reliable bottom-fishing signals available. While no indicator is perfect, few have stood the test of time as consistently as the VIX—and thanks to Williams’ adaptation, its power can now be applied to nearly every market.
Indicator Signals (Great in risk-off charts):
🔹Flags spike events (tops/bottoms) with both original and filtered (AE/FE) criteria.
🔹Great as a risk overlay: tighten stops into AE/FE, or require “no spike” to enter.
🤯 Volume Comfirmation: VTTI & VPCI (Buff Dormeier) 🤯
Volume Trend Technical Indicator (VTTI)
The Volume Trend Technical Indicator (VTTI) is a momentum-style tool that analyzes how volume trends interact with price movement. Unlike basic volume measures that simply report how many shares or contracts were traded, the VTTI evaluates whether volume is expanding or contracting in the same direction as the prevailing price trend. The underlying logic is that healthy trends are supported by rising volume, while weakening trends often occur on shrinking volume.
At its core, VTTI looks at the rate of change in volume compared to price movements. By smoothing and normalizing these relationships, the indicator helps traders determine whether momentum is accelerating, decelerating, or diverging.
Rising VTTI: Suggests that volume is confirming the current price trend, strengthening the case for continuation. Flips BG Green after crossing it's signal.
Falling VTTI: Indicates that the trend may be losing participation, often a sign of possible consolidation or reversal. Flips BG Red after crossing it's signal.
Traders often use VTTI to filter entries and exits. For example, if price breaks out but VTTI does not rise above zero, the breakout may lack conviction. On the other hand, when both price and VTTI are aligned, probability of continuation improves.
Volume Price Confirmation Indicator (VPCI)
The Volume Price Confirmation Indicator (VPCI), developed by Buff Dormeier, takes the relationship between price and volume a step further. While traditional indicators like On-Balance Volume (OBV) or Chaikin Money Flow look at cumulative patterns, VPCI breaks price and volume into trend and volatility components and then recombines them to measure how well they confirm each other.
In essence, VPCI asks: “Does volume confirm what price is signaling?”
The formula integrates:
Price Trend Component – whether the market is trending upward or downward.
Volume Trend Component – whether trading activity supports that price trend.
Volatility Adjustments – to account for irregular swings.
The resulting oscillator fluctuates around a zero line:
Positive VPCI: Indicates that price and volume trends are in agreement (bullish confirmation).
Negative VPCI: Suggests that price and volume are diverging (bearish warning or false move).
Crossovers of Zero: Can serve as potential buy or sell signals, depending on context.
A key strength of VPCI is its sensitivity to divergence. When prices continue rising but VPCI begins falling, it often foreshadows a weakening rally. Conversely, a rising VPCI during a flat or down market can highlight early accumulation.
VTTI (Entry Signal) vs. VPCI (Exit Signal)
While both indicators study price-volume dynamics, their focus differs:
VTTI is simpler, emphasizing the trend of volume relative to price for momentum confirmation.
VPCI is more advanced, decomposing both price and volume into multiple components to produce a nuanced oscillator.
Used together, they provide complementary insights. VTTI helps quickly spot whether volume is supporting a move, while VPCI offers deeper confirmation and highlights subtle divergences.
Note: The Up/Down Volume Alert works better on the 4 HR, for Daily scalps or 30 minute for HR scalps. Intraday it's 2/10 minute.
🦅 Divergence toolkit 🦅
Divergences in Technical Analysis
Divergence occurs when the price action of an asset moves in one direction while a technical indicator, such as RSI, MACD, or Momentum, moves in the opposite direction. This disagreement between price and indicator often signals a shift in underlying market dynamics. Traders use divergences to anticipate either potential reversals or continuations in trends.
There are two main types of divergences: regular divergences, which typically precede reversals, and hidden divergences, which suggest continuation of the current trend.
Regular Divergence (Reversal Signals)
A regular divergence occurs when price and indicator disagree during a trend extension. These divergences signal that momentum is no longer fully supporting the current trend and that a reversal may be imminent.
🔹Regular Bullish Divergence
Price Action: Forms a lower low.
Indicator: Forms a higher low.
Interpretation: Price is making new lows, but the indicator is gaining strength. This suggests that selling pressure is weakening, and a reversal to the upside may occur.
Example: RSI rising while price dips to fresh lows.
🔹Regular Bearish Divergence
Price Action: Forms a higher high.
Indicator: Forms a lower high.
Interpretation: Price is reaching new highs, but the indicator shows weakening momentum. This implies that buying pressure is fading, warning of a potential downside reversal.
Example: MACD histogram falling while price makes higher highs.
Regular divergences are often spotted near the end of trends and are most powerful when aligned with key support/resistance levels or overbought/oversold conditions.
Hidden Divergence (Continuation Signals)
A hidden divergence occurs during retracements within a trend. Unlike regular divergences, hidden divergences suggest that the prevailing trend still has strength and is likely to continue.
🔹Hidden Bullish Divergence
Price Action: Forms a higher low.
Indicator: Forms a lower low.
Interpretation: Price is retracing within an uptrend, but the indicator is overshooting downward. This shows that momentum remains intact, supporting continuation upward.
🔹Hidden Bearish Divergence
Price Action: Forms a lower high.
Indicator: Forms a higher high.
Interpretation: Price is retracing within a downtrend, while the indicator overshoots upward. This indicates that bearish momentum remains strong, supporting continuation downward.
Hidden divergences often appear during pullbacks, helping traders time entries in the direction of the prevailing trend.
Practical Use of Divergences
🔹Trend Reversal Alerts – Regular divergences are early warnings that a trend may be ending.
🔹Trend Continuation Signals – Hidden divergences help confirm that retracements are simply pauses, not full reversals.
🔹Confluence with Other Tools – Divergences are more reliable when combined with support/resistance, candlestick patterns, or volume analysis.
🔹Multi-Timeframe Analysis – Spotting divergences on higher timeframes often produces stronger signals.
🕭🔔🛎️ Alert 🛎️🔔🕭
🔹Squeeze
🟢 Fired Squeeze
⚫ Low (Wide) Squeeze / 🔴 Normal / 🟡 Tight / 🟣 Very Tight
🔹Momentum
🐂 Bullish Trend Reversal (Crossover of Momentum and Signal from sub −2)
🐻 Bearish Trend Reversal (Crossover of Momentum and Signal from above +2)
📈 Bullish Swing (cross above +1 ATR) / 📉 Bearish Swing (cross below −1 ATR)
🔹DSL
💚 Bullish DSL Scalp / 💔 Bearish DSL Scalp
🔹Volume
🎯 Strong Up Volume (VPCI > 0 and VTTI up)
⏳ Strong Down Volume (VPCI < 0 and VTTI down)
🔹Divergences
🦅 Bullish, 🦆 Bearish, 🦅 Bullish Hidden, 🦆 Bearish Hidden
Management: Search Vanguard ETFs in your browser, look up full list of VOO holdings. Download it, or copy paste all the ticker symbols. Place that with a AI, just ask it to place , in between each ticker. NVDA, TSLA, AVGO, etc. Create a new watchlist, in the + add all tickers separated by commas. Place a watchlist alert ⚠️ only available for premium + subscribers.
Practical playbook
1) Classic Squeeze Break
Setup: 🔴(D)/🟡(2D)/🟣(3D) squeeze → wait for 🟢(1HR) Fired.
Confirm: Momentum > Signal and above +1 ATR (or DMI strong & rising).
Manage: add on pullbacks that hold +1 ATR; scale near +2 ATR or WVF AE/FE.
2) DSL Scalp in Trend
Setup: Clear trend (DMI strong) + DSL bull/bear trigger in the direction of trend.
Filter: avoid tight/very tight yellow/purple unless you want micro-scalps.
Exit: opposite DSL or ATR midline loss.
3) Mean-Reversion Fade
Setup: Momentum extended to ±3 ATR, WVF spike, and a regular divergence.
Entry: Counter signal only when mom crosses back through ±3 ATR toward mid. Exit early if squeeze ⚫/🔴, Momentum may extend to ±3/2 ATR in the same direction.
Risk: reduce size; this is a fade, not trend following.
4) Volume-Confirmed Breakout
Setup: Squeeze → 🟢 Fired + VPCI > 0 and VTTI up → trend continuation.
Manage: trail behind +1 ATR (long) or −1 ATR (short). 9 SMA works good.
Inputs at a glance (key ones)
Mode: Price or CVD momentum; Squeeze Sensitivity (σ); Momentum Length; Signal Length; ATR Smoothing.
🧮 Colors:
SQZMOM: per squeeze regime, momentum, ATR fills.
DSL: On/Off, Fast/Slow, Length.
ATR Zones: Bullish/Bearish levels (±1), ±2/±3 zone lines & fills.
DMI: Lengths, key & weak thresholds, label on/off.
WVF/VIX: Lookbacks, bands, AE/FE toggles, VIX proxy symbol.
VTTI/VPCI: Fast/slow/signal (VTTI), Short/Long (VPCI), and volume source (Tick/CVD/NVI/PVI/OBV/PVT/AccDist/VWAP).
Divergences: Regular/Hidden toggles, Sensitivity %, Lifetime, Live vs On-Close, Lines/Labels.
🔎 Suggested defaults (feel free to tweak)
Calibration: Size Momentum, so that when it's above zero the asset is trending up. For the signal, it can be kept the same or lower.
Intraday (60–240m): σ = 2.0, 18~20, 3~5, DSL Fast, DMI key 23, weak 17.
Daily/Weekly: keep σ = 2.0, consider DSL Slow, DMI key 25, weak 20, widen ATR filters; lean on VPCI/VTTI (4-HR).
CVD mode: use where tick/volume quality is high (index futures, liquid equities, crypto majors).
🪟 Tips & caveats
Swing Screener: Favor liquid underlyings (index futures/ETFs, large caps). Large-Cap, 2 M Vol, Mid-Cap, 500K Vol. Squeeze: BB( 20) upper < KC (20) upper, and BB (20) lower > KC (20) lower. Optional: Price above 9 SMA, 21 SMA, and 50 SMA, they are my SMA of choice. 200 SMA too, unless you are willing to fish in a bear market. Vice-versa for shorts. Optional: ADX 4 HR > 17, or 23 depending on what you are looking for.
Scalp Screener: Same as above, change the D 9 SMA to 5, and the BB/KC from D to 1 HR. Scalps may last 2~3 days.
Position Screener: Change all daily setting to W, aside from Volume. Optional: PEG < 1.5, FCF > 0, ROA > 8% or ROE > 6%.
Good with Moving averages (9/21/50) and low-volume zones.
Position size by IV, ATR, and account risk. Consider stop/hedge rules around ±2/±3 ATR.
Let alerts stage your watchlist; act only on combined squeeze + momentum signals.
Divergences in live mode can repaint (Real-Time); for algo or alerts, use on-close.
Tight/Very tight squeezes are great for scalps but choppy; combine with DMI rising + VPCI>0.
±3 ATR is exhaustion context, not an auto-fade—look for WVF/Div/DSL confirmation.
For alerts, pair “Fired Squeeze + Bullish Swing” (or bearish) to avoid false starts.
🎯 How to Trade Entry ~ Recap:
Tight/very tight squeeze → fires → momentum crosses up (or DSL bull).
Exit/Flip: Momentum crosses down into/after expansion or hits +2/+3 ATR with fade signs. Filter: Avoid fresh longs at +3 ATR; avoid fresh shorts at −3 ATR unless fading with confirmation.
📐 Options Integrations
✅ Risk Reversal/Modified Risk Reversal (Bullish: Short Put + Long Call)
Use when: Squeeze fires up from 🟡/🟣 and momentum crosses above signal (or zero/DSL).
Playbook Entry: On or just after the bullish fire and momentum upcross. DMI or Volume supports trend as well.
Structure: Sell a put at/just below the −2 ATR reference (or recent swing support). Buy a call at/above the breakout zone (prior high/mid-range +1 to +2 ATR).
A classic risk reversal is a long call plus a short put. That’s a very bullish structure—you gain if the price rallies (via the call), and you collect a premium by selling a put. But it has a naked downside risk. The modified risk reversal fixes that by adding a long lower put (making the short put into a defined put credit spread).
Management: If momentum stays above signal, ride toward +2 → +3 ATR. Sell the put near the current price → receive big premium. Buy the lower put → spend part of that premium (risk cap). Buy the call above the current price → spend more, but the short put premium mostly pays for it.
Exits/Adjust: Momentum downcross or squeeze flips back on (new compression) → reduce. If price retests −1/−2 ATR and holds, you can roll the short put down/out.
Breakout = Big Success; No Breakout = you keep the initial credit. Reversal = Max loss is capped by the long lower put.
✅ Iron Condor (Neutral: Short OTM Put Spread + Short OTM Call Spread)
Use when: Squeeze is active (🟡/🟣), momentum is flat near zero, and there is no directional edge. 🟢 lasts for around 5~8 bars typically. I measure the historical duration of it, and wait for a range period to occur.
Playbook Entry: During compression, set wings outside ±2 ATR (or recent range extremes). I prefer identifying boxes where the rectangle pattern occurs on the chart.
Management: Time decay works while price remains trapped in the coil. High-winrate ~80%, but 1 loser can wipe most of the gains.
Exits/Adjust: If a squeeze fires and momentum breaks hard one way, close the losing side, consider converting to a vertical or rotating to a directional spread aligned with momentum.
4HR-Bullish, closing one wing:
Tip: Align daily/weekly context with your intraday entries. 9 > 50 on Weekly, similar on Daily. Sell premium into compression; switch to directional spreads on expansion and momentum confirmation.
✅ Naked Call/Puts (Directional: 10~30 Delta Calls)
Stick to naked calls and puts when the squeezes are fired from either 🔴 or ⚫.
Look for Strikes slightly out of the money with an OI and Volume spread less than <10%.
If Strike Date is >45, manage 21 Days before expiration. Scalp: Expiration Strikes of 1/4 of the Squeeze period. Leap: Expiration Strikes of 1.75x of the Squeeze period.
📐 Futures Integrations
Playbook Entry:
Verify if the squeeze on the hourly is red or green, and enter on the 2- or 5-minute during a similar squeeze state.
Trend-Following: Traditional 2 Renko Block above 21 SMA and Momentum is bullish, or vice versa. (2~ES, 5~NQ)
Structure: Go long at/just below the ATR reference (or recent swing support). Exit below the breakout zone (prior high/mid-range +1 to +2 ATR).
Management: If momentum stays above +1 ATR ride toward +2 → +3 ATR, etc. House-money, should be kept.
Exits/Adjust: Momentum downcross or squeeze flips back on (new compression) → exit. On Renko Charts, lower the sensitivity to 0.7~1. If price retests 0/−1/−2 ATR and holds, you can enter when the 9 SMA flips. The 50 SMA is better for Daily and up; I wouldn't trade against it then.
📌 FOMO Trading Playbook
Credits & License
Credits: @JF10R (Multi-Timeframe Squeeze), @BigBeluga (DSL), @OskarGallard (Colored DMI base), @ChrisMoody (WVF ideas), @PineCodersTASC (VTTI/VPCI), @EliCobra (Divergence toolkit).
License: Mozilla Public License 2.0 (MPL-2.0).
Author: © GabrielAmadeusLau

Ants Pro - MVP Leaders [LevelUp]Ants Pro identifies exceptionally strong momentum, volume, and price action (MVP) — often one of the earliest signs of institutional accumulation. It offers extensive customization, powerful historical analysis tools, and advanced screening features to give traders a meaningful edge.
Ants Pro was developed in collaboration with David Ryan, three-time winner of the U.S. Investing Championship. David worked with William O’Neil and managed the New USA Growth Fund at William O’Neil + Company, where the Ants idea originated.
Ants Pro helps answer an important question posed by David:
“What separates a stock that makes a 15–20% move from one that rises 15–20%, builds a base, and then continues significantly higher?”
Through his research, David found that many of the market’s biggest winners showed consistent buying over 12 to 15 days, on high volume — a sign of steady institutional accumulation that often unfolds over days or weeks as institutions establish large positions in a stock.
In addition to spotting early accumulation, Ants Pro can flag signs of topping patterns, alerting traders to possible shifts in market sentiment and helping them navigate momentum changes effectively.
🔹—— Key Features ——🔹
▪ Automated detection and highlighting of Ants.
▪ Extensive customization options to match your trading style.
▪ Hover over Ants for detailed stats.
▪ Optional table showing progress towards a new Ant.
▪ Pine Screener support to find new and historical Ants.
▪ Create symbol or watchlist alerts to get real-time notifications of new Ants.
🔹—— Ants Pro Overview ——🔹
The original Ants indicator was published on TradingView in 2021, before Ant integration became available in MarketSurge — a premium charting platform developed by Investor’s Business Daily, the company founded by William O’Neil. Ants Pro is a complete rewrite designed to deliver a similar visual experience while adding extensive customization options, real-time and historical Ant statistics, unique alert features, and support for the Pine Screener to enable comprehensive stock screening.
🔹—— Ants ▪ Momentum, Volume & Price (MVP) ——🔹
The default criteria for a new Ant are based on the daily timeframe and are as follows:
▪ Momentum: Stock closed higher at least 12 of the past 15 days.
▪ Volume: Volume 20%+ above its 50-day average over the past 15 days.
▪ Price: Price up 20%+ over the past 15 days.
You can adjust these parameters based on your trading style and preferences. See the Settings section below for more details.
If you’re wondering about the name “Ants,” it comes from the original implementation, where small black marks were plotted above price bars whenever the MVP criteria were met, resembling ants on the chart.
🔹—— Ants As MVP Leaders ——🔹
Ants highlight significant strength in price and volume, yet they aren’t a buy signal on their own. With the default criteria, a stock that’s up 12 of the past 15 days with price and volume running 20%+ above average is showing exceptional momentum — yet it's important to avoid chasing price.
Instead, add stocks showing Ants to a watchlist and wait for a pullback to an area of support, such as a moving average or a prior price zone where support was evident. Another strong setup is sideways consolidation followed by a decisive breakout above the consolidation high.
CELH
FTAI
IREN
🔹—— Ants As Topping Signal ——🔹
The Ants indicator can be helpful for spotting topping formations. When you compare the definition of a climax top with Ants, they have similar price and volume characteristics.
Climax Top
▪ Stock in a strong, extended uptrend, followed by a 20%+ surge in price over 2 to 3 weeks.
▪ Multiple high-volume up days and/or a large gap up near the absolute peak.
▪ Highest price of move occurs, followed immediately by a reversal.
Because the default Ant settings are essentially looking for the same combination of extreme price acceleration and volume surge, the indicator will often show Ants at or just before a topping pattern. That visual cue begs the question, is this the final blow-off, or just another leg higher?
Context is everything. Paying close attention to where the stock has already been — how extended it is from your preferred moving averages, a prior base, or institutional support levels — is what separates a high-probability profit-taking opportunity from an early exit on a still trending leader.
The distance from the 50-day SMA helps show how far price has stretched above its intermediate trend; when a stock extends too far above this level, it often reflects unsustainable strength and a higher risk of a pullback.
The Average True Range (ATR) multiple helps quantify how far price has moved relative to its average volatility, giving a normalized read on how stretched a stock is. The ATR multiple is simply the distance between price and the 50-SMA expressed in ATR units. For example, an ATR multiple of 5 means price is five times its ATR above the 50-SMA. Ants Pro uses a 20-day ATR.
OKLO
APLD
🔹—— Stats Table ▪ Progress Towards New Ant ——🔹
There is an optional table that highlights every requirement and how current price and volume are tracking toward qualifying as a new Ant. When conditions are close, a shallow pullback or consolidation may offer a possible early entry.
TSLA
🔹—— Hover Over Ants For Stats ——🔹
As shown above in the charts of OKLO and APLD, you can hover your cursor over any Ant to get detailed price and volume stats.
▪ Close Up: number of bars up versus the requirement.
▪ Volume % Change: % change versus the requirement.
▪ Price % Change: % change versus the requirement.
▪ From 50-SMA: how far is the price from the 50-SMA.
▪ ATR Multiple: how many ATR multiples is the price from the 50-SMA.
Note: To hover over an Ant, the Ants Pro indicator needs to be shown on top of all other indicators. Follow the steps in the chart below to bring Ants Pro to the front.
🔹—— Context-Sensitive Help ——🔹
All help tooltips are context-aware and update based on your Settings. If you adjust the Ant requirements, for example, changing the default 12 of 15 days to 7 of 10 days, the Ants popup and table values will automatically reflect those changes.
🔹—— Configuring Alerts ——🔹
New Ant Alert
Using the TradingView alert dialog, choose the option for "New Ant" to be notified when price and volume meet the requirements for a new Ant.
Watchlist Alerts
To be notified when there is a new Ant across a range symbols, you can use a watchlist alert as outlined below.
Historical Ants Alert
In the Condition drop-down menu of the alert dialog, there is an option for Historical Ants . This setting is intended for use with the Pine Screener. If you select this for an alert on a stock, an alert will be generated if there are one or more Ants going back in time based on the Historical Bars To Search value in Settings. For example, if Historical Bars To Search is set to 50, and there is an Ant on the chart within the past 50 bars, an alert will be triggered.
🔹—— Stock Screening ——🔹
Ants Pro works with the Pine Screener, eliminating the need for a separate screening indicator.
Screening For New Ants
To search for new Ants on the most recent bar:
The new Ant might appear only on the last bar, or it could be part of a longer series of Ants.
Screening For Historical Ants
When searching historical bars, you can configure how far back to search:
Screening And Custom Ant Requirements
You can change any of the default price and volume requirements. For example, instead of 12 of 15 days up and 20%+ gains, your preference may be 8 of 10 days up and 10%+ gains.
🔹—— Settings ——🔹
Ant Requirements
You can customize the default price and volume requirements to align with your preferences.
Table Of Ant Stats
The table showing status towards the progress of a new Ant has several configurable options:
▪ Current Progress: shows the stats of price and volume.
▪ Always On: table will always be visible, even if there is an Ant on the last bar.
Historical Bars To Search
This option is only applicable when using the Pine Screener. By default, searching historical bars will look back approximately one year (250 daily bars). However, you might prefer to screen over a shorter period of time. For example, change the value to 50 to look for Ants that occurred over the past 50 bars.
🔹—— Studying Past Winners & Reviewing Trades ——🔹
TradingView’s Bar Replay is an incredibly useful feature that lets you step through any historical chart bar by bar, simulating real-time price movement as it unfolded. You can revisit past big winners, review your own trades, test whether a pattern would have influenced your decisions at the time, and use those insights to refine your price and volume analysis.
AXON
🔹—— Best Practices ——🔹
In technical analysis, it’s essential to understand where price is coming from. Never evaluate a pattern in isolation — always zoom out and study the broader context of price and volume.
The same applies to Ants. Remember, Ants are not a buy signal. When they appear, zoom out on the chart and assess where price is in relation to moving averages and prior areas of support or resistance. Review higher timeframes to see the bigger picture.
▪ Build a watchlist as new Ants appear. Review the watchlist regularly for potential trades.
▪ Relative strength is essential. Look for the RS Line to be trending up.
▪ Look for earnings and sales acceleration as confirmation of strength.
▪ Always define risk before entering a trade — know where you’ll exit.
▪ Size positions based on volatility and conviction, not emotion.
▪ Be patient — trends take time to develop.
🔹—— Acknowledgements ——🔹
A sincere thank you to David Ryan for sharing his expertise on Ant requirements and for offering insightful suggestions to improve the Ants Pro indicator.
สคริปต์แบบชำระเงิน

Trading Module [BackQuant]Trading Module
A modular overlay that lets you combine three core components, a Trend Model, an Impulse Model, and an optional Stop Loss framework, then layer in a multi-symbol RSI screener plus a full price action toolkit (market structure, FVGs, order blocks, volumetric S/R). Built for discretionary execution and study, not for blind automation.
────────────────────────────────────────────────────────────
What this script is
This indicator is designed like a “module picker”. Instead of forcing one opinionated system, it gives you selectable models that can be combined into a workflow:
1) Trend Model , answers “what side is the market biased to?”
2) Impulse Model , answers “is there currently expansion, pressure, or a momentum event worth paying attention to?”
3) Stop Loss Layer , answers “where are reasonable invalidation zones if I’m managing risk manually?”
4) RSI Screener , answers “what are my watchlist assets doing right now, on multiple timeframes, in one place?”
5) Price Action Concepts , answers “what structure levels, imbalances, institutional zones, and volume-based levels matter?”
You can run it as a lightweight overlay (trend + impulse only), or turn on the heavier price action stack when you want deeper context.
────────────────────────────────────────────────────────────
How to use it, the intended workflow
Step 1, pick your Trend Model
The trend model is your baseline directional filter. It is meant to reduce “random trading” by keeping you aligned with the dominant structure or momentum bias.
Trend Models (examples)
Typical usage:
- If the trend model reads bullish, you focus on long setups and avoid shorting into strength.
- If the trend model reads bearish, you focus on short setups and avoid catching bottoms.
- If the trend model is neutral or mixed, you reduce size or wait for confirmation.
What you can expect from the options (without exposing internal weighting or thresholds):
- Universal Trend+ , a composite trend regime model that blends multiple families of trend evidence. It is designed to be more robust than a single indicator and reduce “one-indicator failure modes”.
- EMA Cross , a classic fast vs slow trend bias. Simple, responsive, but can whipsaw in ranges.
- DEMA ATR , a smoother trend anchor that adapts to volatility. Often cleaner in chop than basic crosses.
- Relative Strength Overlay , a strength scoring style bias built from an RSI-style internal scoring process. Useful when you want “strength state” more than “moving average state”.
Color conventions:
- Long color and short color are user-defined, so you can keep consistent visuals across your BackQuant suite.
Step 2, pick your Impulse Model
Impulse is separate from trend on purpose. Trend answers direction, impulse answers timing. A market can be trending but not currently impulsing, or impulsing in a counter-trend squeeze.
Impulse Models (examples)
How to use impulse signals:
- Treat impulse as “permission” to engage, not as a standalone trade trigger.
- Best pairing is trend aligned impulse, meaning bullish trend model plus bullish impulse, bearish plus bearish.
- Counter-trend impulses can be used as warning signals, take-profit cues, or short-lived mean reversion opportunities, depending on your style.
The impulse options in this module are built around pressure and expansion detection. They are meant to identify moments where conditions shift from “noise” to “initiative activity”.
Step 3, choose a Stop Loss framework
This script includes optional stop visualization modes. These are not meant to be blindly used as a “one true stop”, they are tools for structuring invalidation around volatility or defined percentage bands.
Stop Loss (examples)
Stop loss options:
- None , no overlay.
- Dynamic , a volatility-aware band. Useful when you want stops to widen in high vol and tighten in low vol.
- Fixed , preset percentage bands. Useful for quick structure around risk units, scaling, or rule-based journaling.
- Bar-to-Bar , a micro-structure invalidation reference that uses the prior bar as a risk anchor. Useful for very tight management and fast invalidation.
How to apply them properly:
- Stops should be placed where the trade idea is wrong, not where you “feel pain”.
- A volatility stop is usually an environment stop, while a fixed stop is usually a plan stop.
- If you use impulses for entries, your stop should account for impulse volatility, otherwise you get stopped on the exact move you’re trying to capture.
────────────────────────────────────────────────────────────
RSI Screener module
This module is built for scanning multiple symbols and timeframes from one chart, without switching tabs.
RSI Screener (example)
What it does:
- Lets you define up to 10 symbols (defaults to major crypto pairs).
- Each slot can have its own timeframe.
- Computes an RSI value per symbol and assigns a directional state relative to a midline threshold.
- Displays a stacked overlay readout using a monospace label style for quick scanning.
How to use it:
- Set slots 1–5 as your majors, 6–10 as your rotation candidates.
- Use higher timeframes for regime, lower timeframes for timing.
- Use the midline threshold as a “trend bias” line, not an overbought or oversold line.
- Treat the screener as context, not a signal. Your chart model and price action still decide the trade.
Performance note:
- Screeners are heavy by nature because each symbol is a security() request. Keep the number of enabled slots reasonable if you are on lower-end hardware or running many scripts.
────────────────────────────────────────────────────────────
Price Action Concepts and Market Structure stack
This script includes a full price action toolkit intended to provide “where” context, levels, zones, and structural breaks, so the trend and impulse models are not operating in a vacuum.
Price Action Concepts / Market Structure (example)
This section is split into five major blocks:
1) Market Structure, Swing and Internal
You can enable swing structure and internal structure separately, with independent lookbacks.
- Swing structure tracks larger, slower pivots, better for macro trend structure.
- Internal structure tracks tighter pivots, better for entry timing and micro shifts.
It prints structure events as:
- BOS (Break of Structure), continuation-style break.
- MSB (Market Structure Break), shift-style break. Some traders call this CHoCH, here it’s presented as an MSB concept.
Usage:
- Swing BOS is good for confirming a larger regime.
- Internal structure is good for timing entries within the swing context.
- If internal flips but swing does not, treat it as a warning, not necessarily a full reversal.
2) Fair Value Gaps (FVG)
Optional imbalance boxes that highlight displacement zones.
Key controls:
- Timeframe selection (or current timeframe).
- How many to keep on chart.
- How far to extend them right.
Usage:
- FVGs are best treated as “areas of interest”, not guaranteed support/resistance.
- They help you frame where price might rebalance after an impulse event.
3) Order Blocks (OB)
Optional institutional-style zones detected from structure and candle logic, with filters.
Key controls:
- Fractal type (3 or 5) changes how “strict” structure detection is.
- Break method (close vs high/low) changes confirmation strictness.
- Optional filter with FVG distance to reduce low-quality blocks.
- Extend, delete-when-filled, and label options for chart hygiene.
Usage:
- OBs are strongest when aligned with swing context and confirmed by volume or displacement.
- Filled blocks are informational, they can be removed to reduce clutter.
4) Volumetric Support and Resistance
This module creates support and resistance “zones” based on high-volume pivot events, then manages them over time.
Key controls:
- Detection sensitivity, volume multiplier, and lookback period.
- Minimum distance between zones to avoid stacking duplicates.
- Remove broken, extend, and volume display toggles.
How to interpret:
- Levels are thicker zones, not single price lines.
- “Touches” are tracked as an interaction count, useful for identifying repeatedly defended or attacked zones.
- High-volume zones are visually emphasized, these tend to matter more than low volume pivots.
Usage:
- Pair volumetric levels with impulse signals, an impulse into a high-volume resistance zone is not the same as an impulse in open space.
- Use volumetric levels as structure anchors for invalidation and targets.
5) Alerts
The price action stack includes alerts for new levels, touches, breaks, and order block creation or interaction.
Use alerts for:
- Watchlist management, you get notified when price hits an area.
- Avoiding screen-watching, especially when you run multi-timeframe setups.
────────────────────────────────────────────────────────────
Core philosophy of the module
This indicator is not “one model to rule them all”. It is meant to let you build a trading process:
- Trend decides bias.
- Impulse decides engagement timing.
- Price action decides location and structure.
- Stops decide risk containment.
- Screener decides where to look.
If you only use one layer, you are throwing away most of the edge this style of framework is designed to create. The strength is in confluence and filtering.
────────────────────────────────────────────────────────────
Suggested presets
Preset A, clean trend-following overlay
- Trend Model, Universal Trend+ or DEMA ATR
- Impulse Model, either option
- Stop Loss, Dynamic
- Price action modules off (structure off, FVG off, OB off, volumetric off)
- Screener on (high timeframe)
Preset B, execution and structure mode
- Trend Model on
- Impulse Model on
- Market Structure on (swing + internal)
- FVG on (current timeframe or one higher)
- Order Blocks on with FVG filter
- Volumetric S/R on
- Stop Loss, Dynamic or Bar-to-Bar depending on speed
Preset C, watchlist scanner mode
- Screener on
- Minimal chart overlays on
- Use alerts for touches and breaks
- Only open charts that show alignment across trend and impulse
────────────────────────────────────────────────────────────
Notes and limitations
- This is a heavy script when multiple modules are enabled, because it draws objects and can request multiple symbols.
- The models are designed to be modular, so not every combination will be optimal for every market or timeframe.
────────────────────────────────────────────────────────────
Quick input map
Main Settings/Models
- Select Trend Model
- Select Impulse Model
- Select Stop Loss
- Show Screener
- Long/Short colors
Screener Settings
- Label size and offsets
- RSI length and midline
- Up to 10 symbol slots with per-slot timeframe and enable toggle
Market Structure
- Swing and internal structure mode and lookbacks
- Bull and bear colors
Fair Value Gaps
- Enable, count, timeframe, extend, colors
Order Blocks
- Enable, labels, fractal type, break method
- FVG filter and distance
- Lookback, extend, delete-when-filled, colors
Volumetric S/R
- Sensitivity, volume multiplier, analysis window
- Level limits, distance rules, extension and cleanup rules
- Volume display preferences
────────────────────────────────────────────────────────────
End note
This is intended as a full visual decision-support module for discretionary traders who want trend, timing, structure, and watchlist scanning in one place. Use it to build a repeatable process, then validate that process with proper testing and journaling before risking real capital.

AQPRO Pattern Map
📝 INTRODUCTION
AQPRO Pattern Map is a comprehensive trading tool designed to automate the detection of 27 most popular candlestick patterns across any financial asset, making it a powerful tool for traders who use strategies, which are based on candlestick patterns.
This indicator not only identifies candlestick patterns but also incorporates multi-timeframe (MTF) analysis , risk management tools like Take-Profit (TP) and Stop-Loss (SL) , and labeled visual cues for effortless chart reading. Below is the complete list of patterns it supports:
📜 Patterns scanned by the indicator:
One-candle patterns:
Hammer;
Shooting Star;
Marubozu (Bullish/Bearish);
Doji.
Two-candle patterns:
Belt Hold (Bullish/Bearish);
Engulfing (Bullish/Bearish);
Harami (Bullish/Bearish);
Harami Cross (Bullish/Bearish);
Kicker (Bullish/Bearish);
Window (Rising/Falling Gap);
Piercing Line / Dark Cloud Cover.
Three-candle patterns:
Outside Up / Down Bar;
Inside Up / Down Bar;
Morning Star / Evening Star;
Three White Soldiers / Three Black Crows;
Advance Block / Descent Block;
Tasuki Gap (Upside/Downside);
Side-by-Side White Lines.
Multi-candle patterns:
Rising One / Falling One;
Rising Two / Falling Two;
Rising Three / Falling Three;
Rising Four / Falling Four;
Rising Five / Falling Five;
Breakaway Two / Three / Four / Five (Bullish/Bearish);
Fakey (Bullish/Bearish).
With this tool, traders can visually and systematically track key candlestick setups across multiple timeframes simultaneously, making it an all-in-one solution for identifying actionable patterns.
🎯 PURPOSE OF USAGE
The primary goal of the "AQPRO Pattern Map" is to equip traders with a highly efficient way of identifying significant candlestick patterns across different timeframes, making the decision-making process stronger in a sense of both quality and quantity of presented information.
Specifically, this indicator addresses the following needs:
Automation of pattern detection.
Nobody likes searching for patterns on the chart "by hand", because it takes too much time and mental energy. With this screener you can forget about this problem: automatic scanning for 27 of the most commonly used patterns will save your tens, if not hundreds of hours of time, so you can focus on what really matters;
Multi-timeframe (MTF) analysis.
This one is one of the most unique features of this indicator, because after conducting product research in library of open-source scripts alike this screener, almost none of reviewed indicators had MTF analysis feature embedded in them. This feature is important for the simplest of reasons: you see candlestick data from other timeframes without jumping from one timeframe to another . Needless to say how much time it will save for traders over the years of trading. See description below to learn more on exact functionality of our MTF analysis;
Risk management automation.
Humans tend to overestimate risk, when matters are about earning money from "financially-dangerous" activities and trading is no exception. To help traders better understand what they risk, we implemented a simple, yet effective way of displaying levels of risk for each pattern. For each new pattern on the chart you will be able see automatic creation of Take-Profit (TP) and Stop-Loss (SL) levels. It involves creation and displaying of lines and labels, representing each level at its exact coordinates. This elevates visual perception of risk for fellow traders and avoid excessive risk in many cases;
Simplicity in data visualization.
Charts, which are cluttered with pointless visual noise, presented as 'additional confirmation analysis', don't foster insights and are not worth a dime . We understand this issue very well and we designed our indicator with the solution to this problem in mind. Every bit of information, that you will see on your chart, will make sense both technically and visually — no more wasting time cleaning mess on your charts.
By addressing the needs, described above, this indicator will be a useful tool for any trader, who employs principles of candlestick pattern analysis, because most important pains of this kind of analysis are efficiently handled by our indicator.
⚙️ SETTINGS OVERVIEW
Customization options of our indicator are quite extensive, because flexibility in such indicator is in the top of most important qualities. Let's review each group of settings deeper:
📊 Patterns: One-Candle
This group allows you to enable or disable specific onep -candle candlestick patterns.
Toggle on/off switch for Hammer, Shooting Star, Marubozu, and Doji .
📊 Patterns: Two-Candle
This group allows you to enable or disable specific two -candle candlestick patterns.
Toggle on/off switch for Belt Hold, Engulfing, Harami & Harami Cross, Kicker, Window, Piercing Line & Dark Cloud Cover .
📊 Patterns: Three-Candle
This group allows you to enable or disable specific three -candle candlestick patterns.
Toggle on/off switch for Morning Star & Evening Star, Three White Soldiers, Three Black Crows, Advance Block & Descent Block, Tasuki Gap, Side-by-Side Gap (Bullish), Squeeze .
📊 Patterns: Multi-Candle
This group allows you to enable or disable specific multi -candle (3 or more candle) candlestick patterns.
Toggle on/off switch for Rising/Falling sequences, Breakaway patterns, and Fakey .
📊 MTF Settings
These settings allow you to use the Multi-Timeframe Screener to display patterns from additional timeframes.
"Use MTF Screener" — toggles the addition of MTF Screener to main dashboard ( described in 'Visual Settings' ). If enabled, adds section of MTF Screener below main dashboard
* List of four timeframes — your personal list to choose your timeframe, which will be used to get data about latest patterns. Default list of timeframes includes timeframes like 15min, 30min 1hr, 4hr .
* The detected patterns from these timeframes will be displayed in the MTF Dashboard on the chart.
🛡️ Risk Settings
As was described above, risk settings in our indicator will control appearance of TP and SL labels and lines, which appear for each new trade. Here you can customize the most essential parameters.
"Show TP/SL" — toggles the visibility of Take-Profit (TP) and Stop-Loss (SL) values for the most recent pattern.
"Risk-to-Reward Ratio (R:R)" — defines your desired risk/reward ratio for the TP and SL calculations. The more this parameter is, the further the TP from entry level will be.
🎨 Visual Settings
In this group of settings you can fine-tune the visual appearance of the indicator to fit your preferences.
IMPORTANT: colour parameters from this group of settings affect ONLY colours in the dashboard.
"Use info dashboard" — if enabled, shows dashboard in the top right corner of the chart, which displays latest pattern's TP and SL alongside with this pattern's trade status: '⏳' - TP or SL have not been reached yet, '✋' - TP or SL have already been reached already, refrain from taking the trade.
"Bullish Pattern" — defines the color for bullish patterns.
"Bearish Pattern" — defines the color for bearish patterns.
"Neutral Pattern" — specify the color for neutral patterns like Doji.
"Frame Width" — adjusts the thickness of frames highlighting detected patterns on the chart.
📈 APPLICATION GUIDE
The way of application of this indicator is pretty straightforward, because trading methodologies based on candlestick patterns were developed decades ago and haven't changed much since then. However, we find it necessary to explain the most essential ways of application in this section.
Let's start with the basics — how you will your chart look when you load the indicator for the first time:
By default we have 5 main visual data "blocks":
Bullish patterns;
Bearish patterns;
Risk visualization;
Main Dashboard;
MTF Screener.
Let's review each of these groups one by one.
BULLISH & BEARISH PATTERNS
Patterns are displayed as up/down labels, which are styled in corresponding to trend colours. Each patterns has its own unique emoji to help traders easily navigate between patterns.
Also by default each pattern has its custom frame, inside of which resides candle (or multiple candles) of the pattern iself. These frames are made with purpose to show each pattern in a very clear way on the chart, because huge number of public scripts usually only show simple label of such patterns and don't highlight the pattern itself on the chart. To remove frames you can set "Frame Width" parameter to 0 in 'Visual Settings' group in the settings.
You can see the examples of frame on the screenshot below:
RISK VISUALIZATION (TP & SL)
Displaying Take-Profits and Stop-Losses in our indicator on the chart works quite simple: for each new trade indicator creates new pairs of lines and labels for TP and SL, while lines & labels from previous trade are erased for aesthetics purposes. Each label shows price coordinates, so that each trader would be able to grap the numbers in seconds.
See the visual showcase of TP & SL visualization on the screenshot below:
Also, whenever TP or SL of the current trade is reached, drawing of both TP and SL stops . When the TP is reached, additional '✅' emoji on the TP price is shown as confirmation of Take-Profit.
However, while TP or SL has not been reached, TP&SL labels and lines will be prolonged until one of them will be reached or new signals will come.
See the visual showcase of TP & SL stopping being visualized & TP on the screenshot below:
MAIN DASHBOARD
Main dashboard is displayed in the top right corner of the chart and it shows the data of latest pattern, that occurred on the current asset and current timeframe: pattern's name, TP, SL and trade status. Depending on bullishness or bearishness of the pattern, dashboard is colour in respective colour.
Also on the right of side TP and SL data block there is a so called trade status. It is basically an indication of wether or not latest pattern's trade is still active or not:
If TP or SL of the pattern have not been reached yet, trade is considered active and is marked with '⏳' emoji;
If TP or SL of the pattern have already been reached, trade is considered inactive and is marked with '✋' emoji.
See the visual showcase of dashboard on the screenshot below:
MTF Screener
MTF Screener is displayed right below the main dashboard and its has distinctive 'MTF Patterns' header row on the top, painted in gray colour to make sure that every traders understand he is looking at.
This screener shows the timeframe and name of patterns from four other timeframes, which trader can customize in the settings to his liking. This will help trader get more insights on global sentiment of other timeframes, which improves trading results overall if applied correctly.
In the future MTF Screener will be expanded to have more data in it, like TP and SL, age of pattern and etc.
See the visual showcase of the MTF Screener on the screenshot below:
Features, explained above, make this indicator quite versatile and suitable for incorporation in any trading strategy, which uses candlestick patterns. They are simple, yet insightful, and traders, which use similar strategies everyday, will truly appreciate the benefits of this indicator when they will set up this indicator for the first time on their chart.
🔔 ALERTS
This indicator employs alerts for an event when new pattern occurs. While creating the alert below 'Condition' field choose 'any alert() function call' .
When this alert is triggered, it will generate this kind of message:
string msg_template = "EXCHANGE:ASSET, TIMEFRAME: BULLISH_OR_BEARISH pattern PATTERN_NAME was found."
string msg_example = "BINANCE:BTCUSDT, 15m: bullish pattern 'Hammer' was found."
📌 NOTES
This indicator is most effective when used in combination with other technical analysis tools such as trendlines, moving averages, support/resistance levels or any other indicator-type tool. We strongly recommend using this indicator as confirmation indicator for your main trading strategy, not as primary source of signals;
If you want to trade directly by these patterns, make sure to use proper risk management techniques of your own and use TP&SL visualization on the chart to always have a clue about your current position;
If you lost track of visual components on the chart, look at the main dashboard to see text summary of data from latest pattern. Also don't forget to look at MTF Screener to have more context about MTF sentiment, because it is increases your understandings of MTF price trend and improves your decision-making process.
🏁 AFTERWORD
AQPRO Pattern Map was built to help traders automate candlestick pattern searching routine, improve chart readability and enhance perception of current potential risks, which may come from trading from a specific pattern. Indicator's main dashboard and MTF screener eliminate the need for constantly checking other timeframe for global sentiment, helping traders save even more time and fostering improved decision making.
This indicator will work in great conjunction with any other trading strategy as confirmation tool for entry decision. Using this indicator as primary source of signals is not recommended due to unstable nature of trading patterns.
ℹ️ If you have questions about this or any other our indicator, please leave it in the comments.

Intelligent Currency Breakout ChannelIndicator: Intelligent Currency Breakout Channel
This document provides a detailed explanation of the "Intelligent Currency Breakout Channel" indicator for TradingView.
1. Overview
The Intelligent Currency Breakout Channel is an advanced technical analysis tool designed to identify periods of price consolidation and signal potential breakouts. It automatically draws channels around ranging price action and utilizes sophisticated volume analysis to provide deeper insights into market sentiment. The indicator also includes a built-in logarithmic regression screener to help traders align their breakout signals with the broader market trend.
2. Key Features
Automatic Channel Detection: The indicator identifies periods of low volatility and automatically draws a containing channel (box) around the price action.
Breakout Signals: It generates clear visual alerts (▲ for bullish, ▼ for bearish) when the price closes decisively outside of a channel.
In-Depth Volume Analysis: Within each channel, the indicator plots volume as candlestick-like bars, offering three distinct modes: Total Volume, Buy/Sell Comparison, and Volume Delta. This helps traders gauge the strength and conviction behind price movements.
Real-time Sentiment Gauge: When a channel is active, a dynamic color-graded gauge appears on the right side of the chart. It visualizes the current volume delta momentum relative to its recent range, offering an at-a-glance sentiment reading.
Integrated Trend Screener: A secondary analysis tool based on logarithmic regression is included to determine the underlying trend direction (Up, Down, or Neutral), which can be used to filter breakout signals.
Fully Customizable: Users can extensively customize all parameters, from calculation lengths and breakout sensitivity to the visual appearance of every component.
3. How to Use
Channel Formation: Watch for the indicator to draw a new channel. This signifies that the market is in a consolidation or ranging phase. The formation of a channel itself can be an alertable event.
Volume Interpretation: Observe the volume bars inside the channel. An increase in volume as the price approaches the channel's upper or lower boundary can foreshadow a potential breakout. Use the Volume Display Mode to analyze if buying pressure (Comparison, Delta) or selling pressure is building.
Breakout Confirmation: A bullish breakout signal (▲) appears when the price closes above the channel's upper boundary. A bearish breakout signal (▼) appears when the price closes below the lower boundary. For higher-quality signals, enable the Strong Closes Only option.
Trend Confirmation (Screener): Use the screener's plot and background color to confirm the broader trend. For instance, you might choose to only take bullish breakout signals when the screener indicates an uptrend (green background) and bearish signals when it indicates a downtrend (red background).
Sentiment Gauge: The pointer on the gauge indicates current momentum. A pointer in the upper (green) section suggests bullish pressure, while a pointer in the lower (red) section suggests bearish pressure. This can provide additional confluence for a trade decision.
4. Settings and Inputs
Main Settings
Overlap Channels: If enabled, allows multiple channels to be drawn on the chart simultaneously, even if they overlap. When disabled, a new channel will only form if it doesn't intersect with an existing one.
Strong Closes Only: If enabled, a breakout is only triggered if the midpoint of the candle's body (average of open and close) is outside the channel. This helps filter out false signals caused by long wicks. If disabled, any close outside the channel triggers a breakout.
Normalization Length: The lookback period (in bars) used for price normalization. A higher value creates a more stable normalization but may be slower to react to recent price changes.
Box Detection Length: The lookback period used to detect the channel formation pattern. A lower value will result in more frequent channels but may be more sensitive to noise. A higher value will result in fewer, but potentially more significant, channels.
Volume Analysis
Show Volume Analysis: Toggles the visibility of the candlestick-like volume bars inside the channel.
Volume Display Mode:
Volume: Displays total volume as symmetrical bars around the channel's midline.
Comparison: Shows buying volume (green) above the midline and selling volume (red) below it.
Delta: Shows the net difference between buying and selling volume. Positive delta is shown above the midline, and negative delta is shown below.
Volume Delta Timeframe Source: The timeframe from which to source volume data for calculations. Using a lower timeframe can provide a more granular view of volume dynamics.
Volume Scaling: A multiplier that adjusts the vertical size of the volume bars relative to the channel's height.
Appearance
Volume Text Size: Sets the size of the volume data text displayed in the corners of the channel. Options: Tiny, Small, Medium, Large.
Bullish Color: The primary color for all bullish visual elements, including breakout signals and positive volume bars.
Bearish Color: The primary color for all bearish visual elements, including breakout signals and negative volume bars.
Screener Settings
Lookback Period: The number of bars used for the logarithmic regression calculation to determine the trend.
Screener Type:
Log Regression Channel: The signal is based on the slope of the entire regression channel over the lookback period. An upward sloping channel is bullish (1), and a downward sloping one is bearish (-1).
Logarithmic Regression: The signal is based on the most recent value of the regression line compared to its value 3 bars ago. This provides a more responsive measure of the immediate trend.
5. Alerts
You can set up the following alerts through the TradingView alerts panel:
New Channel Formed: Triggers when a new price consolidation channel is detected and drawn on the chart.
Bullish Breakout: Triggers when the price breaks out and closes above the upper boundary of a channel.
Bearish Breakout: Triggers when the price breaks out and closes below the lower boundary of a channel.
Is In Channel: Triggers on every bar that the price is currently trading inside an active channel.
Signal UP: Triggers when the Screener's signal turns bullish (1).
Signal DOWN: Triggers when the Screener's signal turns bearish (-1).

Smart Money Trap Scanner [TradingFinder]🔵 Introduction
In many market conditions, what initially seems to be a decisive breakout often turns out to be nothing more than a false breakout or fake move. Price breaks through a significant structural level, such as a swing high or low or a key support and resistance zone, only to quickly return to its previous range. These moves, often driven by liquidity traps or market manipulation, typically signal structural weakness rather than the start of a new trend.
This screener is specifically designed to detect such situations. It focuses on identifying false breakouts and price returns to broken levels within a defined time window, and then looks for retracements into the Fibonacci zone. If price reenters the 0.618 to 1.0 retracement area and aligns with the time-based filters, the system flags a low-risk, high-probability entry opportunity.
To enhance the precision of signal detection, the screener categorizes setups into two distinct types based on the speed of the price reaction after a breakout. Type A signals occur when the price breaks a level and immediately returns to break-even within the very next candle indicating a sharp rejection and rapid invalidation of the breakout. In contrast, Type B signals involve a more gradual return to the broken level, typically taking between two to five candles. This differentiation allows traders to better assess the context and urgency of each trap, providing a clearer understanding of momentum and liquidity behavior behind the move.
Additionally, the screener includes a Signal Age feature, which displays how much time has passed since the last valid signal was generated. This allows traders to quickly assess signal freshness and avoid acting on outdated setups, especially in fast-moving market environments.
One of the key advantages of this tool is its ability to simultaneously scan multiple symbols and timeframes. It only triggers an alert when all conditions false breakout, structural return, and Fibonacci alignment are met. This allows traders to bypass the need for manually reviewing dozens of charts and instead concentrate on clean, valid, and structure-based setups with greater precision.
🔵 How to Use
This tool operates as a structure-based screener that continuously scans various symbols and timeframes. By combining price behavior analysis, structural breakout detection, and Fibonacci retracement zones, it only signals entries when the probability of reversal is significantly supported by liquidity logic and price correction depth.
The system doesn’t just monitor price movements beyond key levels like swing highs or lows. It also evaluates whether the move quickly reverses and absorbs liquidity. If so, Fibonacci is applied to measure the depth of the pullback and identify the most favorable entry zones.
🟣 Long Signal
A long setup is triggered when price temporarily breaks below a valid structural support or swing low. This initial move is typically designed to trigger stop losses and collect sell-side liquidity. If price returns to the broken level within five candles, it is considered a false breakout.
At this point, Fibonacci is drawn from the recent swing high to the new low. If price enters the 0.618 to 1.0 retracement zone within the next ten candles, a potential long entry aligned with Smart Money logic is activated. This deep retracement zone often offers the best low-risk entry, as it typically marks the area where liquidity has been absorbed and the breakout structure has failed.
The stop loss is placed slightly below the 1.0 level to account for minor fluctuations, while the target is set based on trend structure or risk-reward preferences.
🟣 Short Signal
A short setup begins with price temporarily breaking above a valid resistance or swing high. This breakout is often driven by buy-side liquidity collection or stop hunting. If price returns to the broken level within five candles, the move is marked as a breakout failure.
Fibonacci is then drawn from the recent swing low to the new high. If price enters the 0.618 to 1.0 zone within ten candles after the return, a short opportunity is confirmed. This area usually represents the maximum acceptable retracement before a continuation move to the downside and often triggers strong reactions.
The stop loss is placed just above the 1.0 level, and the target is defined based on the expected structure of the move or a predetermined reward ratio.
🟡 Advantages of the Screener
Unlike manual approaches that require constant monitoring of multiple charts, this tool functions as a fully automated screener across multiple symbols and timeframes. It continuously evaluates key levels, liquidity reactions, structural returns, and Fibonacci zones. An alert is only generated when all necessary conditions are met with high accuracy.
This ensures that traders avoid risky or misleading entries and stay focused on precise, verified, and logic-based setups — saving time, reducing noise, and improving consistency in decision-making.
🔵 Settings
🟣 Logical settings
Swing period : You can set the swing detection period.
Valid After Trigger Bars : Limits how many candles after a fake breakout the entry zone remains valid.
Max Swing Back Method : It is in two modes "All" and "Custom". If it is in "All" mode, it will check all swings, and if it is in "Custom" mode, it will check the swings to the extent you determine.
Max Swing Back : You can set the number of swings that will go back for checking.
🟣 Display Settings
Table on Chart : Allows users to choose the position of the signal dashboard either directly on the chart or below it, depending on their layout preference.
Number of Symbols : Enables users to control how many symbols are displayed in the screener table, from 10 to 20, adjustable in increments of 2 symbols for flexible screening depth.
Table Mode : This setting offers two layout styles for the signal table :
Basic : Mode displays symbols in a single column, using more vertical space.
Extended : Mode arranges symbols in pairs side-by-side, optimizing screen space with a more compact view.
Table Size : Lets you adjust the table’s visual size with options such as: auto, tiny, small, normal, large, huge.
Table Position : Sets the screen location of the table. Choose from 9 possible positions, combining vertical (top, middle, bottom) and horizontal (left, center, right) alignments.
🟣 Symbol Settings
Each of the 10 symbol slots comes with a full set of customizable parameters :
Symbol : Define or select the asset (e.g., XAUUSD, BTCUSD, EURUSD, etc.).
Timeframe : Set your desired timeframe for each symbol (e.g., 15, 60, 240, 1D).
🟣 Alert Settings
Alert : Enables alerts for SMT Screener.
Message Frequency : Determines the frequency of alerts. Options include 'All' (every function call), 'Once Per Bar' (first call within the bar), and 'Once Per Bar Close' (final script execution of the real-time bar). Default is 'Once per Bar'.
Show Alert Time by Time Zone : Configures the time zone for alert messages. Default is 'UTC'.
🔵 Conclusion
Many trading mistakes stem from misinterpreting price breaks and entering too early into deceptive moves. In a market environment where false breakouts, liquidity traps, and engineered movements are increasingly common, having a tool that accurately filters these events and frames them within a Fibonacci-based and time-filtered structure provides a real strategic edge.
This indicator merges market structure logic, false breakout detection, and precise retracement analysis to ensure trades are only taken when multiple technical factors are aligned. It not only enhances trade success rates but also helps avoid emotional or impulsive entries.
Moreover, with the ability to scan across several symbols and timeframes simultaneously, the tool goes beyond being just an indicator it becomes a semi-automated structural analysis system. For traders who base their decisions on price behavior, Smart Money logic, and structural retracements, this screener can become a key component of a disciplined and effective trading approach.
สคริปต์แบบชำระเงิน

MEREEP version 2 of air gap scannerMEREEP version 2 of air gap scanner – SummaryThis Pine Script (v6) detects and counts "air gaps" on the 4-hour timeframe, then displays the results in a clean on-chart table — exactly like the Pine Screener in your screenshot.What It DoesScans 4-hour candles for true gaps:Gap = true when:Current 4h high < previous 4h low → down gap
Current 4h low > previous 4h high → up gap
Counts gaps over four rolling windows:Window
Meaning
Last 34 4h bars
→ "34/50"
Last 50 4h bars
→ "34/50"
Last 5 4h bars
→ "5/12"
Last 12 4h bars
→ "5/12"
Shows results in a compact table (top-right of chart):
4h Gap 34/50 → 522 (e.g. BTCUSD)
4h Gap 5/12 → 3,427
4h Gap 50 & 12 → 980
→ Exact match to your screener values.
Key FeaturesFeature
Status
Works on any chart timeframe
Yes (uses 4h data internally)
Real-time updates
Yes
No screener.add_column errors
Yes (uses table)
No ta.sum errors
Yes (uses sum() / math.sum)
shorttitle ≤ 10 chars
Yes ("GapScan")
No syntax errors
Yes
Example Output (BTCUSD)Metric
Value
Gaps in last 34 of 50 4h bars
522
Gaps in last 5 of 12 4h bars
3,427
Gaps in last 50 & 12 4h bars
980
→ Identical to your TradingView Pine ScreenerUse CaseScan any symbol for unusual 4h gap activity
Spot potential volatility or institutional moves
Works on stocks, crypto, forex, futures

CBC Flip with Volume [Pt]█ CBC Flip with Volume
A price-action based indicator that detects real-time control flips between bulls and bears, enhanced with volume filtering and Pine Screener compatibility.
This tool tracks when the market shifts from bear control to bull control or vice versa, using candle structure and volume behavior. It highlights key reversal points, filters low-conviction moves, and provides two screener-ready outputs for directional monitoring.
█ What It Detects
This script identifies when control flips between buyers and sellers on a candle-by-candle basis. A flip is confirmed only when both price structure and volume meet strict criteria. The indicator uses an internal state to track who is in control and updates when a flip occurs.
█ Flip Conditions
Bull Flip
• Previous bar was under bear control
• Current candle closes above the previous high
• Candle is bullish (close is above open)
• Volume is greater than the previous bar
Bear Flip
• Previous bar was under bull control
• Current candle closes below the previous low
• Candle is bearish (close is below open)
• Volume is greater than the previous bar
When a flip occurs, the indicator updates the control state and records the open price of the flip candle.
█ Strong Flip Detection
A flip is considered strong when volume is also greater than the average volume over a set number of candles (default is 50). Strong flips are visually emphasized using larger markers and darker background shading. This helps filter out moves that lack follow-through volume.
█ Visual Elements on Chart
• Bull Flip (Normal): Small teal triangle below the candle
• Bull Flip (Strong): Larger green triangle below the candle
• Bear Flip (Normal): Small salmon triangle above the candle
• Bear Flip (Strong): Larger red triangle above the candle
• Background Color:
– Green shades for bull flips
– Red shades for bear flips
– Darker color when flip is strong
These visual elements appear only on the candle where a flip is detected. No markers are shown on continuation candles.
█ Inputs
• Volume MA Lookback : Sets the moving average length used for determining whether volume is high enough for a strong flip (default: 50)
█ Alerts
• Bull Flip – Notifies when bulls take control
• Bear Flip – Notifies when bears take control
Alerts are triggered at candle close.
█ Pine Screener Support
This script includes two output columns for TradingView’s Pine Screener:
• Bull in Control (% gain) : Shows the percentage gain from the bull flip’s open to the current close. Resets to 0 when bulls lose control.
• Bear in Control (% gain) : Shows the percentage drop from the bear flip’s open to the current close (as a positive number). Resets to 0 when bears lose control.
These outputs allow you to filter for active moves. For example:
• Bull in Control (% gain) > 2.0 to find strong uptrends
• Bear in Control (% gain) > 1.5 to find sharp breakdowns
█ Use Cases
• Confirm breakouts using volume-backed flips
• Spot short-term reversals at key zones
• Filter out low-volume chop
• Combine screener results with trend or volatility filters
• Build entries around control flips and follow-through strength
Inspired by MapleStax’s original CBC method.

PriceCatch BOSS IOHi TradingView Community.
I am publishing a script that uses a proprietary logic based on Fibonacci retracement for identifying breakouts. This is a script that focuses on long side trades only.
PriceCatch BOSS IO: - PriceCatch Breakout Screener Script (Invite Only).
This script is not an indicator that plots anything on the chart but is a Screener.
SLIPPED OPPORTUNITIES
One of the problems faced by traders is that while they are watching or studying the chart of one stock or Forex pair, a super opportunity slips by them in another stock or another instrument and it is frustrating when that happens. With the PriceCatch BOSS IO script, you can now capture such moves made by other symbols whilst you are watching some other instrument.
USP:
The uniqueness of this script is that you can screen Nine of your favorite symbols for breakout opportunities simultaneously.
Users can pick Nine symbols of their choice and specify a resolution in the Settings dialog screen that the script will use to find out any probable breakouts in those selected nine symbols continuously.
The symbols could be from any exchange across the world and of any type - stocks, futures, commodities, Forex and Crypto. Simply put, if you can plot the symbol in TradingView, PriceCatch BOSS can monitor that instrument for breakouts on the time interval chosen by you.
ACTIONABLE INFORMATION:
What traders look for and expect from their charts is actionable information. This script does that. It clearly tells you the Entry Price and Stop Loss price for each symbol when a breakout opportunity presents itself in that symbol. You can then open up the chart of that specific symbol to validate the given information with any other indicators that you use and then take the call with regards to a trade. You may also use this script alone without adding any other indicator to your chart. The choice is yours.
CLARITY BEFORE TRADE:
As both Entry Price and Stop Loss Price are identified by the script, you receive advance information about the risk and can set your own Reward based on your personal preferences. So, with the necessary information provided to you in advance, you can plan your trades with clarity.
HOW IT WORKS:
Once the list of symbols are selected and resolution chosen, the script then continuously monitors those given symbols for breakout opportunities. At the close of every interval, it presents the results as shown below:
Results Set
This script shows the results of the screening in a Table as under:
SYMBOL Entry Price Stop Price
TSLA 830.84 802.88
EURUSD 1.13425 1.13160
Similarly for seven more instruments chosen by you.
NOTE: 0.00 under Entry and Stop price columns mean that there is no opportunity in that symbol.
ADVANTAGE:
The advantage of this script is that it helps you spot trades in your favorite symbols without manually loading their charts. With the ability to screen the symbols from Intraday time frames to higher time frames such as Weekly, you will be able to spot opportunities to go long in intraday, swing and even positional trades of longer duration.
Another significant advantage of this script is that while you may be watching a symbol in, say 15 minutes time frame, you can set the script to monitor breakouts in any other higher time frame starting from 15 minutes. This, in effect, gives you unsurpassed advantage.
DISCIPLINE:
As you choose your nine instruments/assets, the script indirectly inculcates discipline as your attention will be only on the selected instruments and you will not be distracted or search for opportunities in a whole bunch of other symbols / assets / instruments. As you can at any time change the set of nine assets as per your personal preference, you get the flexibility that you seek to work with a different set of symbols. For Forex traders who like to monitor only Major Pairs the ability to scan Nine pairs is quite sufficient. Similarly, to traders who trade S&P500, ES1! and other instruments, the nine symbols flexibility is adequate.
LONG POSITION TOOL
For visual cues, you may use the Long Position tool to set the Entry, Stop and Targets as per your preference on the main chart.
TRICK:
Can I only screen nine instruments? What if I am interested to screen more? Actually, you can screen more instruments. You see, you can add this script on to your chart multiple times and can select a set of nine unique stocks per script instance. That way you can actually screen more than nine stocks!
EXAMPLES:
Nifty 50
TSLA
Maruti
USDJPY
MSFT
UI
The script allows you to fine tune display options as per your personal preferences.
NOTE: This script runs in a separate pane without obstructing the view of your main chart.
NOTE: The formatting of price is based on mintick. As a result, since Forex and Crypto have more number of digits after the Decimal, if your screener list consists of a mix of stocks, Forex and Crypto - please change to a Forex chart to get the correct Forex price and to Crypto for correct Crypto price and so on.
NOTE: You will not get accurate results if you are in a higher time frame chart and the Screener resolution is set to lower time frame. For example, if chart is in 15 MTF and Screener resolution is set to 3 MTF, the results may not be accurate.
TIP: If you have added this script multiple times to your chart, then you may have to maximize the pane to view the results table.
NOTE - PRIOR TO USING THIS SCRIPT:
Please remember that the script is shared with absolutely no assurances about usability and any warranties whatsoever and as a responsible trader, please satisfy yourselves thoroughly and use it only if you are convinced it works for you. Remember, you are 100% responsible for your actions and must, therefore, do your due diligence before using this script and also before every trade. Profits and losses are part and parcel of trading activity and you are solely responsible for both. If you understand and accept that, you may use the script.
QUERIES/FEEDBACK
Please PM me.
Hope you find this script useful. Wish everyone all the best with trading.
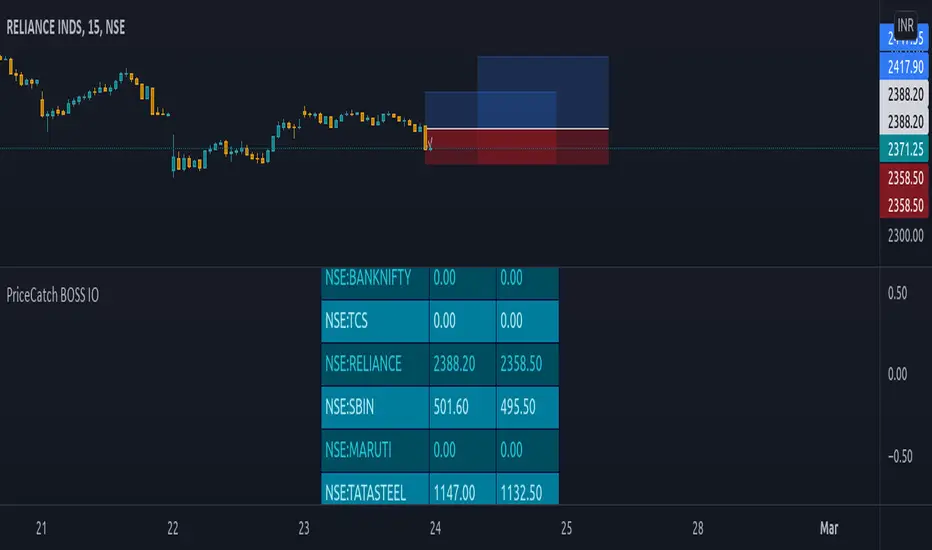
Seasonality Calculator Custom Date Range AnalysisThe Seasonality Calculator lets you manually test any seasonal window by choosing a start day/month and end day/month, and then evaluating how that exact period performed historically.
For the selected date range, the script looks back over past years and calculates:
Average return
Hit rate (win rate)
Winning years vs. total years
The results are displayed in a compact on-chart table showing:
Entry date & exit date (calendar days)
Pattern length
Average return & hit rate
Win/trade count
Optionally, the indicator can also draw highlighted boxes for each year of the chosen seasonal window, so you can visually inspect how that specific date range behaved in the past.
You can:
Choose the exact start and end dates (day & month),
Set how many years of history to include,
And filter by simple regimes such as US election cycle years.
All calculations are based on daily data, and the math is consistent with the Seasonality Screener: if you take a pattern from the Screener and enter the same dates into this Calculator, you will get the same historical statistics.
Use this tool to experiment with custom seasonal ideas and to fine-tune windows you discover with the Screener, always in combination with your own analysis and risk management.

GROK - 40 Day High BreakoutTitle: GROK - Customizable High Breakout Detector
To scan base breakout with Pine Screener
Description:
This Pine Script indicator identifies high breakout patterns based on a user-defined lookback period. By default, it checks for a breakout of the 40-day high, but the period can be adjusted to suit your trading strategy. Key features include:
Custom Lookback Period: Easily modify the number of days for high breakout detection. Lookback period is length of base you want to scan using pine screener.
Visual Alerts: Displays a green triangle above the price bar when a breakout is detected.
Alert Conditions: Built-in alert notifications for automated breakout detection.
Screener Compatibility: Plots breakout signals as a histogram for screener use.
This script is ideal for traders looking to identify strong breakout patterns and incorporate them into their strategies.
How to Use:
Adjust the lookback period in the settings to match your desired breakout criteria.
Add alerts for automated notifications when a breakout is detected.
Use the visual markers and histogram to analyze breakout patterns on your chart.
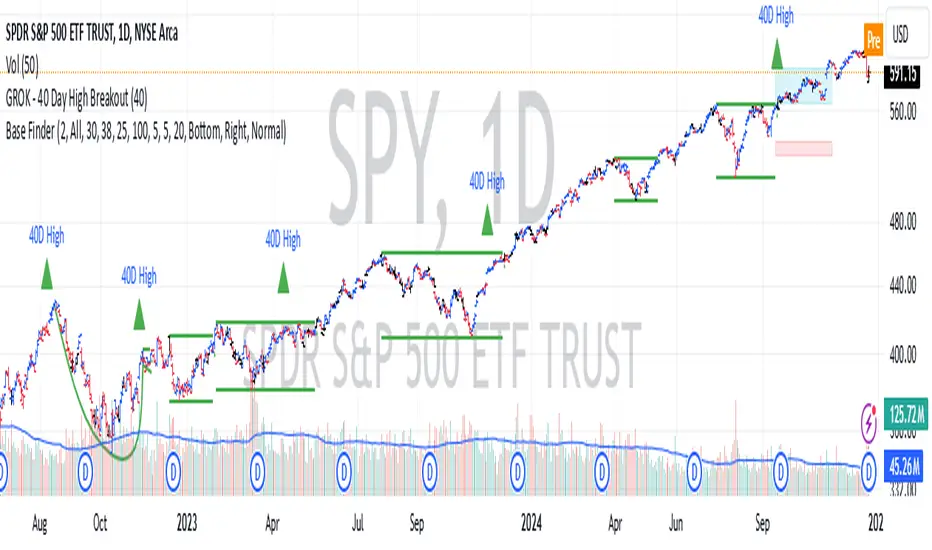
Quantum TrendQuantum Trend indicator is our new tool to trade on futures and spot markets in the world of cryptocurrency.
This indicator uses some advanced techniques to determine price reversals and filter them out with other indicators, such as oscillators ( Stochastic RSI and etc. ) and trend-based indicators ( such as EMA and others ), but even after filtering signals with these tools Quantum Trend indicator then applies our own private algorithm, based on our modified z-score mertic, which reduces lag drastically and helps find good entries faster.
What algo is behind the signals?
For finding new entries we used RSI- and stochastic-based oscillators, which help us determine potential price reversal movements. When new entry is found, we filter it through our own stochastic RSI filter (takes stoch RSI's pivot points into account to find better entries; pivot points left and right bars are hard coded into the indicator) with our private indicators, based on close-to-close volatility filter methods, to understand whether or not entry valid enough. Why stochastic RSI? Because it is much less messy than most of other existing oscillators (by our own opinion and experience).
That was first filtering stage, now comes the second .
In the second phase we filter out signals even more with our own modified-standard-deviation-based indicators ( not Bollinger Bands! ) to determine whether or not price went above or below 2 sigma channel, which would mean that current price's movement is extremely rare (because for going above 2 sigma or below -2 sigma there is only 5% chance (classic Gaussian distribution)) and the reversal will probably happen soon.
If signal passed all two phases of filtering, it will be showed on the chart.
Over all, this indicator uses our own private indicators, based on some core concepts, which we described above ( classic Gaussian distribution for choosing signals with nice reversal moments , close-to-close volatility for understanding if market is volatile enough to make a good move , modified z-score metric for reducing lag and finding entries faster , own stoch RSI filter with pivot points for reducing lag and finding good reversal moments and etc. )
That's for idea reveal, now let's dive into the settings!
Indicator settings
Main Algo Settings — group of settings of the core algorithm, that forms signals.
Signal Length * — determines how many bars from the past should be taken to make a signal.
Signal Factor * — determines the threshold for signal quality.
* — the more this parameter is, the less signals you will get, but they will be more high-quality.
Signals to Show — determines which type of signals will be displayed on the chart:
Classic — Long/Short signals;
Strong — Strong Long/Short signals;
All — Classic + Strong signals;
Signal Colours — group of settings for customizing signals' colours.
Long — colour for Long signals
Short — colour for Short signals
Strong Long — colour for Strong Long signals
Strong Short — colour for Strong Short signals
Filter for Strong Signals — group of settings for strong signals.
Use Strong Signals? — enabling/disabling strong signals on the chart;
Apply this filter to Strong Signals? — enabling/disabling filter for strong signals. When disabled, strong signals won't be filtered and there will be a lot more signals on the chart, but with less quallity.
Fast Period * — number of bars for 1st group of candles to form a signal;
Slow Period * — number of bars for 2nd group of candles to form a signal ( we need these two groups to align short-term with long-term trend );
Additional Filter Period * — period for filter indicator, which cuts out bad strong signals;
Additional Filter Smoother Period * — period for filter indicator's smoother, which makes additionally smoothes signals to filter out bad ones;
Filter's source — price souce for the filter ( open, close, hl2 and etc. ).
* — the more this parameter is, the less signals you will get, but they will be more high-quality.
2nd Filter — group of settings for the 2nd filter, which cuts out bad signals from Main Algo.
Enable 2nd Filter? — enabling/disabling 2nd filter. When diasbled, there wiull be a lot more signals on the chart, but with less quality;
2nd Filter Length — period for the indicator, which is embedded in 2nd filter. Based on improved RSI;
OverBought Lvl — level, which indicates that asset is probably overbought ;
OverSold Lvl — level, which indicates that asset is probably oversold ;
TP/SL Settings — Take-Profit/Stop-Loss settings
Use TP? — Show take profits on the chart
TP Mode — Take Profit mode (either zone or 3 levels (drawn on the chart))
Take-Profit 1, 2, 3 Factor — Multiplier/factor for the 1st, 2nd, 3rd take-profits accrodingly . Determines the width of the take profits/zone (the higher the factor, the further the take profits are located from the entry point)
SL Factor — Multiplier/factor for the stop loss (line on the chart; not displayed if the take profit mode is set to zone)
Whales Screener — screener, that shows where whales buy (green zones) and sell (red zones).
Use Whales Screener? — enabling/disabling whales screener.
Support & Resistance Settings — group of settings for support and resistance lines.
Support Color — Support color;
Resistance Color — Resistance color;
S/R Strength — Strength of support and resistance lines. The greater it is, the more reliable the S/R lines will be;
Line Style — style of each S/R line ( solid, dotted, dashed );
Zone Width, % — Zone width in percentage of the price fro the last 250 bars;
Extend S/R Lines — Extend the S/R lines to the right and left.
What timeframes to use?
This indicator was built to work on any timeframe, but our practice shows that it works best on higher timeframes such 30 minutes and more, but you should find by yourself which timeframe suits you best.
What markets can this indicator be applied to?
This indicator is market-indifferent, which means that you can use this indicator on any possible market.
How should I use this indicator?
Quantum Trend indicator can be a useful tool for finding entries and confirming signals from your own trading system, as it is built with multiple signal filter layers, which drastically reduce amount of bad signals. Also it is better to use other indicators to confirm signals, produced by Quantum Trend, because this way you will get even more high-quality signals.
Does it repaint?
No, this indicator doesn't repaint.
IMPORTANT, PLEASE READ!
This is indicator is not a Holy Grail of trading and we DON'T promote it as such in any possible way. As any possible indicator, Quantum Trend uses price data of the past, which CAN NOT guarantee perfect price predicitions of the future!
Hope this indicator will help you make a much better trading decisions!
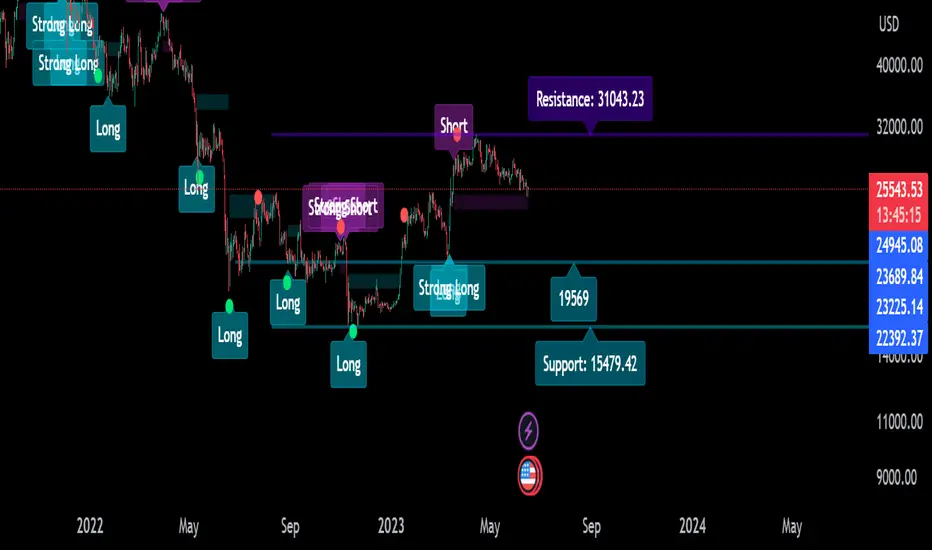
Relative Volume & RSI PopThis is a basic idea/script designed to take a breakout trade by taking advantage of volume spikes when price/strength is extended (either long or short).
The script only utilises two indicators, the Relative Volume (RV) and the Relative Strength Index (RSI). The script allows the user to select a RSI value between 69 up to 100 for a long trade and between 35 down to 0 for short trade and then pair this with RV from 0 - 10. The period for both the RSI and RV can also be amended by the user but I found in most cases there was no benefit gained by changing away from normal "14" period lookback. The script typically only has small draw downs as the script is designed to exit the trade when the RSI returns back to "normalised" level, therefore the trades are generally quite short. The exit condition for a long trade is when RSI crosses back below 69 (which is why you cannot enter a long below this value) and for a short the, trade will close when RSI crosses back above 35 (which is why you cannot enter a short above this value). These exit values are locked.
By allowing RSI value to go all the way up to "100" on the long side and "0" on the short side this in effect is a way of eliminating the script from taking either longs or shorts if lets say you wanted to back test the script for long only spikes or short only spike. E.G. By setting RSI upper value to "75" the RV to "1" and RSI lower value to "0" then no short trades will not be taken in your back test as the RSI never really gets down to zero.
I put this together with meme stocks in mind and back tested it on day charts for AMC and then a few trending style stocks too. It typically worked best as long only and with RSI settings between 71 - 75 and RV at 1 or 1.5. I also found it had okay results on some lower 1hr timeframe futures markets and weekly time frames too (albeit trades were few and far between on weekly timeframe).
The beauty of such a basic script you could easily set up a trading view screener to look for these opportunities everyday and perhaps even add in an ADX filter on the screener to see if the trend is increasing. Then use this script to run a back test on the stocks that you've selected from the screener.

Momentum Day Trading ToolkitMomentum Day Trading Toolkit
Complete User Guide
Table of Contents
Overview
Quick Start
The Dashboard
Module 1: 5 Pillars Screener
Module 2: Gap & Go
Module 3: Bull Flag / Flat Top
Module 4: Float Rotation
Module 5: R2G / G2R
Module 6: Micro Pullback
Signal Reference
Quality Score
Settings Guide
Alerts Setup
Trading Workflows
Troubleshooting
Overview
The Momentum Day Trading Toolkit combines 6 powerful indicators into one unified system for day trading momentum stocks.
ModulePurpose① 5 PillarsConfirms stock is "in play"② Gap & GoPre-market levels & gap analysis③ Bull Flag / Flat TopClassic breakout patterns④ Float RotationMeasures true interest level⑤ R2G / G2RTracks prior close crosses⑥ Micro PullbackPrecision continuation entries
All modules work together - the dashboard shows you everything at a glance, and you can enable/disable any module you don't need.
Quick Start
Step 1: Add to Chart
Add the indicator to any stock chart
Recommended timeframes: 1-minute, 5-minute, or 15-minute
Step 2: Check the Dashboard (Top Right)
Look for:
Status = Current state (Scanning, Entry Signal, etc.)
Quality Score = Setup rating out of 10
Green checkmarks (✓) = Criteria passing
Step 3: Watch for Entry Signals
Triangles, circles, diamonds below bars = Entry signals
Arrows = R2G/G2R crosses
Step 4: Set Alerts
Right-click chart → Add Alert
Select "Momentum Day Trading Toolkit"
Choose your alert condition
The Dashboard
The dashboard in the top-right corner gives you instant analysis:
┌─────────────────────────────┐
│ MOMENTUM TOOLKIT │
├─────────────────────────────┤
│ Status │ 🎯 ENTRY SIGNAL │
│ Day │ 🟢 GREEN │
│ Gap │ +8.5% 🔥 │
│ RVol │ 3.2x ✓ │
│ Rotation │ 1.45x 🔥 │
│ Float │ 5.2M 🔥 │
│ Change │ +12.3% ✓ │
│ Pattern │ BULL FLAG! │
│ EMA 9/20 │ Above Both ✓ │
│ VWAP │ Above ✓ │
│ Prior Cl │ 5.91 │
│ PM High │ 9.11 ✓ │
│ Price │ 9.46 ✓ │
└─────────────────────────────┘
Dashboard Row Reference
RowWhat It ShowsGood ValuesStatusCurrent state🎯 ENTRY SIGNALDayGreen/Red vs prior close🟢 GREENGapGap % from prior close🔥 (5%+) or 🔥🔥 (10%+)RVolRelative volume✓ (2x+) or ✓✓ (5x+)RotationFloat rotation🔥 (1x) or 🔥🔥 (2x+)FloatFloat in millions🔥 (<5M) or Low (<10M)ChangeDaily % change✓ (meets minimum)PatternPattern statusBREAKOUT!EMA 9/20Trend positionAbove Both ✓VWAPVWAP positionAbove ✓Prior CloseKey R2G levelReference pricePM HighPre-market high✓ = Above itPriceCurrent price✓ = In range
Status Messages
StatusMeaningActionScanning...Looking for setupsWait✅ ALL PILLARSStock qualifiesWatch for pattern⏳ PATTERN FORMINGSetup developingGet ready🎯 ENTRY SIGNALSignal triggeredExecute trade
Module 1: 5 Pillars Screener
What It Does
Confirms the stock meets basic criteria to be worth trading.
The 5 Pillars
PillarDefaultWhy It MattersRelative Volume2x+ (5x for "strong")Confirms unusual interestDaily Change5%+Stock is movingPrice Range$1-$20Sweet spot for momentumFloat Size<20M sharesLower float = bigger moves
Visual Indicator
Green background appears when ALL pillars pass
Dashboard Shows
Individual pillar status with ✓ checkmarks
Quality score includes pillar factors
Settings
SettingDefaultDescriptionMin RVol2.0xMinimum relative volumeStrong RVol5.0xVolume for full qualificationMin Change5%Minimum daily moveMin Price$1Minimum stock priceMax Price$20Maximum stock priceMax Float20MMaximum float size
Module 2: Gap & Go
What It Does
Analyzes pre-market gaps and displays key price levels.
Key Levels Displayed
LevelColorDescriptionPrior CloseOrangeYesterday's close - THE key levelPM HighGreenPre-market high - breakout levelPM LowRedPre-market low - support
Gap Classification
Gap SizeRatingMeaning5-9.9%🔥 QualifyingWorth watching10%+🔥🔥 StrongHigh priority
Entry Signal
Small green triangle = PM High Breakout
How to Trade
Stock gaps up in pre-market
Wait for market open
Look for break above PM High
Enter on breakout with stop below PM Low
Settings
SettingDefaultDescriptionMin Gap %5%Qualifying gap thresholdStrong Gap %10%Strong gap thresholdShow PM LevelsONDisplay PM high/low lines
Module 3: Bull Flag / Flat Top
What It Does
Detects classic continuation patterns and signals breakouts.
Bull Flag Pattern
▲ BREAKOUT (Entry Signal)
│
┌────┴────┐
│ Pullback │ ← 2-5 red candles
│ (flag) │ Max 50% retrace
└─────────┘
│
┌────┴────┐
│ Pole │ ← 3+ green candles
│ (move) │ Strong momentum
└─────────┘
Flat Top Pattern
═══════════════ Resistance (2+ touches)
│
▲ BREAKOUT above resistance
Entry Signals
SignalShapeColorPatternBull Flag Breakout▲ TriangleLimeFlag breaks upFlat Top Breakout◆ DiamondAquaResistance breaks
How to Trade Bull Flag
See 3+ green candles (the pole)
Price pulls back 2-5 red candles
Pullback stays above 50% of move
Enter on break above pullback high
Stop below pullback low
Settings
SettingDefaultDescriptionMin Pole Candles3Green candles neededMax Pullback5Max red candles allowedMax Retrace50%Max pullback depthFT Touches2Resistance touches neededFT Lookback10Bars to check for resistance
Module 4: Float Rotation
What It Does
Tracks how many times the entire float has traded hands today.
The Formula
Rotation = Cumulative Day Volume ÷ Float
Rotation Levels
RotationEmojiMeaning0.5x—Half float traded1.0x🔥FULL rotation - significant!2.0x🔥🔥Double rotation - extreme3.0x+🔥🔥🔥Triple rotation - rare event
Why It Matters
High rotation = Extreme interest
Everyone who owns shares has likely traded
Often precedes explosive moves
Shows "real" demand beyond just volume
Dashboard Shows
Current rotation level
Fire emojis for milestones
Settings
SettingDefaultDescriptionFloat SourceAutoAuto-detect or manualManual Float10MIf auto fails, use thisAlert Level1.0xAlert when rotation hits this
Module 5: R2G / G2R
What It Does
Tracks when price crosses the prior day's close - a key psychological level.
Red to Green (R2G) 🟢
Prior Close ─────────────────
↗ CROSS TO GREEN
↗
(opened red)
Stock opened below prior close (red)
Crosses above prior close (green)
BULLISH signal
Green to Red (G2R) 🔴
(opened green)
↘
↘ CROSS TO RED
Prior Close ─────────────────
Stock opened above prior close (green)
Crosses below prior close (red)
BEARISH signal
Entry Signals
SignalShapeColorMeaningR2G↑ ArrowLimeCrossed to greenG2R↓ ArrowRedCrossed to red
Why R2G Matters
Bears who shorted get squeezed
Creates FOMO buying
Prior close becomes support
Momentum often continues
Dashboard Shows
Current day status (🟢 GREEN / 🔴 RED)
Whether R2G or G2R occurred (R2G ✓ or G2R ✓)
Settings
SettingDefaultDescriptionRequire Opposite OpenONR2G needs red openShow Prior CloseONDisplay the line
Module 6: Micro Pullback
What It Does
Finds precision entries on brief 1-3 candle pullbacks after strong moves.
The Pattern
▲ ENTRY (break pullback high)
│
┌──┴───┐
│ 1-3 │ ← Micro pullback (brief!)
│ red │ Stop = low of this
└──────┘
│
┌──┴───┐
│ 3+ │ ← Strong move
│green │ Momentum building
└──────┘
Why Micro Pullbacks Work
Tight stop = Pullback low is close
Momentum intact = Only paused briefly
Early entry = Catch continuation early
Clear trigger = Break of pullback high
Entry Signal
SignalShapeColorMicro Pullback Entry● CircleYellow
How to Trade
See 3+ green candles (strong move)
1-3 red candles (brief pause)
Pullback stays above 50% retrace
Enter when green candle breaks pullback high
Stop at pullback low
Settings
SettingDefaultDescriptionMin Green Candles3Candles before pullbackMax Pullback3Max red candlesMax Retrace50%Max pullback depth
Signal Reference
All Entry Signals (Below Bar)
ShapeColorSignalModule▲ Large TriangleLimeBull Flag BreakoutPatterns◆ DiamondAquaFlat Top BreakoutPatterns● CircleYellowMicro Pullback EntryMicro PB▲ Small TriangleGreenPM High BreakoutGap & Go↑ ArrowLimeRed to GreenR2G/G2R
Warning Signals (Above Bar)
ShapeColorSignalModule↓ ArrowRedGreen to RedR2G/G2R
Optional Forming Signals (Disabled by Default)
ShapeColorSignal🚩 FlagFaded LimeBull Flag Forming● CircleFaded YellowMicro PB Forming
Enable "Show 'Forming' Markers" in settings to see these
Quality Score
The quality score (0-10) rates the overall setup strength.
Scoring Breakdown
FactorPointsRVol 5x++2RVol 2x++1Daily change 5%++1Low float (<20M)+1Strong gap (10%+)+2Qualifying gap (5%+)+1Rotation 1x++2Rotation 0.5x++1Above EMA 20+1
Score Interpretation
ScoreGradeAction8-10A+Best setups - full position6-7AGood setups - standard size4-5BAverage - reduced size0-3CWeak - skip or paper trade
Settings Guide
Module Toggles
Turn each module ON/OFF:
SettingDefaultDescription① 5 Pillars ScreenerONStock qualification② Gap & Go AnalysisONGap & level analysis③ Bull Flag / Flat TopONPattern detection④ Float RotationONRotation tracking⑤ R2G / G2R TrackerONPrior close crosses⑥ Micro PullbackONPullback entries
Visual Settings
SettingDefaultDescriptionShow DashboardONDisplay info tableTable SizeNormalSmall/Normal/LargeShow Entry SignalsONDisplay entry shapesShow 'Forming' MarkersOFFShow pattern formingShow Key LevelsONPrior close, PM levelsShow EMA 9/20ONTrend EMAsShow VWAPONVWAP line
Recommended Presets
Minimal (Clean Chart)
Show Dashboard: ON
Show Entry Signals: ON
Show 'Forming' Markers: OFF
Show Key Levels: OFF
Show EMA: OFF
Show VWAP: OFF
Standard (Balanced)
All defaults
Full Analysis
All settings ON
Alerts Setup
Available Alerts
AlertTriggerAny Bullish EntryAny entry signal firesBull Flag BreakoutBull flag breaks outFlat Top BreakoutFlat top breaks outMicro Pullback EntryMicro PB triggersPM High BreakoutBreaks above PM highRed to GreenR2G crossGreen to RedG2R crossFloat RotationHits rotation level5 Pillars PassAll pillars qualifyPattern FormingPattern starts formingHigh Quality EntryEntry with score 7+/10
How to Set Alerts
Right-click on chart
Select "Add Alert"
Condition: "Momentum Day Trading Toolkit"
Select alert type from dropdown
Set expiration and notifications
Click "Create"
Recommended Alerts
For Active Trading:
Any Bullish Entry
High Quality Entry
For Watchlist Monitoring:
5 Pillars Pass
Float Rotation
Trading Workflows
Workflow 1: Full Qualification
Step 1: 5 PILLARS
└─→ Wait for "✅ ALL PILLARS" status
Step 2: CHECK SETUP
└─→ Quality score 6+?
└─→ Above EMA and VWAP?
Step 3: WAIT FOR ENTRY
└─→ Bull Flag, Flat Top, or Micro PB signal
Step 4: EXECUTE
└─→ Enter on signal
└─→ Stop below pattern low
└─→ Target 2:1 minimum
Workflow 2: Gap & Go
Step 1: PRE-MARKET
└─→ Stock gaps 5%+ (shows in Gap row)
Step 2: MARKET OPEN
└─→ Note PM High level (green line)
Step 3: WAIT FOR BREAK
└─→ PM High Breakout signal (small triangle)
Step 4: CONFIRM
└─→ R2G if opened red (double confirmation)
└─→ RVol 2x+
Step 5: EXECUTE
└─→ Enter on PM High break
└─→ Stop below PM Low
Workflow 3: Micro Pullback Scalp
Step 1: FIND MOMENTUM
└─→ Stock moving, 3+ green candles
Step 2: WAIT FOR PAUSE
└─→ 1-3 red candles (brief pullback)
Step 3: ENTRY
└─→ Yellow circle signal appears
Step 4: QUICK TRADE
└─→ Enter at signal
└─→ Tight stop at pullback low
└─→ Quick target (1:1 to 2:1)
Troubleshooting
Q: Lines are moving/jumping on real-time chart?
A: This was fixed in latest version. Make sure you have the newest code. Lines now lock in place at market open.
Q: Too many signals, chart is cluttered?
A:
Turn off "Show 'Forming' Markers"
Disable modules you don't need
Use "Minimal" visual preset
Q: No signals appearing?
A:
Check if "Show Entry Signals" is ON
Make sure relevant module is enabled
Stock may not meet pattern criteria
Q: Dashboard shows wrong float?
A:
TradingView float data isn't available for all stocks
Switch Float Source to "Manual"
Enter correct float in millions
Q: PM High/Low not showing?
A:
Only appears during market hours
Needs pre-market data to calculate
Check if "Show Key Levels" is ON
Q: Quality score seems wrong?
A:
Score updates in real-time
Check individual factors in dashboard
RVol and rotation change throughout day
Q: Alert not triggering?
A:
Make sure alert is set on correct symbol
Check alert hasn't expired
Verify condition is set correctly
Quick Reference Card
Entry Signals
▲ Lime Triangle = Bull Flag Breakout
◆ Aqua Diamond = Flat Top Breakout
● Yellow Circle = Micro Pullback
▲ Green Triangle = PM High Break
↑ Lime Arrow = R2G (bullish)
↓ Red Arrow = G2R (bearish)
Dashboard Quick Read
🎯 = Entry signal active
✅ = All pillars pass
🟢 = Day is green
🔥 = Strong (gap/rotation)
✓ = Criteria met
✗ = Criteria failed
Quality Score
8-10 = A+ (Best)
6-7 = A (Good)
4-5 = B (Average)
0-3 = C (Weak)
Key Levels
Orange Line = Prior Close (R2G level)
Green Line = PM High (breakout level)
Red Line = PM Low (support)
Purple Line = VWAP
Yellow/Orange = EMA 9/20
Happy Trading! 🎯📈
For questions or issues, use TradingView's comment section on the indicator page.

ICT Levels Breach Scanner (12M Timeframe)Detects and scans for breaches of key Inner Circle Trader (ICT) concepts on the yearly (12M) chart: Swing Lows (3-bar wick pivots), Rejection Blocks (3-bar body pivots), Fair Value Gaps (3-bar inefficiencies), and Volume Imbalances (bullish body gaps ≥0.15%, unmitigated).
Features:
Tracks active levels with arrays for real-time breach detection (price low below any level triggers alert).
Visuals: Blue solid lines (Swing Lows), orange dashed (Rejection Blocks), purple dotted (FVGs), green boxes (VIs)—all extending right.
Red triangle + bgcolor alert on breach bar; built-in alertcondition for notifications.
Optimized for Pine Screener: Filter stocks (e.g., US exchanges) showing symbols where price has traded below these levels on the latest 12M bar.
Usage: Apply to a 12M chart for viz, or add to Screener > Pine tab for multi-symbol scans. Customize gap % or add bearish variants via inputs. Ideal for spotting potential support in long-term trends.
ICT-inspired; test on liquid stocks like AAPL/TSLA. Not financial advice.

Market Structure Report Library [TradingFinder]🔵 Introduction
Market Structure is one of the most fundamental concepts in Price Action and Smart Money theory. In simple terms, it represents how price moves between highs and lows and reveals which phase of the market cycle we are currently in uptrend, downtrend, or transition.
Each structure in the market is formed by a combination of Breaks of Structure (BoS) and Changes of Character (CHoCH) :
BoS occurs when the market breaks a previous high or low, confirming the continuation of the current trend.
CHoCH occurs when price breaks in the opposite direction for the first time, signaling a potential trend reversal.
Since price movement is inherently fractal, market structure can be analyzed on two distinct levels :
Major / External Structure: represents the dominant macro trend.
Minor / Internal Structure: represents corrective or smaller-scale movements within the larger trend.
🔵 Library Purpose
The “Market Structure Report Library” is designed to automatically detect the current market structure type in real time.
Without drawing or displaying any visuals, it analyzes raw price data and returns a series of logical and textual outputs (Return Values) that describe the current structural state of the market.
It provides the following information :
Trend Type :
External Trend (Major): Up Trend, Down Trend, No Trend
Internal Trend (Minor): Up Trend, Down Trend, No Trend
Structure Type :
BoS : Confirms trend continuation
CHoCH : Indicates a potential trend reversal
Consecutive BoS Counter : Measures trend strength on both Major and Minor levels.
Candle Type : Returns the current candle’s condition(Bullish, Bearish, Doji)
This library is specifically designed for use in Smart Money–based screeners, indicators, and algorithmic strategies.
It can analyze multiple symbols and timeframes simultaneously and return the exact structure type (BoS or CHoCH) and trend direction for each.
🔵 Function Outputs
The function MS() processes the price data and returns seven key outputs,
each representing a distinct structural state of the market. These values can be used in indicators, strategies, or multi-symbol screeners.
🟣 ExternalTrend
Type : string
Description : Represents the direction of the Major (External) market structure.
Possible values :
Up Trend
Down Trend
No Trend
This is determined based on the behavior of Major Pivots (swing highs/lows).
🟣 InternalTrend
Type : string
Description : Represents the direction of the Minor (Internal) market structure.
Possible values :
Up Trend
Down Trend
No Trend
🟣 M_State
Type : string
Description : Specifies the type of the latest Major Structure event.
Possible values :
BoS
CHoCH
🟣 m_State
Type : string
Description : Specifies the type of the latest Minor Structure event.
Possible values :
BoS
CHoCH
🟣 MBoS_Counter
Type : integer
Description : Counts the number of consecutive structural breaks (BoS) in the Major structure.
Useful for evaluating trend strength :
Increasing count: indicates trend continuation.
Reset to zero: typically occurs after a CHoCH.
🟣 mBoS_Counter
Type : integer
Description : Counts the number of consecutive structural breaks in the Minor structure.
Helps analyze the micro structure of the market on lower timeframes.
Higher value : strong internal trend.
Reset : indicates a minor pullback or reversal.
🟣 Candle_Type
Type : string
Description : Represents the type of the current candle.
Possible values :
Bullish
Bearish
Doji
import TFlab/Market_Structure_Report_Library_TradingFinder/1 as MSS
PP = input.int (5 , 'Market Structure Pivot Period' , group = 'Symbol 1' )
= MSS.MS(PP)

Session-Conditioned Regime ATRWhy this exists
Classic ATR is great—until the open. The first few bars often inherit overnight gaps and 24-hour noise that have nothing to do with the intraday regime you actually trade. That inflates early ATR, scrambles thresholds, and invites hyper-recency bias (“today is crazy!”) when it’s just the open being the open.
This tool was built to:
Separate session reality from 24h noise. Measure volatility only inside your defined session (e.g., NYSE 09:30–16:00 ET).
Judge candles against the current regime, not the last 2–3 bars. A rolling statistic from the last N completed sessions defines what “typical” means right now.
Label “large” and “small” objectively. Bars are colored only when True Range meaningfully departs from the session regime—no gut feel, no open-bar distortion (gap inclusion optional).
Overview
Purpose: objectively identify unusually big or small candles within the active trading session, compared to the recent session regime.
Use cases: volatility filters, entry/exit confirmation, session bias detection, adaptive sizing.
This indicator replaces generic ATR with a session-conditioned, regime-aware measure. It colors candles only when their True Range (TR) is abnormally large/small versus the last N completed sessions of the same session window.
How it works
Session gating: Only bars inside the selected session are evaluated (presets for NYSE, CME RTH, FX NY; custom supported).
Per-bar TR: TR = max(high, prevRef) − min(low, prevRef).
prevRef is the prior close for in-session bars.
First bar of the session can include the overnight gap (optional; default off).
Regime statistic: For any bar in session k, aggregate all in-session TRs from the previous N completed sessions (k−N … k−1), then compute Median (default) or Mean.
Today’s anchor: Running statistic from today’s session start → current bar (for context and the on-chart ratio).
Color logic:
Big if TR ≥ bigMult × RegimeStat
Small if TR ≤ smallMult × RegimeStat
Colored states: big bull, big bear, small bull, small bear.
Non-triggering bars retain the chart’s native colors.
Panel (top-right by default)
Regime ATR (Nd): session-conditioned statistic over the past N completed sessions.
Today ATR (anchored): running statistic for the current session.
Ratio (Today/Regime): intraday volatility vs regime.
Sample size n: number of bars used in the regime calculation.
Inputs
Session Preset: NYSE (09:30–16:00 ET), CME RTH (08:30–15:00 CT), FX NY (08:00–17:00 ET), Custom (session + IANA timezone).
Regime Window: number of completed sessions (default 5).
Statistic: Median (robust) or Mean.
Include Open Gap: include overnight gap in the first in-session bar’s TR (default off).
Big/Small thresholds: multipliers relative to RegimeStat (defaults: Big=1.5×, Small=0.67×).
Colors: four independent colors for big/small × bull/bear.
Panel position & text size.
Hidden outputs: expose RegimeStat, TodayStat, Ratio, and Z-score to other scripts.
Alerts
RegimeATR: BIG bar — triggers when a bar meets the “Big” condition.
RegimeATR: SMALL bar — triggers when a bar meets the “Small” condition.
Hidden outputs (for strategies/screeners)
RegimeATR_stat, TodayATR_stat, Today_vs_Regime_Ratio, BarTR_Zscore.
Notes & limitations
No look-ahead: calculations only use information available up to that bar. Historical colors reflect what would have been known then.
Warm-up: colors begin once there are at least N completed sessions; before that, regime is undefined by design.
Changing inputs (session window, multipliers, median/mean, gap toggle) recomputes the full series using the same rolling regime logic per bar.
Designed for standard candles. Styling respects existing chart colors when no condition triggers.
Practical tips
For a broader or tighter notion of “unusual,” adjust Big/Small multipliers.
Prefer Median in markets prone to outliers; use Mean if you want Z-score alignment with the panel’s regime mean/std.
Use the Ratio readout to spot compression/expansion days quickly (e.g., <0.7× = compressed session, >1.3× = expanded).
Roadmap
More session presets:
24h continuous (crypto, index CFDs).
23h/Globex futures (CME ETH with a 60-minute maintenance break).
Regional equities (LSE, Xetra, TSE), Asia/Europe/NY overlaps for FX.
Half-day/holiday templates and dynamic calendars.
Multi-regime comparison: track multiple overlapping regimes (e.g., RTH vs ETH for futures) and show separate stats/ratios.
Robust stats options: trimmed mean, MAD/Huber alternatives; optional percentile thresholds instead of fixed multipliers.
Subpanel visuals: rolling TodayATR and Ratio plots; optional Z-score ribbon.
Screener/strategy hooks: export boolean series for BIG/SMALL, plus a lightweight strategy template for backtesting entries/exits conditioned on regime volatility.
Performance/QOL: per-symbol presets, smarter warm-up, and finer control over sample caps for ultra-low TF charts.
Changelog
v0.9b (Beta)
Session presets (NYSE/CME RTH/FX NY/Custom) with timezone handling.
Panel enhancements: ratio + sample size n.
Four-state bar coloring (big/small × bull/bear).
Alerts for BIG/SMALL bars.
Hidden Z-score stream for downstream use.
Gap-in-TR toggle for the first in-session bar.
Disclaimer
For educational purposes only. Not investment advice. Validate thresholds and session settings across symbols/timeframes before live use.

Phaser [QuantVue]The Phaser indicator is a tool to help identify inflection points by looking at price relative to past prices across multiple timeframes and assets.
Phase 1 looks for the price to be higher or lower than the closing price of the bar 4 bars earlier and is complete when 9 consecutive bars meet this criterion.
A completed Phase 1 is considered perfect when the highs (bearish) or lows (bullish) have been exceeded from bars 6 and 7 of the phase.
A bullish setup requires 9 consecutive closes less than the close 4 bars earlier.
A bearish setup requires 9 consecutive closes greater than the close 4 bars earlier.
Phase 2 begins once Phase 1 has been completed. Phase 2 compares the current price to the high or low of two bars earlier.
Unlike Phase 1, Phase 2 does not require the count to be consecutive.
Phase 2 is considered complete when 13 candles have met the criteria.
An important aspect to Phase 2 is the relationship between bar 13 and bar 8.
To ensure the end of Phase 2 is in line with the existing trend, the high or low of bar 13 is compared to the close of bar 8.
A bullish imperfect 13 occurs when the current price is less than the low of 2 bars earlier, but the current low is greater than the close of bar 8 in Phase 2.
A bearish imperfect 13 occurs when the current price is greater than the high of 2 bars earlier, but the current high is less than the close of bar 8 in Phase 2.
Phase 2 does not need to go until it is complete. A Phase 2 can be canceled if the price closes above or below the highest or lowest price from Phase 1.
Settings
3 Tickers
3 Timeframes
Show Phase 1
Show Phase 2
User-selected colors
Ultimate Fundamental FortressScript Overview
This script provides a comprehensive Fundamental Health Scorecard for stocks, calculating a normalized score out of 100 based on key financial metrics fetched from TradingView's fundamental data. It displays the results in an elegant table with customizable colors, a dynamic plot for visualization, and a scorecard label for quick insights. The scorecard helps users assess a stock's value, profitability, and financial strength at a glance.
Purpose
The primary goal is to simplify fundamental analysis by aggregating essential ratios into a single, easy-to-interpret score. Inspired by value investing principles (e.g., low P/E and P/B for undervalued stocks, high ROE for efficiency), it empowers traders and investors to identify strong fundamentals quickly. It's especially useful for screening undervalued opportunities or comparing stocks within sectors.
Principles
Metrics Selection: Focuses on core fundamentals: Price-to-Book (P/B), Price-to-Earnings (P/E), Return on Equity (ROE), Debt-to-Equity (D/E), Free Cash Flow (FCF normalized by market cap), EBITDA (normalized by market cap), and Net Profit Margin. These are chosen for their balance of valuation, profitability, and risk assessment.
Scoring Philosophy: Each metric is scored based on thresholds (e.g., low ratios for valuation metrics indicate better value). If manual sector averages are provided, scoring becomes relative (e.g., stock P/B below sector average gets higher points), reducing subjectivity and adapting to industry norms. Without averages, absolute thresholds apply.
Normalization: Scores are summed and scaled to 100, ignoring missing data to ensure robustness. This allows fair comparison across stocks with varying data availability.
Customization: Users can adjust thresholds, colors, and sector averages for personalized analysis, making it flexible for different markets or strategies.
Calculation Methodology
Data Fetching: Uses request.financial() to pull quarterly (FQ) or trailing twelve months (TTM) data for metrics like BVPS, EPS, ROE, etc.
Ratio Computations:
P/B = Close Price / BVPS
P/E = Close Price / EPS
ROE = Directly fetched
D/E = Total Liabilities / Equity
Net Margin = Net Income / Revenue
Normalized FCF = FCF / Market Cap (as percentage)
Normalized EBITDA = EBITDA / Market Cap (as percentage)
Scoring:
For each metric, compare to thresholds or relative to sector averages (if provided >0).
Example for P/B: If relative (sector avg >0), stock P/B < avg * high factor → 15 pts; < avg * med factor → 10 pts; etc.
For ROE/Net Margin (higher is better): Reverse logic (stock > avg / factor).
FCF/EBITDA: Always absolute (normalized thresholds).
Minimum score per metric: 2-5 pts if poor.
Total Score: Sum valid scores, divide by max possible for those metrics, multiply by 100.
Output: Table shows components, values, scores, and sector avgs.
Plot visualizes score with color-coding.
Label categorizes (e.g., "Buffett Approved" for 85+).
User Inputs and Benefits
Thresholds (Absolute/Relative Factors): Customize scoring rules (e.g., change P/E low threshold from 10 to 12).
Benefit: Adapt to personal strategy or market conditions – e.g., stricter for growth stocks.
Manual Sector Averages: Enter averages (e.g., sector P/B = 2.5).
Benefit: Makes scoring industry-specific, reducing bias (e.g., tech's high P/E normal, banking's low ROE risky). If not entered (≤0), falls back to absolute for simplicity.
Color Customizations: Adjust table colors (header, scores).
Benefit: Personalize visuals for dark/light themes, improving readability and user experience.
Normalized FCF/EBITDA Thresholds: Set as % of market cap. Benefit: Size-independent comparison – small caps won't be disadvantaged.
Usage Notes Add to chart via Indicators menu.
Data relies on TradingView fundamentals – may be limited for some exchanges (e.g., BIST, international). Use manual averages for accuracy.
For screener: High request count (10) may exceed limits; use reduced version if needed.
Not financial advice – always verify with external sources.
Feedback welcome – let's improve together!

Twin Optimized Trend Tracker Strategy TOTTAnıl Özekşi's new strategy which is a combination of 2 Optimized Trend Tracker lines which are vertical displaced from original version with a COEFFICIENT to cope with sideways' false signals which he explained in "Toy Borsacı İçin OTT Kullanım Kılavuzu 2"
original version of OTT:
OTT Strategy and Screener:
You can find a detailed explanation with subtitles from the developer of OTT Anıl Özekşi himself as: "Toy Borsacı İçin OTT Kullanım Kılavuzu 2"
TechnicalRating█ OVERVIEW
This library is a Pine Script™ programmer’s tool for incorporating TradingView's well-known technical ratings within their scripts. The ratings produced by this library are the same as those from the speedometers in the technical analysis summary and the "Rating" indicator in the Screener , which use the aggregate biases of 26 technical indicators to calculate their results.
█ CONCEPTS
Ensemble analysis
Ensemble analysis uses multiple weaker models to produce a potentially stronger one. A common form of ensemble analysis in technical analysis is the usage of aggregate indicators together in hopes of gaining further market insight and reinforcing trading decisions.
Technical ratings
Technical ratings provide a simplified way to analyze financial markets by combining signals from an ensemble of indicators into a singular value, allowing traders to assess market sentiment more quickly and conveniently than analyzing each constituent separately. By consolidating the signals from multiple indicators into a single rating, traders can more intuitively and easily interpret the "technical health" of the market.
Calculating the rating value
Using a variety of built-in TA functions and functions from our ta library, this script calculates technical ratings for moving averages, oscillators, and their overall result within the `calcRatingAll()` function.
The function uses the script's `calcRatingMA()` function to calculate the moving average technical rating from an ensemble of 15 moving averages and filters:
• Six Simple Moving Averages and six Exponential Moving Averages with periods of 10, 20, 30, 50, 100, and 200
• A Hull Moving Average with a period of 9
• A Volume-Weighted Moving Average with a period of 20
• An Ichimoku Cloud with a conversion line length of 9, base length of 26, and leading span B length of 52
The function uses the script's `calcRating()` function to calculate the oscillator technical rating from an ensemble of 11 oscillators:
• RSI with a period of 14
• Stochastic with a %K period of 14, a smoothing period of 3, and a %D period of 3
• CCI with a period of 20
• ADX with a DI length of 14 and an ADX smoothing period of 14
• Awesome Oscillator
• Momentum with a period of 10
• MACD with fast, slow, and signal periods of 12, 26, and 9
• Stochastic RSI with an RSI period of 14, a %K period of 14, a smoothing period of 3, and a %D period of 3
• Williams %R with a period of 14
• Bull Bear Power with a period of 50
• Ultimate Oscillator with fast, middle, and slow lengths of 7, 14, and 28
Each indicator is assigned a value of +1, 0, or -1, representing a bullish, neutral, or bearish rating. The moving average rating is the mean of all ratings that use the `calcRatingMA()` function, and the oscillator rating is the mean of all ratings that use the `calcRating()` function. The overall rating is the mean of the moving average and oscillator ratings, which ranges between +1 and -1. This overall rating, along with the separate MA and oscillator ratings, can be used to gain insight into the technical strength of the market. For a more detailed breakdown of the signals and conditions used to calculate the indicators' ratings, consult our Help Center explanation.
Determining rating status
The `ratingStatus()` function produces a string representing the status of a series of ratings. The `strongBound` and `weakBound` parameters, with respective default values of 0.5 and 0.1, define the bounds for "strong" and "weak" ratings.
The rating status is determined as follows:
Rating Value Rating Status
< -strongBound Strong Sell
< -weakBound Sell
-weakBound to weakBound Neutral
> weakBound Buy
> strongBound Strong Buy
By customizing the `strongBound` and `weakBound` values, traders can tailor the `ratingStatus()` function to fit their trading style or strategy, leading to a more personalized approach to evaluating ratings.
Look first. Then leap.
█ FUNCTIONS
This library contains the following functions:
calcRatingAll()
Calculates 3 ratings (ratings total, MA ratings, indicator ratings) using the aggregate biases of 26 different technical indicators.
Returns: A 3-element tuple: ( [(float) ratingTotal, (float) ratingOther, (float) ratingMA ].
countRising(plot)
Calculates the number of times the values in the given series increase in value up to a maximum count of 5.
Parameters:
plot : (series float) The series of values to check for rising values.
Returns: (int) The number of times the values in the series increased in value.
ratingStatus(ratingValue, strongBound, weakBound)
Determines the rating status of a given series based on its values and defined bounds.
Parameters:
ratingValue : (series float) The series of values to determine the rating status for.
strongBound : (series float) The upper bound for a "strong" rating.
weakBound : (series float) The upper bound for a "weak" rating.
Returns: (string) The rating status of the given series ("Strong Buy", "Buy", "Neutral", "Sell", or "Strong Sell").
