VWAP + 2 Moving Averages + RSI + Buy and SellIndicator: VWAP + 2 Moving Averages + RSI + Buy and Sell
Buy and Sell Arrows (Great for use alone or in conjunction with other scripts on the chart)
This indicator displays BUY (BUY) and SELL (SELL) arrows on the chart based on a combination of moving averages, VWAP and RSI. Arrows are a visual way to identify trading opportunities and can be useful for traders who want to follow a strategy based on these conditions.
The indicator uses two moving averages (20 and 50 periods) to identify upward crosses (buy) and downward crosses (sell). In addition, it takes into account VWAP (Volume Weighted Average Price) and RSI (Relative Strength Index) as additional filters to confirm buy and sell signals.
This script is great for use both independently and in conjunction with other indicators and strategies. You can combine it with other indicators and customize it to your preferences to create a more comprehensive trading strategy.
Please remember that this indicator is provided for educational purposes only and does not constitute financial advice. It is always recommended to carry out a thorough analysis before making any trading decisions.
Give this indicator a try and enjoy clear visualization of buy and sell arrows on your chart. Happy trading!
ค้นหาในสคริปต์สำหรับ "rsi"

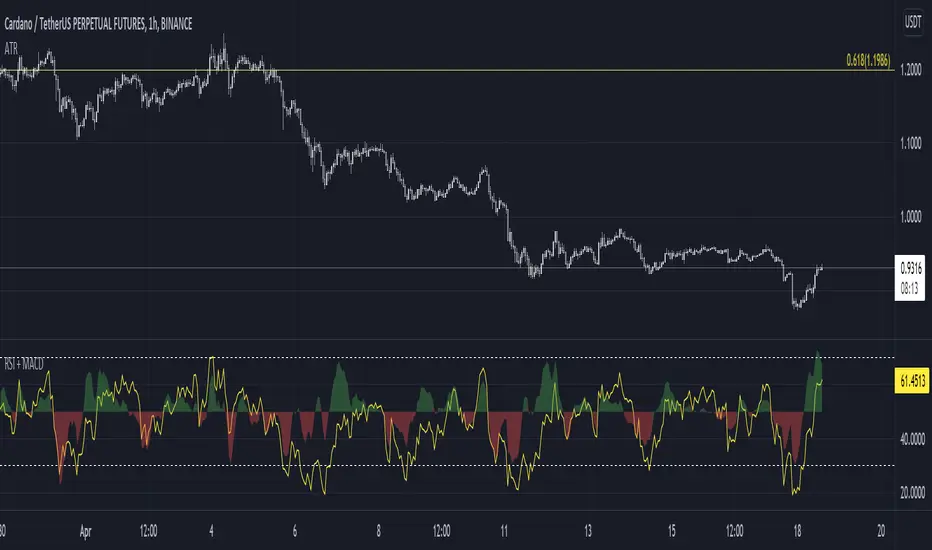
RSI + MACDRSI and MACD in one simplified indicator. Why? Because :
1. Save chart space, declutter, make decision making better, faster
2. MACD is not scaled to RSI range, now it is so you can have side by side comparison
Example how to use:
Enter on RSI oversold or overbought level, then exit on MACD crossover
See if there is an extra confluence to enter, hold or exit your trades, i.e oversold and falling macd is better than oversold and rising macd for short trades potentially.
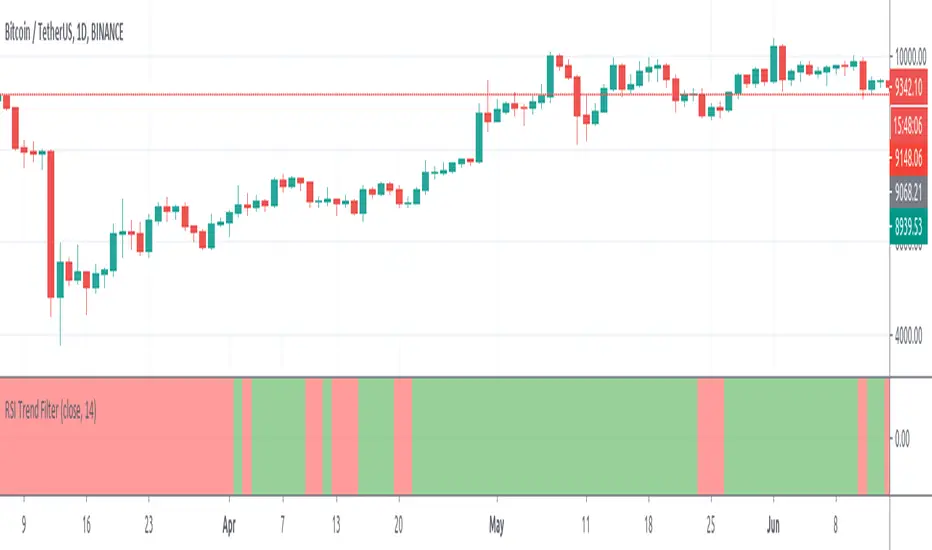
RSI Trend FilterRSI based basic trend filter. I don't used it in the NNFX structure but I wanted to test things.
Here RSI is not used as reversal indicator.
We check if RSI>50 or <50 and we use it as a trend confirmation indicator/filter.
RSI Fibonacci Levels StrategyRSI with Fibonacci Levels
Visually can be used as:
- Countertrend indicator at extreme green/red lines
- Follow trend indicator
- Fibonacci supports and resistantes zones
The strategy works as a follow trend
How to trade:
The indicator is more reliable in longer time frames, at least 4H
Choose a fibonacci level as reference
Buy when the RSI line turns green
Sell when the RSI line turns red

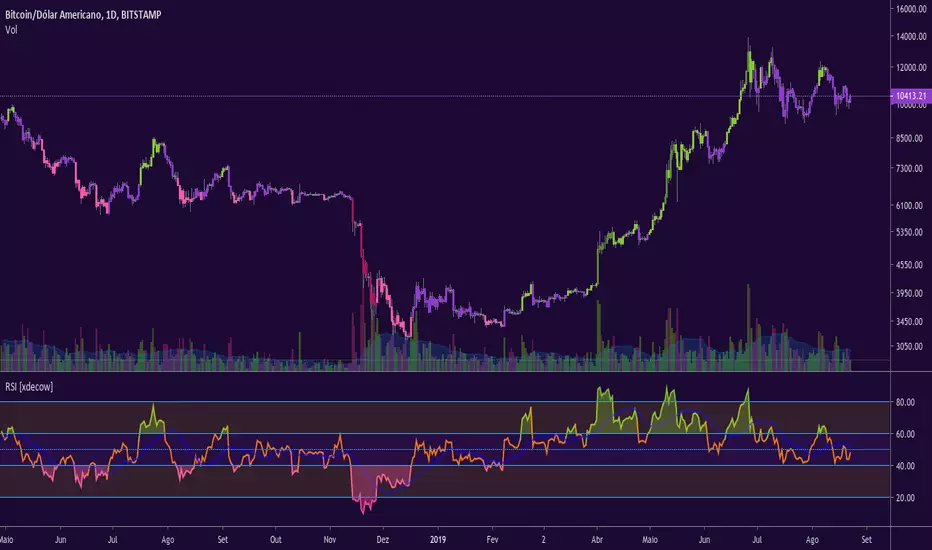
RSI [xdecow]RSI MTF
Options:
-MA
-RSI from another timeframe
-Uptrend/Downtrend zone
-barcolor based on RSI trend

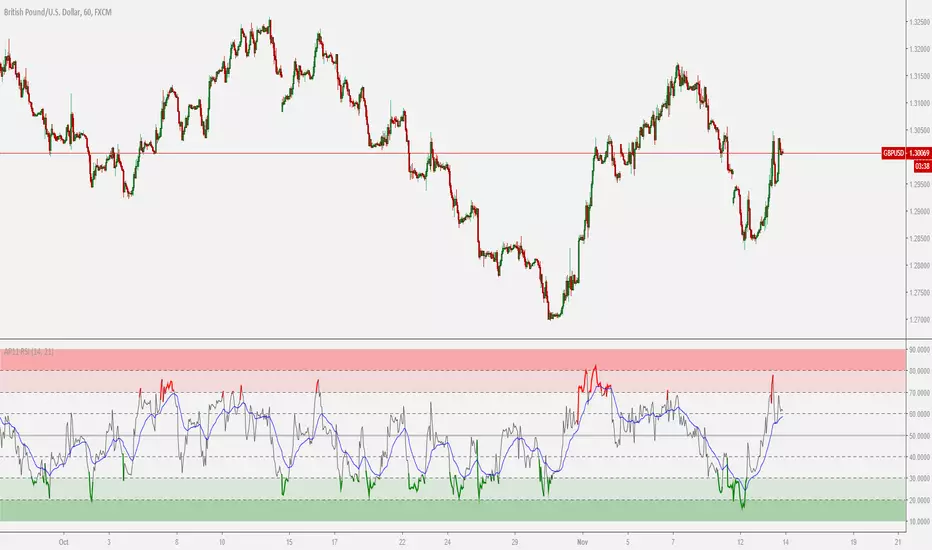
TTM Apollo 11 RSIColor coded RSI to give a better indication of when to buy or sell based on the RSI level along with an included EMA signal to help describe the trend.

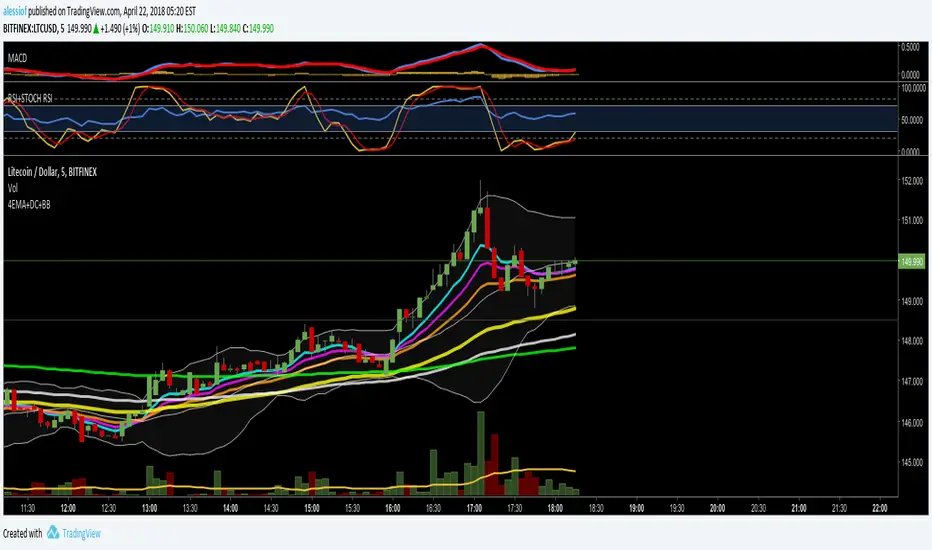
RSI + STOCH RSI OVERLAY by AlessiofRSI and Stochastic RSI in one. Standard settings.
Check out my other script for 4EMA + Death Cross + Bollinger Bands all in one.
RSI + StochasticRSI overbought and oversold histogram
Just indicator combo of oldschool slow stochastic and rsi, just looking a little bit better for someone.
Strategy is simple:
1) RSI is overbought or oversold (above 70, below 30)?
2) Stochastic line crosses its ema?
3) Stochastic and stochastic ema are in overbought = sell, oversold = buy.
Works good in volitile stocks/pairs and suits for fast scalping timeframes 1m 5m 15m
Strategy is old as the books, this is just a better visual for it.

RSI Combo (RSI, StochRSI)RSI and StochRSI combination with color fill histogram if RSI is over 70 or below 30.

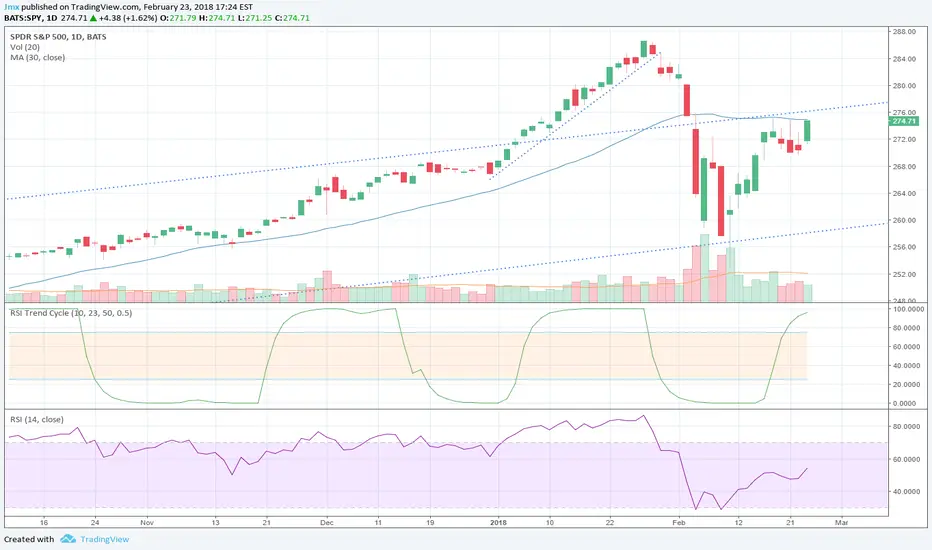
RSI Trend Cycle [JMX]RSI Trend cycle applies fast stochastics and a cyclic component to smooth out RSI movements and make reading of RSI trends dramatically easier.
Works on any timeframe.
Usage:
- LONG on cross from 0 upwards
- SHORT on cross from 100 downwards
Works best if:
traded in the prevailing direction of a market. If the market trend is bullish (like SPY) then you LONG from 0 and step aside on cross down from 100.
Used at an interval lower than the one you want to trade (i.e., 1h for intra-day trends, 1d for weekly trends)
Paired with an exit signal of your choice (i.e., trendline)

RSI with 3 Separate Smoothing AveragesRSI has 3 moving averages, to help trade better
RSI period can be adjusted
Moving average has multiple selections (SMA, EMA, HMA)
moving average cross over can be used as signal for trades
Trade at your own risk

RSI Golden & Dead Cross AlertRSI 14 Golden And Dead Cross Indicator
It will give you an alert when there are rsi golden and dead cross.
It is a intergated signal: Crossing up and Crossing down of RSI.

RSI Regimes + Cardwell Sweet SpotsRSI based upon Cardwell principles, with a strength evaluation based upon the ADX, VWAP, velocity of both, and Cardwell RSI principles of a sweet spot of a RSI.

RSI Signal Backtest Bounce AlertRSI crosses below 5min signal line, bounce above 50 RSI and crosses bullish back above signal line. Once it backtests signal the indicator will fire.

RSI - Ostinato TradingRSI indicator for Ostinato Trading scalping strategy. The classic RSI with special color fills for extremum detection.
RSI + MFIRSI and MFI combined, width gradient fields if OS or OB, shows divergences separate for wicks and bodies, shows dots when mfi and rsi oversold at the same time.

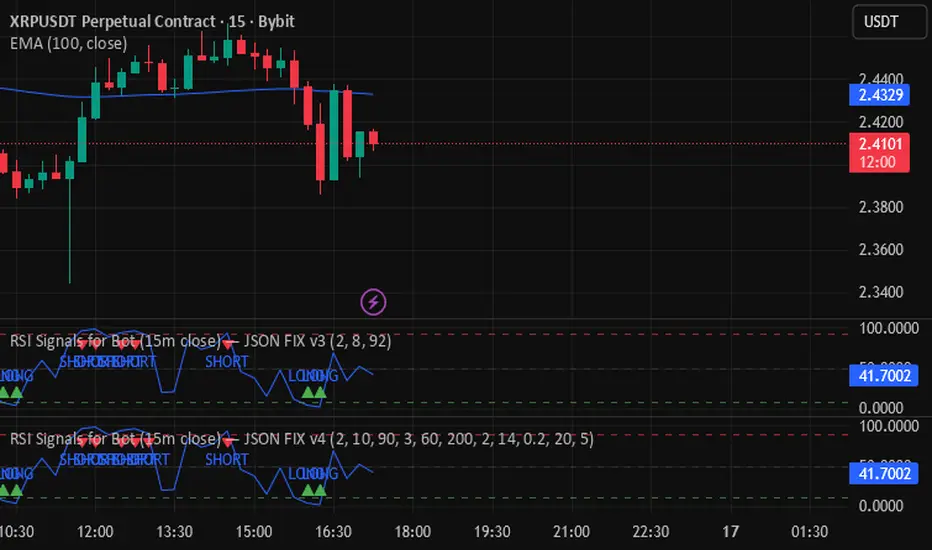
RSI Signals for Bot (15m close) — JSON FIX v4RSI Signals for Bot (JSON Ready) is a lightweight automation-friendly indicator that generates clean LONG and SHORT alerts based on RSI thresholds, fully formatted in JSON for webhook-based trading bots.
It’s designed primarily for 15-minute charts and sends one alert per confirmed bar close.
RSI Cross Alerts with Vertical Lines (9:30 AM - 2:45 PM)RSI Cross Alerts - Indicates Vertical Lines on previous times the RSI Indicator Crosses Overbought or Oversold parameters set by user.
