BB & MTF EMAs + DPOC/WPOCDescription:
This indicator combines multiple trend and support/resistance tools into a single overlay with specific customization for the Indian Standard Time (IST) session.
Features Included:
Bollinger Bands: 20-period SMA Basis, 1.5 StdDev.
4 Multi-Timeframe EMAs:
EMA 1: 9 Length (1m timeframe)
EMA 2: 20 Length (3m timeframe)
EMA 3: 50 Length (15m timeframe)
EMA 4: 200 Length (15m timeframe)
Session POCs (IST):
Daily POC (DPOC): Calculated 05:30-05:29 IST. Extends for full 24h session.
Weekly POC: Calculated from Monday 05:30 IST Open. Extends for full 7-day week.
Controls:
Toggle visibility for all individual components.
"Show Historical" toggle for pivots to see past levels or keep charts clean.
ค้นหาในสคริปต์สำหรับ "poc"

GRAM SCALP_PDH/PDL/P.POC/P.VAL/P.VAH_9/21EMA)This is a simple scalping strategy for futures markets (e.g., MNQ/ES), designed for prop firm challenges that require consistency and good R/R. It focuses on intraday trades during NY session (9:30 ET onward), using bias, EMAs, and key levels from prior Globex session (18:00–17:00 ET).
Goal: Set-and-forget limit orders in bias direction, aiming for small, consistent wins.
Daily Bias (Trend Detection):
Based on the first 15-min candle (9:30–9:45 ET).
If close > open (green): LONG ONLY bias – background shades green, label says "LONG ONLY".
If close < open (red): SHORT ONLY bias – background shades red, label says "SHORT ONLY".
Trade only in bias direction to avoid counter-trend risks. No bias? Sit out.
EMAs for Entries/Confirmation:
9 EMA (orange): Fast line for short-term trend/pullbacks.
21 EMA (purple): Slower line for overall direction.
Entry idea: Wait for price to pull back to 9/21 EMA in bias direction, then enter on bounce/break (e.g., long above EMA on green bias).
Use as dynamic support/resistance – don't trade if price is far from EMAs.
Key Levels from Prior Session (Globex 18:00–17:00 ET):
PDH (Previous Day High): Gray line – potential resistance/target for longs.
PDL (Previous Day Low): Gray line – potential support/target for shorts.
Volume Profile (VP):
POC (Point of Control, orange): Highest volume price – strong magnet; price often returns here.
VAH (Value Area High, fuchsia circles): Top of 70% volume range – resistance; break above = bullish.
VAL (Value Area Low, fuchsia circles): Bottom of 70% volume range – support; break below = bearish.
Use levels for entries (e.g., bounce off VAL for long), stops (behind level), or targets (e.g., aim for POC/VAH).
Trading Rules:
Session: NY open (9:30 ET) to close (16:00 ET). Avoid news/high volatility.
Bias Only: After 9:45 ET, check label/color – trade longs on green, shorts on red.
Entries: Set limit orders at key levels/EMAs in bias direction. E.g., long bias: Buy limit at VAL or EMA pullback.
Risk Management:
Stop Loss: Behind nearest level (e.g., below VAL for long) or fixed 10-20 ticks.
Take Profit: 1:2 risk-reward or at next level (e.g., PDH/POC).
Position Size: 1-2% risk per trade; max 5 trades/day for prop rules.
Exits: Trail with EMAs or exit at EOD. No overnight holds.
Avoid: Choppy markets, gaps through levels, or no clear bias.
Why It Works:
Bias filters bad trades; EMAs confirm momentum; VP/PDH/PDL provide high-probability zones based on where volume/price settled overnight.
Simple, mechanical – ideal for prop challenges (rules on drawdown, consistency).
Backtest on 2-min charts; aim for 60%+ win rate on small scalps (5-20 ticks).
Customize in indicator settings (e.g., VP bin size, line colors). Test on demo before live. Not financial advice – trade at own risk.10 web pages

ProEdge Strategy's — Structure ReclaimWhat it does
ProEdge Indicator — Fib Reclaim Pro (Signals Only) finds “reclaim” setups of the active Time-Based Fib (TBF) leg and confirms them with weekly gates, optional POC alignment, and light OB proximity. When conditions line up, it prints a one-shot BUY/SELL triangle and can fire alerts—no auto-trading, no repainting tricks.
Best use / timeframes
HTF bias & swing trades: run your chart on 1D or 12H (default TBF = 12H). Great for swing positioning and “let it trend” moves.
Intraday: 4H / 1H for cleaner entries while keeping the 12H/1D bias.
Scalping: 15m / 5m with the higher-timeframe bias. Consider increasing Pivot Strength and Min Confluence Score, enable Require POC, and reduce Max bars to fill.
Alerts & Other Settings
Add alert → ProEdge BUY or ProEdge SELL → Once per bar close. Works with webhooks/Discord/Telegram.
Key settings (tune to your market)
TBF Timeframe (anchor leg, e.g., 12H/1D) & Pivot Strength.
Weekly gates: W 0.25 reclaim (longs) / W 0.75 loss (shorts), plus optional 0.50 bias.
Min Confluence Score, Require POC, OB band (ATR), Retest style (wick vs close), Cooldown, Max bars to fill.
All options live in settings - flip chart timeframes freely and adjust inputs to suit each symbol’s personality (crypto, FX, indices, stocks).
Trading notes
Use HTF for direction, LTF for execution. Let alerts bring you to the chart; still apply risk, invalidations, and position sizing. Educational tool - not financial advice.

Advanced Market Profile & S/R Zones (Pro)Advanced Market Profile & S/R Zones
This indicator brings professional Auction Market Theory to your chart using a custom rolling Volume Profile algorithm. Unlike standard profiles that remain fixed, this tool dynamically calculates the "Fair Value" of the asset based on your specific lookback period (e.g., the last 100 bars).
It automatically highlights the Point of Control (POC), Value Area (VA), and suggests statistical Discount (Buy) and Premium (Sell) zones.
Key Features
Volume Splitting Algorithm:
Most basic scripts dump the entire volume of a candle into a single price point (the average). This script splits the volume across the candle's entire High-Low range. This results in a much smoother, higher-resolution bell curve that accurately reflects price action, especially on higher timeframes like Monthly charts.
Auto-generated Zones:
Green Zone (Discount): Prices below the Value Area Low (VAL). Statistically "cheap."
Red Zone (Premium): Prices above the Value Area High (VAH). Statistically "expensive."
Real-Time Dashboard:
A built-in panel displays the exact price levels for the POC, VAH, and VAL for precise limit order placement, along with the current Market Trend.
How to Use
For Intraday (Day Trading):
Settings: Set Lookback to 100 - 300.
Strategy: Watch for price to open outside the Value Area. If price breaks back inside the Value Area, target the POC (Red Line).
For Macro (Monthly/Weekly Charts):
Settings: Set Lookback to 12 (1 Year) or 60 (5 Years).
Strategy: Identify multi-year structural support. When a monthly candle enters the Green Discount Zone of a 5-year profile, it is often a high-probability institutional entry point.
Trend Logic
The Dashboard indicates trend based on price location relative to value:
Strong Bullish: Price is accepted ABOVE the Value Area.
Strong Bearish: Price is accepted BELOW the Value Area.
Neutral / In VA: Price is chopping inside the Value Area.
Disclaimer
This is a "Rolling Profile." It calculates the profile based on the current lookback window relative to the latest bar. As new bars form, the lookback window shifts, and the profile updates to reflect the new dataset.

HTF Candle Profile [ChartPrime]⯁ OVERVIEW
The HTF Candle Profile visualizes higher-timeframe candle structure and its internal volume distribution directly on lower-timeframe charts. It automatically detects changes in higher-timeframe periods (daily, weekly, or monthly) and constructs a complete volume profile for each, allowing traders to see how volume is distributed across the range of that higher-timeframe candle. This helps identify whether momentum is supported by real volume strength or trapped price movement.
⯁ LOGIC
When a new higher-timeframe candle begins, the indicator starts collecting data for its open, high, low, close, and volume range.
Once sufficient bars have passed (defined by the Min Period Profile input), it calculates a full profile using adaptive bin sizing derived from the range (High–Low) and ATR for scaling precision.
The resulting bins represent the volume concentration at each price level of that higher-timeframe candle.
A Point of Control (PoC) is highlighted — the level where the most volume occurred.
The indicator then draws the higher-timeframe candle body and wicks at the chart’s right side, giving visual context of bullish or bearish sentiment.
⯁ FEATURES
Automatic HTF Detection: Identifies new Daily, Weekly, or Monthly periods and updates profiles in real time.
Dynamic Bin Calculation: Automatically adjusts bin size based on ATR and candle height for accurate volume granularity.
Volume Profile Rendering: Displays colored volume bars extending from the candle, showing where trading activity was concentrated.
Higher-Timeframe Candle Representation: Plots the full HTF candle (open, close, high, low) on the right side of the chart for visual clarity.
PoC Level & Labels: Marks the point of maximum volume within the candle profile with a line and volume label.
Configurable Levels: Toggle display of Open, Close, High, Low, and PoC for each higher-timeframe segment.
Color-coded Sentiment: Candle and profile colors reflect bullish or bearish momentum.
⯁ CONCLUSION
The HTF Candle Profile bridges lower- and higher-timeframe analysis by embedding high-resolution volume data within each major candle. It enables traders to see where liquidity and trading activity cluster inside higher-timeframe structures — revealing whether trends are volume-backed or hollow. Perfect for combining structural insight with volume confluence when analyzing market sentiment transitions across timeframes.

Adaptive Window Volume ProfileThe indicator builds a rolling volume profile over a chosen time window (1, 3, 12 months or lower), finds POC, VAH/VAL, RH/RL, HVN/LVN, and then overlays volume-driven bar colors (climax, initiative, absorption) filtered by a 30-day RVWAP trend, so you can see where big volume traded and who is winning there right now.
Example Use Case:
How to use it on 4H with 3-month and 12-month rolling profiles:
On a 4H chart, you run two copies of the indicator, both in Rolling Lookback mode, both using the Full (Overlap) engine:
Instance A – 12-month rolling profile (macro map):
-Rolling Unit: Months
-Rolling Length: 12
This gives you the 1-year composite:
-12M RH / RL → outer range of where almost all yearly volume traded (macro high/low “rails”).
-12M VAH / VAL → yearly value area: where the market has been comfortable doing business over the last year.
-12M POC → the single most traded price of the last 12 months (macro gravity).
-12M HVNs/LVNs → long-term shelves (acceptance) and gaps (knife-edges).
Use this instance to answer:
Where are we in the last year’s distribution, and are we approaching macro extremes or living in fair value?
-Combine it with the 30-day RVWAP regime the script computes:
-Above RVWAP and RVWAP rising → macro bull tilt.
-Below RVWAP and RVWAP falling → macro bear tilt.
For example:
-Price near 12M RL with RVWAP bull → potential deep-discount accumulation zone.
-Price near 12M RH with RVWAP bear → potential exhaustion / distribution zone.
Instance B – 3-month rolling profile (tactical map)
-Rolling Unit: Months
-Rolling Length: 3
This builds a 3-month composite on top of your 4H chart:
-3M RH / RL → extremes of the current quarter’s trading.
-3M VAH / VAL → current “fair value box” for the last 90-ish days.
-3M POC → where recent volume concentrates most heavily.
-3M HVNs/LVNs → fresh shelves and gaps inside the bigger yearly structure.
You use this instance for actual trade locations and management:
-Pullbacks into 3M VAL / RL that still sit inside the 12M value and in a bull RVWAP regime → high-probability dip-buy zones; you then look for bull initiative/absorption bar colors to confirm entry.
-Rallies into 3M VAH / RH that line up near 12M VAH / RH in a bear RVWAP regime → good areas to look for shorts, especially when you see bear climax/initiative bars there.
-3M LVNs that coincide with 12M LVNs or VA edges act as sharp decision points: acceptance through often means expansion; rejection often means reversal.
How it all fits together
On your 4H chart, with both instances active:
-12M profile = macro context and big terrain (where the yearly battlefield is).
-3M profile = tactical zones (where to actually trade inside that terrain).
-Bar colors (climax / initiative / absorption) filtered by 30-day RVWAP = timing + confirmation at those levels, favoring the side that has trend and effort behind it.
So the indicator, used this way, becomes:
-one instance to tell you where the big war is being fought (12M)
-one instance to tell you where the current campaign inside that war is concentrated (3M)
-bar colors to tell you whether the team you want to back is actually showing up with size when price hits those levels.

Market Structure Volume Time Velocity ProfileThis is the Market Structure Volume Time Velocity Profile (MSVTVP). It combines event-based profiling with advanced metrics like Time and Velocity (Flow Rate). Instead of fixed time periods, profiles are anchored to critical market events (Swings, Structure Breaks, Delta Breaks), giving you a precise view of value development during specific market phases.
## The 3 Dimensions of the Market
Unlike standard tools that only show Volume, MSVTVP allows you
to switch between three critical metrics:
1. **VOLUME Profile (The "Where"):**
* Shows standard acceptance. High volume nodes (HVN)
are magnets for price.
2. **TIME Profile (The "How Long"):**
* Similar to TPO, it measures how long price spent at each
level.
* **High Time:** True acceptance and fair value.
* **Low Time:** Rejection or rapid movement.
3. **VELOCITY Profile (The "How Fast"):**
* Measures the **speed of trading** (Contracts per Second).
This reveals the hidden intent of market participants.
* **High Velocity (Fast Flow):** Aggression. Initiative
buyers/sellers are hitting market orders rapidly. Often
seen at breakouts or in liquidity vacu.
* **Low Velocity (Slow Flow):** Absorption. Massive passive
limit orders are slowing price down despite high volume.
Often seen at major reversals ("hitting a brick wall").
Key Features:
1. **Event-Based Profile Anchoring:** The indicator starts a new
profile based on one of three user-selected events
('Profile Anchor'):
- **Swing:** A new profile begins when the 'impulse baseline'
(derived from intra-bar delta) changes. This baseline
adjusts when a new **price pivot** is confirmed: When a
price **high** forms, the baseline moves to the **lower**
of its previous level or the peak delta (max of
delta O/C) at the pivot. When a price **low** forms, it
moves to the **higher** of its previous level or the
trough delta (min of delta O/C) at the pivot.
- **Structure:** A new profile begins immediately on the bar
that *confirms* a market structure break (e.g., a new HH
or LL, based on a sequence of price pivots).
- **Delta:** A new profile begins immediately on the bar
that *confirms* a break in the *cumulative delta's*
market structure (e.g., a new HH or LL in the delta).
Both 'Swing' and 'Delta' anchors are derived from the same
**continuous (non-resetting) Cumulative Volume Profile Delta (CVPD)**,
which is built from the intra-bar statistical analysis.
2. **Statistical Profile Engine:** For each bar in the anchored
period, the indicator builds a volume profile on a lower
'Intra-Bar Timeframe'. Instead of simple tick counting, it
uses advanced statistical models:
- **Allocation ('Allot model'):** 'PDF' (Probability Density
Function) distributes volume proportionally across the
bar's range based on an assumed statistical model
(e.g., T4-Skew). 'Classic' assigns all volume to
the close.
- **Buy/Sell Split ('Volume Estimator'):** 'Dynamic'
applies a model that analyzes candle wicks and
recent trend to estimate buy/sell pressure. 'Classic'
classifies all volume based on the candle color.
3. **Visualization & Lag:** The indicator plots the final
profile (as a polygon) and the developing statistical
lines (POC, VA, VWAP, StdDev).
- **Note on Lag:** All anchor events require `Pivot Right Bars`
for confirmation.
- In 'Structure' and 'Delta' mode, the developing lines
(POC, VA, etc.) are plotted using a **non-repainting**
method (showing the value from `pivRi` bars ago).
- In 'Swing' mode, the profile is plotted **retroactively**,
starting *from the bar where the pivot occurred*. The
developing lines are also plotted with this full
`pivRi` lag to align with the past data.
4. **Flexible Display Modes:** The finalized profile can be displayed
in three ways: 'Up/Down' (buy vs. sell), 'Total' (combined
volume), and 'Delta' (net difference).
5. **Dynamic Row Sizing:** Includes an option ('Rows per Percent')
to automatically adjust the number of profile rows (buckets)
based on the profile's price range.
6. **Integrated Alerts:** Includes 13 alerts that trigger for:
- A new profile reset ('Profile was resetted').
- Price crossing any of the 6 developing levels (POC,
VA High/Low, VWAP, StdDev High/Low).
- **Alert Lag Assumption:** In 'Swing' mode, alerts are
delayed to match the retroactively plotted lines.
In 'Structure' and 'Delta' modes, alerts fire in
**real-time** based on the *current price* crossing
the *current (repainting)* value of the metric, which
may **differ from the non-repainting plotted line.**
**Caution: Real-Time Data Behavior (Intra-Bar Repainting)**
This indicator uses high-resolution intra-bar data. As a result, the
values on the **current, unclosed bar** (the real-time bar) will
update dynamically as new intra-bar data arrives. This includes
the values used for real-time alerts in 'Structure' and
'Delta' modes.
---
**DISCLAIMER**
1. **For Informational/Educational Use Only:** This indicator is
provided for informational and educational purposes only. It does
not constitute financial, investment, or trading advice, nor is
it a recommendation to buy or sell any asset.
2. **Use at Your Own Risk:** All trading decisions you make based on
the information or signals generated by this indicator are made
solely at your own risk.
3. **No Guarantee of Performance:** Past performance is not an
indicator of future results. The author makes no guarantee
regarding the accuracy of the signals or future profitability.
4. **No Liability:** The author shall not be held liable for any
financial losses or damages incurred directly or indirectly from
the use of this indicator.
5. **Signals Are Not Recommendations:** The alerts and visual signals
(e.g., crossovers) generated by this tool are not direct
recommendations to buy or sell. They are technical observations
for your own analysis and consideration.

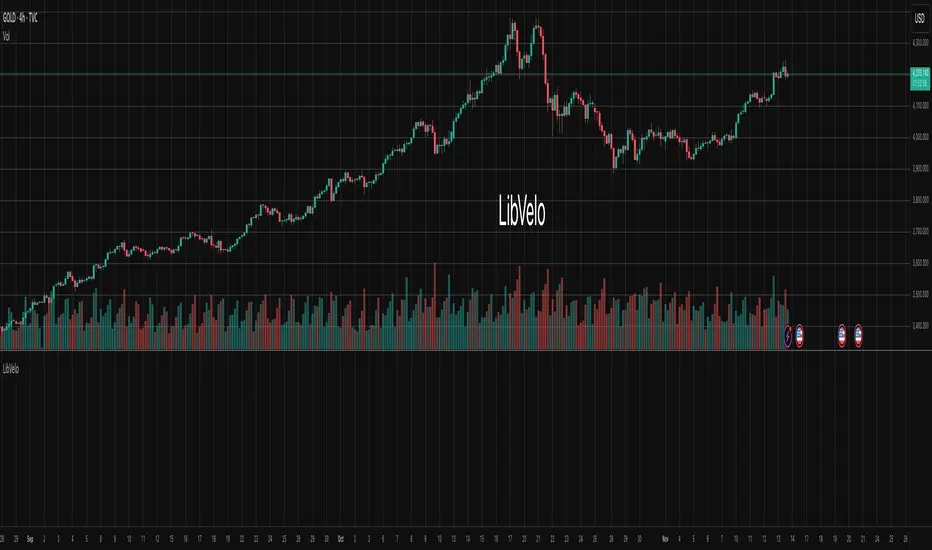
LibVeloLibrary "LibVelo"
This library provides a sophisticated framework for **Velocity
Profile (Flow Rate)** analysis. It measures the physical
speed of trading at specific price levels by relating volume
to the time spent at those levels.
## Core Concept: Market Velocity
Unlike Volume Profiles, which only answer "how much" traded,
Velocity Profiles answer "how fast" it traded.
It is calculated as:
`Velocity = Volume / Duration`
This metric (contracts per second) reveals hidden market
dynamics invisible to pure Volume or TPO profiles:
1. **High Velocity (Fast Flow):**
* **Aggression:** Initiative buyers/sellers hitting market
orders rapidly.
* **Liquidity Vacuum:** Price slips through a level because
order book depth is thin (low resistance).
2. **Low Velocity (Slow Flow):**
* **Absorption:** High volume but very slow price movement.
Indicates massive passive limit orders ("Icebergs").
* **Apathy:** Little volume over a long time. Lack of
interest from major participants.
## Architecture: Triple-Engine Composition
To ensure maximum performance while offering full statistical
depth for all metrics, this library utilises **object
composition** with a lazy evaluation strategy:
#### Engine A: The Master (`vpVol`)
* **Role:** Standard Volume Profile.
* **Purpose:** Maintains the "ground truth" of volume distribution,
price buckets, and ranges.
#### Engine B: The Time Container (`vpTime`)
* **Role:** specialized container for time duration (in ms).
* **Hack:** It repurposes standard volume arrays (specifically
`aBuy`) to accumulate time duration for each bucket.
#### Engine C: The Calculator (`vpVelo`)
* **Role:** Temporary scratchpad for derived metrics.
* **Purpose:** When complex statistics (like Value Area or Skewness)
are requested for **Velocity**, this engine is assembled
on-demand to leverage the full statistical power of `LibVPrf`
without rewriting complex algorithms.
---
**DISCLAIMER**
This library is provided "AS IS" and for informational and
educational purposes only. It does not constitute financial,
investment, or trading advice.
The author assumes no liability for any errors, inaccuracies,
or omissions in the code. Using this library to build
trading indicators or strategies is entirely at your own risk.
As a developer using this library, you are solely responsible
for the rigorous testing, validation, and performance of any
scripts you create based on these functions. The author shall
not be held liable for any financial losses incurred directly
or indirectly from the use of this library or any scripts
derived from it.
create(buckets, rangeUp, rangeLo, dynamic, valueArea, allot, estimator, cdfSteps, split, trendLen)
Construct a new `Velo` controller, initializing its engines.
Parameters:
buckets (int) : series int Number of price buckets ≥ 1.
rangeUp (float) : series float Upper price bound (absolute).
rangeLo (float) : series float Lower price bound (absolute).
dynamic (bool) : series bool Flag for dynamic adaption of profile ranges.
valueArea (int) : series int Percentage for Value Area (1..100).
allot (series AllotMode) : series AllotMode Allocation mode `Classic` or `PDF` (default `PDF`).
estimator (series PriceEst enum from AustrianTradingMachine/LibBrSt/1) : series PriceEst PDF model for distribution attribution (default `Uniform`).
cdfSteps (int) : series int Resolution for PDF integration (default 20).
split (series SplitMode) : series SplitMode Buy/Sell split for the master volume engine (default `Classic`).
trendLen (int) : series int Look‑back for trend factor in dynamic split (default 3).
Returns: Velo Freshly initialised velocity profile.
method clone(self)
Create a deep copy of the composite profile.
Namespace types: Velo
Parameters:
self (Velo) : Velo Profile object to copy.
Returns: Velo A completely independent clone.
method clear(self)
Reset all engines and accumulators.
Namespace types: Velo
Parameters:
self (Velo) : Velo Profile object to clear.
Returns: Velo Cleared profile (chaining).
method merge(self, srcVolBuy, srcVolSell, srcTime, srcRangeUp, srcRangeLo, srcVolCvd, srcVolCvdHi, srcVolCvdLo)
Merges external data (Volume and Time) into the current profile.
Automatically handles resizing and re-bucketing if ranges differ.
Namespace types: Velo
Parameters:
self (Velo) : Velo The profile object.
srcVolBuy (array) : array Source Buy Volume bucket array.
srcVolSell (array) : array Source Sell Volume bucket array.
srcTime (array) : array Source Time bucket array (ms).
srcRangeUp (float) : series float Upper price bound of the source data.
srcRangeLo (float) : series float Lower price bound of the source data.
srcVolCvd (float) : series float Source Volume CVD final value.
srcVolCvdHi (float) : series float Source Volume CVD High watermark.
srcVolCvdLo (float) : series float Source Volume CVD Low watermark.
Returns: Velo `self` (chaining).
method addBar(self, offset)
Main data ingestion. Distributes Volume and Time to buckets.
Namespace types: Velo
Parameters:
self (Velo) : Velo The profile object.
offset (int) : series int Offset of the bar to add (default 0).
Returns: Velo `self` (chaining).
method setBuckets(self, buckets)
Sets the number of buckets for the profile.
Namespace types: Velo
Parameters:
self (Velo) : Velo The profile object.
buckets (int) : series int New number of buckets.
Returns: Velo `self` (chaining).
method setRanges(self, rangeUp, rangeLo)
Sets the price range for the profile.
Namespace types: Velo
Parameters:
self (Velo) : Velo The profile object.
rangeUp (float) : series float New upper price bound.
rangeLo (float) : series float New lower price bound.
Returns: Velo `self` (chaining).
method setValueArea(self, va)
Set the percentage of volume/time for the Value Area.
Namespace types: Velo
Parameters:
self (Velo) : Velo The profile object.
va (int) : series int New Value Area percentage (0..100).
Returns: Velo `self` (chaining).
method getBuckets(self)
Returns the current number of buckets in the profile.
Namespace types: Velo
Parameters:
self (Velo) : Velo The profile object.
Returns: series int The number of buckets.
method getRanges(self)
Returns the current price range of the profile.
Namespace types: Velo
Parameters:
self (Velo) : Velo The profile object.
Returns:
rangeUp series float The upper price bound of the profile.
rangeLo series float The lower price bound of the profile.
method getArrayBuyVol(self)
Returns the internal raw data array for **Buy Volume** directly.
Namespace types: Velo
Parameters:
self (Velo) : Velo The profile object.
Returns: array The internal array for buy volume.
method getArraySellVol(self)
Returns the internal raw data array for **Sell Volume** directly.
Namespace types: Velo
Parameters:
self (Velo) : Velo The profile object.
Returns: array The internal array for sell volume.
method getArrayTime(self)
Returns the internal raw data array for **Time** (in ms) directly.
Namespace types: Velo
Parameters:
self (Velo) : Velo The profile object.
Returns: array The internal array for time duration.
method getArrayBuyVelo(self)
Returns the internal raw data array for **Buy Velocity** directly.
Automatically executes _assemble() if data is dirty.
Namespace types: Velo
Parameters:
self (Velo) : Velo The profile object.
Returns: array The internal array for buy velocity.
method getArraySellVelo(self)
Returns the internal raw data array for **Sell Velocity** directly.
Automatically executes _assemble() if data is dirty.
Namespace types: Velo
Parameters:
self (Velo) : Velo The profile object.
Returns: array The internal array for sell velocity.
method getBucketBuyVol(self, idx)
Returns the **Buy Volume** of a specific bucket.
Namespace types: Velo
Parameters:
self (Velo) : Velo The profile object.
idx (int) : series int The index of the bucket.
Returns: series float The buy volume.
method getBucketSellVol(self, idx)
Returns the **Sell Volume** of a specific bucket.
Namespace types: Velo
Parameters:
self (Velo) : Velo The profile object.
idx (int) : series int The index of the bucket.
Returns: series float The sell volume.
method getBucketTime(self, idx)
Returns the raw accumulated time (in ms) spent in a specific bucket.
Namespace types: Velo
Parameters:
self (Velo) : Velo The profile object.
idx (int) : series int The index of the bucket.
Returns: series float The time in milliseconds.
method getBucketBuyVelo(self, idx)
Returns the **Buy Velocity** (Aggressive Buy Flow) of a bucket.
Namespace types: Velo
Parameters:
self (Velo) : Velo The profile object.
idx (int) : series int The index of the bucket.
Returns: series float The buy velocity in .
method getBucketSellVelo(self, idx)
Returns the **Sell Velocity** (Aggressive Sell Flow) of a bucket.
Namespace types: Velo
Parameters:
self (Velo) : Velo The profile object.
idx (int) : series int The index of the bucket.
Returns: series float The sell velocity in .
method getBktBnds(self, idx)
Returns the price boundaries of a specific bucket.
Namespace types: Velo
Parameters:
self (Velo) : Velo The profile object.
idx (int) : series int The index of the bucket.
Returns:
up series float The upper price bound of the bucket.
lo series float The lower price bound of the bucket.
method getPoc(self, target)
Returns Point of Control (POC) information for the specified target metric.
Calculates on-demand if the target is 'Velocity' and data changed.
Namespace types: Velo
Parameters:
self (Velo) : Velo The profile object.
target (series Metric) : Metric The data aspect to analyse (Volume, Time, Velocity).
Returns:
pocIdx series int The index of the POC bucket.
pocPrice series float The mid-price of the POC bucket.
method getVA(self, target)
Returns Value Area (VA) information for the specified target metric.
Calculates on-demand if the target is 'Velocity' and data changed.
Namespace types: Velo
Parameters:
self (Velo) : Velo The profile object.
target (series Metric) : Metric The data aspect to analyse (Volume, Time, Velocity).
Returns:
vaUpIdx series int The index of the upper VA bucket.
vaUpPrice series float The upper price bound of the VA.
vaLoIdx series int The index of the lower VA bucket.
vaLoPrice series float The lower price bound of the VA.
method getMedian(self, target)
Returns the Median price for the specified target metric distribution.
Calculates on-demand if the target is 'Velocity' and data changed.
Namespace types: Velo
Parameters:
self (Velo) : Velo The profile object.
target (series Metric) : Metric The data aspect to analyse (Volume, Time, Velocity).
Returns:
medianIdx series int The index of the bucket containing the median.
medianPrice series float The median price.
method getAverage(self, target)
Returns the weighted average price (VWAP/TWAP) for the specified target.
Calculates on-demand if the target is 'Velocity' and data changed.
Namespace types: Velo
Parameters:
self (Velo) : Velo The profile object.
target (series Metric) : Metric The data aspect to analyse (Volume, Time, Velocity).
Returns:
avgIdx series int The index of the bucket containing the average.
avgPrice series float The weighted average price.
method getStdDev(self, target)
Returns the standard deviation for the specified target distribution.
Calculates on-demand if the target is 'Velocity' and data changed.
Namespace types: Velo
Parameters:
self (Velo) : Velo The profile object.
target (series Metric) : Metric The data aspect to analyse (Volume, Time, Velocity).
Returns: series float The standard deviation.
method getSkewness(self, target)
Returns the skewness for the specified target distribution.
Calculates on-demand if the target is 'Velocity' and data changed.
Namespace types: Velo
Parameters:
self (Velo) : Velo The profile object.
target (series Metric) : Metric The data aspect to analyse (Volume, Time, Velocity).
Returns: series float The skewness.
method getKurtosis(self, target)
Returns the excess kurtosis for the specified target distribution.
Calculates on-demand if the target is 'Velocity' and data changed.
Namespace types: Velo
Parameters:
self (Velo) : Velo The profile object.
target (series Metric) : Metric The data aspect to analyse (Volume, Time, Velocity).
Returns: series float The excess kurtosis.
method getSegments(self, target)
Returns the fundamental unimodal segments for the specified target metric.
Calculates on-demand if the target is 'Velocity' and data changed.
Namespace types: Velo
Parameters:
self (Velo) : Velo The profile object.
target (series Metric) : Metric The data aspect to analyse (Volume, Time, Velocity).
Returns: matrix A 2-column matrix where each row is an pair.
method getCvd(self, target)
Returns Cumulative Volume/Velo Delta (CVD) information for the target metric.
Namespace types: Velo
Parameters:
self (Velo) : Velo The profile object.
target (series Metric) : Metric The data aspect to analyse (Volume, Time, Velocity).
Returns:
cvd series float The final delta value.
cvdHi series float The historical high-water mark of the delta.
cvdLo series float The historical low-water mark of the delta.
Velo
Velo Composite Velocity Profile Controller.
Fields:
_vpVol (VPrf type from AustrianTradingMachine/LibVPrf/2) : LibVPrf.VPrf Engine A: Master Volume source.
_vpTime (VPrf type from AustrianTradingMachine/LibVPrf/2) : LibVPrf.VPrf Engine B: Time duration container (ms).
_vpVelo (VPrf type from AustrianTradingMachine/LibVPrf/2) : LibVPrf.VPrf Engine C: Scratchpad for velocity stats.
_aTime (array) : array Pointer alias to `vpTime.aBuy` (Time storage).
_valueArea (series float) : int Percentage of total volume to include in the Value Area (1..100)
_estimator (series PriceEst enum from AustrianTradingMachine/LibBrSt/1) : LibBrSt.PriceEst PDF model for distribution attribution.
_allot (series AllotMode) : AllotMode Attribution model (Classic or PDF).
_cdfSteps (series int) : int Integration resolution for PDF.
_isDirty (series bool) : bool Lazy evaluation flag for vpVelo.
RBD Market ProfileA Market Profile visually shows how much time (or how many bars) price spent at each price level within a session — helping identify areas of “fair value” (where price spent most time) and extremes (where price barely traded).
It divides each trading session (for example, a day, week, or month depending on input) into price segments, counts how many bars closed within each segment, and then identifies:
POC (Point of Control): price level with the highest frequency (most traded or visited).
VAH (Value Area High): upper boundary of the zone that contains 70% (or user-defined percentage) of all activity around the POC.
VAL (Value Area Low): lower boundary of that same 70% activity zone.
Finally, it plots lines for:
VAH (green line)
VAL (red line)
POC Upper & Lower (white lines)
Session Open (blue dashed line)
How to use this Market Profile:
Determine Key Areas of Support/Resistance by the VAH and VAL
VAH: Responsive Sellers and Initiative Buyers
VAL: Responsive Buyers and Initiative Sellers
POC: Can be used as Fair Value

Market Structure Volume ProfileThis indicator visualizes volume profiles that are dynamically anchored to market structure events, rather than fixed time intervals. It builds these profiles using high-resolution intra-bar data to provide a precise view of where value is established during critical market phases.
Key Features:
Event-Based Profile Anchoring: The indicator starts a new profile based on one of three user-selected events ('Profile Anchor'):
Swing: A new profile begins when the 'impulse baseline' (derived from intra-bar delta) changes. This baseline adjusts when a new price pivot is confirmed: When a price high forms, the baseline moves to the lower of its previous level or the peak delta (max of delta O/C) at the pivot. When a price low forms, it moves to the higher of its previous level or the trough delta (min of delta O/C) at the pivot.
Structure: A new profile begins immediately on the bar that confirms a market structure break (e.g., a new HH or LL, based on a sequence of price pivots).
Delta: A new profile begins immediately on the bar that confirms a break in the cumulative delta's market structure (e.g., a new HH or LL in the delta). Both 'Swing' and 'Delta' anchors are derived from the same continuous (non-resetting) Cumulative Volume Profile Delta (CVPD), which is built from the intra-bar statistical analysis.
Statistical Profile Engine: For each bar in the anchored period, the indicator builds a volume profile on a lower 'Intra-Bar Timeframe'. Instead of simple tick counting, it uses advanced statistical models:
Allocation ('Allot model'): 'PDF' (Probability Density Function) distributes volume proportionally across the bar's range based on an assumed statistical model (e.g., T4-Skew). 'Classic' assigns all volume to the close.
Buy/Sell Split ('Volume Estimator'): 'Dynamic' applies a model that analyzes candle wicks and recent trend to estimate buy/sell pressure. 'Classic' classifies all volume based on the candle color.
Visualization & Lag: The indicator plots the final profile (as a polygon) and the developing statistical lines (POC, VA, VWAP, StdDev).
Note on Lag: All anchor events require Pivot Right Bars for confirmation.
In 'Structure' and 'Delta' mode, the developing lines (POC, VA, etc.) are plotted using a non-repainting method (showing the value from pivRi bars ago).
In 'Swing' mode, the profile is plotted retroactively, starting from the bar where the pivot occurred. The developing lines are also plotted with this full pivRi lag to align with the past data.
Flexible Display Modes: The finalized profile can be displayed in three ways: 'Up/Down' (buy vs. sell), 'Total' (combined volume), and 'Delta' (net difference).
Dynamic Row Sizing: Includes an option ('Rows per Percent') to automatically adjust the number of profile rows (buckets) based on the profile's price range.
Integrated Alerts: Includes 13 alerts that trigger for:
A new profile reset ('Profile was resetted').
Price crossing any of the 6 developing levels (POC, VA High/Low, VWAP, StdDev High/Low).
Alert Lag Assumption: In 'Swing' mode, alerts are delayed to match the retroactively plotted lines. In 'Structure' and 'Delta' modes, alerts fire in real-time based on the current price crossing the current (repainting) value of the metric, which may differ from the non-repainting plotted line.
Caution: Real-Time Data Behavior (Intra-Bar Repainting) This indicator uses high-resolution intra-bar data. As a result, the values on the current, unclosed bar (the real-time bar) will update dynamically as new intra-bar data arrives. This includes the values used for real-time alerts in 'Structure' and 'Delta' modes.
DISCLAIMER
For Informational/Educational Use Only: This indicator is provided for informational and educational purposes only. It does not constitute financial, investment, or trading advice, nor is it a recommendation to buy or sell any asset.
Use at Your Own Risk: All trading decisions you make based on the information or signals generated by this indicator are made solely at your own risk.
No Guarantee of Performance: Past performance is not an indicator of future results. The author makes no guarantee regarding the accuracy of the signals or future profitability.
No Liability: The author shall not be held liable for any financial losses or damages incurred directly or indirectly from the use of this indicator.
Signals Are Not Recommendations: The alerts and visual signals (e.g., crossovers) generated by this tool are not direct recommendations to buy or sell. They are technical observations for your own analysis and consideration.

ICT Institutional Order Flow (Riz)This indicator implements Inner Circle Trader (ICT) institutional order flow concepts to identify high-probability entry points where smart money is actively participating in the market. It combines volume analysis, market structure, and price action patterns to detect institutional accumulation and distribution zones.
Core Concepts & Methodology
1. Institutional Order Blocks Detection
Order blocks represent the last opposing candle before a strong directional move, indicating institutional accumulation (bullish) or distribution (bearish) zones.
How it works:
⦁ Identifies the final bearish candle before bullish expansion (accumulation)
⦁ Identifies the final bullish candle before bearish expansion (distribution)
⦁ Validates with volume spike (2x average) to confirm institutional participation
⦁ Requires minimum 0.5% price displacement to filter weak moves
⦁ Tracks these zones as future support/resistance levels
2. Fair Value Gap (FVG) Analysis
FVGs are price inefficiencies created by aggressive institutional orders that leave gaps in price action.
Detection method:
⦁ Bullish FVG: When current low > high from 2 bars ago
⦁ Bearish FVG: When current high < low from 2 bars ago
⦁ Minimum gap size filter (0.1% default) eliminates noise
⦁ Monitors gap fills with volume for entry signals
⦁ Gaps act as magnets drawing price back for "rebalancing"
3. Liquidity Hunt Detection
Institutions often trigger retail stop losses before reversing direction, creating liquidity for their positions.
Algorithm:
⦁ Calculates rolling 20-period highs/lows as liquidity pools
⦁ Detects wicks beyond these levels (0.1% sensitivity)
⦁ Identifies rejection back inside range (liquidity grab)
⦁ Volume spike confirmation ensures institutional involvement
⦁ These reversals often mark significant turning points
4. Volume Profile Integration
Analyzes volume distribution across price levels to identify institutional interest zones.
Components:
⦁ Point of Control (POC): Price level with highest volume (institutional consensus)
⦁ Value Area: 70% of volume range (institutional comfort zone)
⦁ Uses 50-bar lookback to build volume histogram
⦁ 20 price levels for granular distribution analysis
5. Market Structure Analysis
Determines overall trend bias using pivot points and swing analysis.
Process:
⦁ Identifies swing highs/lows using 3-bar pivots
⦁ Bullish structure: Price above last swing high
⦁ Bearish structure: Price below last swing high
⦁ Filters signals to trade with institutional direction
Signal Generation Logic
BUY signals trigger when ANY condition is met:
1. Order Block Formation: Bearish-to-bullish transition + volume spike + strong move
2. Liquidity Grab Reversal: Sweep below lows + recovery + volume spike
3. FVG Fill: Price fills bullish gap with institutional volume (within 3 bars)
4. Order Block Respect: Price bounces from previous bullish OB + volume
SELL signals trigger when ANY condition is met:
1. Order Block Formation: Bullish-to-bearish transition + volume spike + strong move
2. Liquidity Grab Reversal: Sweep above highs + rejection + volume spike
3. FVG Fill: Price fills bearish gap with institutional volume (within 3 bars)
4. Order Block Respect: Price rejects from previous bearish OB + volume
Additional filters:
⦁ Signals align with market structure (no counter-trend trades)
⦁ No new signals while position is active
⦁ All signals require volume confirmation (institutional fingerprint)
Trading Style Auto-Configuration
The indicator features intelligent preset configurations for different trading styles:
Scalping Mode (1-5 min charts):
⦁ Volume multiplier: 1.5x (more signals)
⦁ Tighter parameters for quick trades
⦁ Risk:Reward 1.5:1, ATR multiplier 1.0
Day Trading Mode (15-30 min charts):
⦁ Volume multiplier: 1.7x (balanced)
⦁ Medium sensitivity settings
⦁ Risk:Reward 2:1, ATR multiplier 1.5
Swing Trading Mode (1H-4H charts):
⦁ Volume multiplier: 2.0x (quality focus)
⦁ Conservative parameters
⦁ Risk:Reward 3:1, ATR multiplier 2.0
Custom Mode:
⦁ Full manual control of all parameters
Visual Components
⦁ Order Blocks: Colored rectangles (green=bullish, red=bearish)
⦁ Fair Value Gaps: Orange boxes showing imbalances
⦁ Liquidity Levels: Dashed blue lines at key highs/lows
⦁ Volume Spikes: Yellow background highlighting
⦁ POC Line: Orange line showing highest volume price
⦁ Value Area: Blue shaded zone of 70% volume
⦁ Buy/Sell Signals: Triangle markers with text labels
⦁ Stop Loss/Take Profit: Dotted lines (red/green)
Information Panel
Real-time dashboard displaying:
⦁ Current trading mode
⦁ Volume ratio (current vs average)
⦁ Market structure (bullish/bearish)
⦁ Active order blocks count
⦁ Position status
⦁ Configuration details
How to Use
Step 1: Select Trading Style
Choose your style in settings - all parameters auto-adjust
Step 2: Timeframe Selection
⦁ Scalping: 1-5 minute charts
⦁ Day Trading: 15-30 minute charts
⦁ Swing: 1H-4H charts
Step 3: Signal Interpretation
⦁ Wait for BUY/SELL markers
⦁ Check volume ratio >2 for strong signals
⦁ Verify market structure alignment
⦁ Note automatic SL/TP levels
Step 4: Risk Management
⦁ Default 2:1 risk:reward (adjustable)
⦁ Stop loss: 1.5x ATR from entry
⦁ Position sizing based on stop distance
Best Practices
1. Higher probability setups occur when multiple conditions align
2. Volume confirmation is crucial - avoid signals without volume spikes
3. Trade with structure - longs in bullish, shorts in bearish structure
4. Monitor POC - acts as dynamic support/resistance
5. Confluence zones where OBs, FVGs, and liquidity levels overlap are strongest
Important Notes
⦁ Not a standalone system - combine with your analysis
⦁ Works best in trending markets with clear structure
⦁ Adjust settings based on instrument volatility
⦁ Backtest thoroughly on your specific markets
⦁ Past performance doesn't guarantee future results
Alerts Available
⦁ ICT Buy Signal
⦁ ICT Sell Signal
⦁ Volume Spike Detection
⦁ Liquidity Grab Detection
This indicator provides a systematic approach to ICT concepts, helping traders identify where institutions are entering positions through volume analysis and key price action patterns. The auto-configuration feature ensures optimal settings for your trading style without manual adjustment.
Disclaimer
This tool is for educational and research purposes only. It is not financial advice, nor does it guarantee profitability. All trading involves risk, and users should test thoroughly before applying live.

Extreme Zone Volume ProfileExtreme Zone Volume Profile (EZVP)
Originality & Innovation
The Extreme Zone Volume Profile (EZVP) revolutionizes traditional volume profile analysis by applying statistical zone classification to volume distribution. Unlike standard volume profiles that display raw volume data, EZVP segments the price range into statistically meaningful zones based on percentile thresholds, allowing traders to instantly identify where volume concentration suggests strong support/resistance versus areas of potential breakout.
Technical Methodology
Core Algorithm:
Distributes volume across user-defined bins (20-200) over a lookback period
Calculates volume-weighted price levels for each bin
Applies percentile-based zone classification to the price range (not volume ranking)
Zone B (extreme zones): Outer percentile tails representing potential rejection areas
Zone A (significant zones): Secondary percentile bands indicating strong interest levels
Center Zone: Bulk trading range where most price discovery occurs
Mathematical Foundation:
The script uses price-range percentiles rather than volume percentiles. If the total price range is divided into 100%, Zone B captures the extreme price tails (default 2.5% each end ≈ 2 standard deviations), Zone A captures the next significant bands (default 14% each ≈ 1 standard deviation), leaving the center for normal distribution trading.
Key Calculations:
POC (Point of Control): Price level with maximum volume accumulation
Volume-weighted mean price: Total volume × price / total volume
Median price: Geometric center of the price range
Rightward-projected bars: Volume bars extend forward from current time to avoid historical chart clutter
Trading Applications
Zone Interpretation:
Zone B (Red/Green): Extreme price levels where volume suggests strong rejection potential. Price reaching these zones often indicates overextension and possible reversal points.
Zone A (Orange/Teal): Significant support/resistance areas with substantial volume interest. These levels often act as intermediate targets or consolidation zones.
Center (Gray): Fair value area where most trading occurs. Price tends to return to this range during normal market conditions.
Strategic Usage:
Reversal Trading: Look for rejection signals when price enters Zone B areas
Breakout Confirmation: Volume expansion beyond Zone B boundaries suggests genuine breakouts
Support/Resistance: Zone A boundaries often provide reliable entry/exit levels
Mean Reversion: Price tends to gravitate toward the volume-weighted mean and POC lines
Unique Value Proposition
EZVP addresses three key limitations of traditional volume profiles:
Visual Clarity: Standard profiles can be cluttered and difficult to interpret quickly. EZVP's color-coded zones provide instant visual feedback about price significance.
Statistical Framework: Rather than relying on subjective interpretation of volume nodes, EZVP applies objective percentile-based classification, making support/resistance identification more systematic.
Forward-Looking Display: Rightward-projecting bars keep historical price action clean while maintaining current market structure visibility.
Configuration Guide
Lookback Period (10-1000): Controls the historical depth of volume calculation. Shorter periods for intraday scalping, longer for swing trading.
Number of Bins (20-200): Resolution of volume distribution. Higher values provide more granular analysis but may create noise on lower timeframes.
Zone Percentages:
Zone B: Extreme threshold (default 2.5% = ~2σ statistical significance)
Zone A: Significant threshold (default 14% = ~1σ statistical significance)
Visual Controls: Toggle individual elements (POC, median, mean, zone lines) to customize display complexity for your trading style.
Technical Requirements
Pine Script v6 compatible
Maximum bars back: 5000 (ensures sufficient historical data)
Maximum boxes: 500 (supports high-resolution bin counts)
Maximum lines: 50 (accommodates all zone and reference lines)
This indicator synthesizes volume profile theory with statistical zone analysis, providing a quantitative framework for identifying high-probability support/resistance levels based on volume distribution patterns rather than arbitrary price levels.

Zero Lag Liquidity [AlgoAlpha]🟠 OVERVIEW
This script plots liquidity zones with zero lag using lower-timeframe wick profiles and high-volume wicks to mark key price reactions. It’s called Zero Lag Liquidity because it captures significant liquidity imbalances in real time by processing lower-TF price-volume distributions directly inside the wick of abnormal candles. The tool builds a volume histogram inside long upper/lower wicks, then calculates a local Point of Control (POC) to mark the price where most volume occurred. These levels act as visual liquidity zones, which can trigger labels, break signals, and trend detection depending on price interaction.
🟠 CONCEPTS
The core concept relies on identifying high-volume candles with unusually long wicks—often a sign of opposing liquidity. When a large upper or lower wick appears with a strong volume spike, the script builds a histogram of lower-timeframe closes and volumes inside that wick. It bins the wick into segments, sums volume per bin, and finds the POC. This POC becomes the liquidity level. The script then dynamically tracks whether price breaks above or rejects off these levels, adjusts the active trend regime accordingly, and highlights bars to help users spot continuation or reversal behavior. The logic avoids repainting or subjective interpretation by using fixed thresholds and lower-TF price action.
🟠 FEATURES
Dynamic liquidity levels rendered at POC of significant wicks, colored by bullish/bearish direction.
Break detection that removes levels once price decisively crosses them twice in the same direction.
Rejection detection that plots ▲/▼ markers when price bounces off levels intrabar.
Volume labels for each level, shown either as raw volume or percentage of total level volume.
Candle coloring based on trend direction (break-dominant).
🟠 USAGE
Use this indicator to track where liquidity has most likely entered the market via abnormal wick events. When a long wick forms with high volume, the script looks inside it (using your chosen lower timeframe) and marks the most traded price within it. These levels can serve as expected reversal or breakout zones. Rejections are marked with small arrows, while breaks trigger trend shifts and remove the level. You can toggle trend coloring to see directional bias after a breakout. Use the wick multiplier to control how selective the detector is (higher = stricter). Alerts and label modes help customize the signal for different asset types and chart styles.

Volume Profile + VWAP + Long Wick StrategyVolume Profile + VWAP + Long Wick Strategy
This indicator combines Volume Profile (VP), VWAP (Volume Weighted Average Price) with deviation bands, and a long wick candle strategy to identify potential support/resistance zones and trading signals. It detects "power wicks" (long shadows with high volume near key levels like POC, VAH/VAL, or VWAP) as reversal setups, generating buy/sell alerts after confirmation wicks appear near these zones.
Key Features:
Volume Profile: Displays VP histogram over a lookback period, highlighting POC (Point of Control), VAH/VAL (Value Area High/Low) with customizable rows and thresholds.
VWAP & Bands: Plots VWAP with 1-3 std dev bands; filters signals based on trend and proximity to bands.
Long Wick Detection: Identifies strong ("power") and signal wicks based on wick/body ratios, ATR size, and volume multipliers. Supports Market Maker (MM) volume bonuses for liquidity zones.
Trading Signals: Generates BUY/SELL arrows when price retests wick levels with confirmation, limited by max signals per zone and min wait bars. Filtered by MTF (multi-timeframe) alignment (e.g., higher TF EMA trend and candle direction) and VWAP trend.
Sessions: Shows POC/VAH/VAL for Asian, London, and NY sessions with optional active-only display.
MTF Analysis: Scores bullish/bearish alignment across two higher timeframes for signal filtering.
Visuals: Liquidity sweep boxes, resistance/support lines, info table (levels, signals remaining, VWAP status), and MTF status box.
Customizable: Adjust wick ratios, volume thresholds, VP rows, MTF periods, and display options.
Ideal for intraday/scalping on forex/crypto/stocks. Use on lower TFs with MTF filters for confluence. Not financial advice—backtest thoroughly!

Ema With VoLume RangeEMA with Volume Range – Adaptive Trend, Trailing Stops & Volume Profile Zones
This sophisticated indicator integrates three powerful trading tools in a single overlay: a classic EMA200, precision ATR-based buy/sell signals, and a unique double-zone volume profile for deep market structure analysis. Ideal for swing traders, scalpers, and volume-driven investors seeking actionable, multi-dimensional price insights.
Core Features
EMA200 (Exponential Moving Average):
Plots a customizable EMA200 (blue line) for identifying primary trend direction and dynamic support/resistance.
Exponential smoothing is enabled by default for better tracking of recent price action.
ATR-Based Trailing Stop with Buy/Sell Signals:
Uses Average True Range (ATR) to set adaptive trailing stop levels that respond to current market volatility.
Buy and Sell signals (tiny green and red labels) trigger whenever price crosses the trailing stop for precise entries and exits.
All signals are alert-enabled for automated or semi-automated trading workflows.
Adjustable ATR multiplier and lookback for tuning responsiveness.
Dual Volume Range Zones & Profile Histogram:
Automatically highlights recent high/low price zones (upper and lower) using your lookback period and zone width settings.
Each zone is split into horizontal "bins," color-coded for buy/sell dominance and highlighting the Point of Control (POC)—the price with the most traded volume.
The indicator draws live volume histograms inside each zone, supplementing them with labels that show buy vs. sell volumes and POC statistics.
Adjustable bin count, transparency, colors, and histogram granularity to fit your visual preference.
Optional midlines and fair value drift line help visualize price equilibrium and value shifts over time.
How to Use
Trend Confirmation: Align trades with the EMA200—trade long above, short below, or wait for ATR-trailing stop triggers that coincide with the EMA bias.
Signal Generation: Use the ATR trailing stop Buy/Sell signals to spot shifts in volatility-adjusted direction early.
Volume Zone Analysis: Identify where the highest concentration of buy/sell activity occurred within the customizable upper/lower zones:
Use high volume bins and POC as magnets for price, support/resistance, or to confirm breakout/failure zones.
Leverage the fair value drift line and dynamic labels to detect changes in market sentiment and volume pressure.

Pro Reversal Strategie - FinalCore Functionality Description
The "Pro Reversal Strategy" script is a comprehensive and highly customizable trading system for TradingView. Its core idea is based on a mean-reversion strategy, which aims to capitalize on price extremes where the price is likely to revert to its statistical mean. This script ist full AI generated. There ist no support and no financial advice.
To identify entry points, the script combines classic indicators like the RSI (to detect overbought and oversold conditions) and Bollinger Bands (to measure volatility extremes).
However, the script's strength lies in its confluence logic: a simple RSI or Bollinger Band signal is not enough to trigger a trade. Instead, a series of filters are applied to enhance the quality of the trade signals. These include:
Trend Filter: Trades are only taken in the direction of the higher-level trend (defined by a 200-period Moving Average).
Volatility and Volume Filter: ADX and volume analysis ensure that the market has sufficient momentum for a move.
Market Structure Analysis: Concepts like Fair Value Gaps (FVG), liquidity zones, and the Volume Profile (VRVP/POC) are used to place trades in high-probability zones.
Momentum Filter: Special "Vector Candles" confirm the strength of buyers or sellers at the moment of the signal.
Furthermore, the script offers advanced features for risk and trade management, including automatic position sizing based on a percentage risk and dynamic exit strategies like a breakeven stop and a trailing stop-loss (Chandelier ATR).
A detailed info panel visualizes all key metrics in real-time directly on the chart. Thanks to its versatile configuration options, the script can be adapted for various trading styles, including swing trading, day trading, and scalping.
Core Strategies & Filters (English)
Here is a breakdown of the specific strategies and confirmation filters used within the script:
RSI Mean Reversion: Uses the Relative Strength Index (RSI) to identify overbought (> rsiSellShort) and oversold (< rsiBuyLong) conditions, which serve as the primary trigger for a potential price reversal.
Bollinger Bands (BB) Volatility Filter: Trades are confirmed when the price touches or exceeds the outer Bollinger Bands. This indicates a move to a statistical extreme in terms of volatility, reinforcing the reversal thesis.
Trend Filter (200 SMA): Ensures that long trades are only considered in a general uptrend (price > SMA 200) and short trades in a downtrend (price < SMA 200), preventing trades against the dominant market direction.
ADX Trend Strength Filter: Utilizes the Average Directional Index (ADX) to confirm that a market is trending with sufficient strength. Trades are filtered out during weak or non-trending phases (adx < adxThreshold).
Volume Profile (VRVP / POC): Analyzes volume at specific price levels to identify high-volume nodes (Point of Control - POC). This acts as a filter to avoid entering trades directly into a zone of strong support or resistance.
Vector Candle Filter: Identifies "Vector Candles" – large, high-volume candles that close strongly near their high (bullish) or low (bearish). This custom filter confirms strong conviction behind the initial reversal signal.
Market Structure (FVG & Liquidity): Incorporates advanced price action concepts. It looks for entries after a liquidity zone above a previous high/low has been tapped (Liquidity Grab) or when price enters a Fair Value Gap (FVG), adding a layer of institutional trading logic.
Chart Pattern Recognition: Optionally identifies classic chart patterns like "W-Patterns" (Double Bottom), "M-Patterns" (Double Top), and Ascending Triangles to provide additional visual confirmation for traders.
Position Sizing (Risk %): Automatically calculates the trade size based on a user-defined percentage of the total equity (riskPct) and the distance to the stop-loss, ensuring consistent risk management for every trade.
Dynamic Exit Management: Implements advanced exit strategies beyond a fixed take-profit. This includes moving the stop-loss to Breakeven after a certain risk-to-reward ratio is met and using a Trailing Stop-Loss (e.g., Chandelier ATR) to lock in profits as a trade develops.

Overnight Bias: Net Long/Short with PercentOvernight bias can assist with NY session gap fades or gap and go trading once the NY session is open.
Some general gap rules are:
1. Gap Direction Aligned with Overnight Bias
Rule: If the NY session gaps up and the overnight bias is Net Long (e.g., >60% of bars above the overnight open), favor longs.
Confirmation: Look for price to hold above overnight open or VWAP.
Invalidation: If price re-enters the overnight range, reassess.
2. Gap Opposing Overnight Bias (Contrarian Setup)
Rule: If the NY opens opposite the overnight bias, expect potential gap fill or reversal.
Trade Bias: Look for retracement back toward the overnight open or VWAP.
Example: Overnight was Net Long, but NY gaps down → wait for reclaim of VWAP to go long, else fade strength.
3. Gap Into Prior Day Value Area (VAH to VAL)
Rule: If the NY session gaps into the prior day value area:
It implies mean reversion behavior.
Expect price to rotate toward the POC (point of control).
Trade Bias: Fade toward POC if overnight bias is balanced or opposite the gap direction.
4. Gap Outside Prior Day Value Area
Rule: A gap above VAH or below VAL suggests potential breakout or new trend day.
Trade Bias: If overnight bias aligns (e.g., gap above VAH + Net Long overnight), consider trend continuation.
Invalidation: If price breaks back inside the prior day value area, watch for failed breakout → fade trade possible.
5. Gap Above Prior Day High / Below Prior Day Low
Rule: This is a true breakout gap.
Above Prior High + Net Long Bias: Look for continuation.
Below Prior Low + Net Short Bias: Look for sell pressure continuation.
Trade Bias: Use pullbacks to the prior high/low or overnight open for continuation setups.
6. Gap Within Prior Day Range
Rule: If the NY open is within the prior day’s high and low, expect chop or balanced conditions.
Trade Bias: Use overnight VWAP and prior POC as decision zones. Be cautious unless a breakout occurs.
7. Failed Gap and Re-entry into Prior Day Range
Rule: If price gaps above prior high but re-enters the prior range, it's a failed breakout.
Trade Bias: Look for a fade back to VAH or POC.
Confirmation: Watch for breakdown below overnight VWAP or failure to hold overnight open.
8. Gap + Overnight VWAP Divergence
Rule: If price gaps opposite the direction of VWAP (e.g., VWAP rising, gap down), wait for confirmation.
Trade Bias: Be cautious with early trades. Bias may flip if VWAP is reclaimed.
9. Gap + Overnight Open Test
Rule: If price opens with a gap and then retests the overnight open, that level becomes a decision zone.
Trade Bias:
Hold above = trend continuation.
Rejection = gap fill or reversal.
10. Unfilled Gap = Trend Bias
Rule: If the gap remains unfilled for the first 30–60 minutes, it increases the odds of a trend day.
Trade Bias: Trade pullbacks in the direction of the gap and overnight bias.
Should anyone have suggestion to add please do so.

volume profile ranking indicator📌 Introduction
This script implements a volume profile ranking indicato for TradingView. It is designed to visualize the distribution of traded volume over price levels within a defined historical window. Unlike TradingView’s built-in Volume Profile, this script gives full customization of the profile drawing logic, binning, color gradient, and the ability to anchor the profile to a specific date.
⚙️ How It Works (Logic)
1. Inputs
➤POC Lookback Days (lookback): Defines how many bars (days) to look back from a selected point to calculate the volume distribution.
➤Bin Count (bin_count): Determines how many price bins (horizontal levels) the price range will be divided into.
➤Use Custom Lookback Date (useCustomDate): Enables/disables manually selecting a backtest start date.
➤Custom Lookback Date (customDate): When enabled, the profile will calculate volume based on this date instead of the most recent bar.
2. Target Bar Determination
➤If a custom date is selected, the script searches for the bar closest to that date within 1000 bars.
➤If not, it defaults to the latest bar (bar_index).
➤The profile is drawn only when the current bar is close to the target bar (within ±2 bars), to avoid unnecessary recalculations and performance issues.
3. Volume Binning
➤The price range over the lookback window is divided into bin_count segments.
➤For each bar within the lookback window, its volume is added to the appropriate bin based on price.
➤If the price falls outside the expected range, it is clamped to the first or last bin.
4. Ranking and Sorting
➤A bubble sort ranks each bin by total volume.
➤The most active bin (POC, or Point of Control) is highlighted with a thicker bar.
5. Rendering
➤Horizontal bars (line.new) represent volume intensity in each price bin.
➤Each bar is color-coded by volume heat: more volume = more intense color.
➤Labels (label.new) show:
➤Total volume
➤Rank
➤Percentage of total volume
➤Price range of the bin
🧑💻 How to Use
1. Add the Script to Your Chart
➤Copy the code into TradingView’s Pine Script editor and add it to your chart.
2. Set Lookback Period
➤Default is 252 bars (about one year for daily charts), but can be changed via the input.
3. (Optional) Use Custom Date
●Toggle "Use Custom Lookback Date" to true.
➤Pick a date in the "Custom Lookback Date" input to anchor the profile.
4. Analyze the Volume Distribution
➤The longest (thickest) red/orange bar represents the Point of Control (POC) — the price with the most volume traded.
➤Other bars show volume distribution across price.
➤Labels display useful metrics to evaluate areas of high/low interest.
✅ Features
🔶 Customizable anchor point (custom date).
🔶Adjustable bin count and lookback length.
🔶 Clear visualization with heatmap coloring.
🔶 Lightweight and performance-optimized (especially with the shouldDrawProfile filter)

Volatility Footprint CandlesVolatility Footprint is an innovative volume profile indicator that dynamically adapts to real-time market conditions, providing traders with a powerful tool to visualize and interpret market structure, order flow, and potential areas of support and resistance.
At its core, Volatility Footprint combines the concepts of market profile, volume analysis, and volatility measurement to create a unique and adaptive charting experience. The indicator intelligently adjusts its display based on the current market volatility, ensuring that traders always have a clear and readable chart, regardless of the instrument or timeframe they are analyzing.
The footprint chart is composed of a series of color-coded boxes, each representing a specific price level. The color of the box indicates whether there is a net buying or selling pressure at that level, while the opacity reflects the relative strength of the volume. This intuitive visualization allows traders to quickly identify areas of high and low volume, as well as potential imbalances in order flow.
In addition to the individual box volumes, Volatility Footprint also calculates and displays the cumulative volume delta. This running total of buy and sell volumes across all price levels provides valuable insight into the overall market sentiment and potential trends.
One of the key features of Volatility Footprint is its ability to identify and highlight the Point of Control (POC). The POC represents the price level with the highest volume concentration and serves as a key reference point for potential support or resistance. By drawing attention to this crucial level, the indicator helps traders make more informed decisions about potential entry and exit points.
Volatility Footprint is designed to be highly customizable, allowing traders to tailor the appearance of the footprint chart to their specific preferences. Users can easily modify the colors, opacity, and size of the boxes, labels, and POC marker to enhance readability and clarity.
The indicator's versatility makes it suitable for a wide range of trading styles and strategies. Whether you are a scalper looking for short-term opportunities or a swing trader aiming to identify potential trend reversals, Volatility Footprint can provide valuable insights into market dynamics.
By combining Volatility Footprint with other forms of analysis, such as price action, key levels, and technical indicators, traders can gain a more comprehensive understanding of market behavior and make better-informed trading decisions.
Volatility Footprint's adaptive approach to volume profile analysis sets it apart from traditional fixed-resolution volume profile indicators. By dynamically adjusting to the unique characteristics of each instrument and timeframe, the indicator ensures that traders always have a clear and meaningful representation of market structure and order flow.
Volatility Footprint is a powerful tool that traders can incorporate into their market analysis and decision-making process. By providing a dynamic, visual representation of volume and order flow at different price levels, this indicator offers valuable insights into market structure, sentiment, and potential areas of support and resistance. Let's explore how traders might effectively utilize Volatility Footprint in their trading approach.
1. Identifying Key Levels:
One of the primary uses of Volatility Footprint is to identify key price levels where significant trading activity has occurred. The color-coded boxes allow traders to quickly spot areas of high volume concentration, which may indicate potential support or resistance zones. For example, if a trader notices a cluster of boxes with high opacity at a specific price level, they may interpret this as a strong support or resistance area, depending on the prevailing market context. By paying attention to these key levels, traders can make more informed decisions about potential entry and exit points, as well as placement of stop-loss orders and profit targets.
2. Assessing Market Sentiment:
The cumulative volume delta feature of Volatility Footprint provides traders with a valuable gauge of overall market sentiment. By analyzing the running total of buy and sell volumes across all price levels, traders can gain insight into the dominant market forces at play. If the cumulative delta is significantly positive, it may suggest a bullish sentiment, as buying pressure has been consistently outpacing selling pressure. Conversely, a negative cumulative delta may indicate a bearish sentiment. Traders can use this information to confirm or question their bias and adjust their trading plan accordingly.
3. Confirming Breakouts and Trend Reversals:
Volatility Footprint can be particularly useful in confirming the strength and validity of breakouts and potential trend reversals. When a price level is breached, traders can refer to the footprint chart to assess the volume and order flow characteristics around that level. If the breakout is accompanied by a surge in volume and a clear imbalance between buying and selling pressure, it may suggest a strong and sustainable move. On the other hand, if the volume is relatively low or evenly distributed, the breakout may be less reliable. By using Volatility Footprint to confirm breakouts, traders can make more informed decisions about whether to enter or exit a trade, or to adjust their position size.
4. Detecting Imbalances and Potential Reversals:
Imbalances between buying and selling pressure at specific price levels can often precede significant market moves or reversals. Volatility Footprint makes it easy for traders to spot these imbalances visually. For instance, if a trader observes a price level with a significantly larger number of sell boxes compared to buy boxes, it may indicate a potential exhaustion point for a bullish trend, and a reversal might be imminent. Traders can use this information in conjunction with other technical analysis tools, such as trendlines, moving averages, or momentum oscillators, to identify high-probability trading opportunities.
5. Adapting to Market Conditions:
One of the key strengths of Volatility Footprint is its ability to dynamically adapt to the unique volatility characteristics of different instruments and timeframes. This adaptability ensures that the indicator remains relevant and informative across a wide range of market conditions. Traders can use Volatility Footprint to gauge the relative volatility and volume of a particular instrument or timeframe, and adjust their trading approach accordingly. For example, in a highly volatile market, traders may opt for wider stop-loss levels and smaller position sizes to account for the increased risk.
Incorporating Volatility Footprint into a trading strategy requires a combination of technical analysis, market understanding, and risk management. Traders should use this indicator as part of a comprehensive approach, combining it with other forms of analysis, such as price action, key levels, and technical indicators. By doing so, traders can gain a more complete picture of market dynamics and make better-informed trading decisions.
It's important to note that while Volatility Footprint provides valuable insights, it should not be relied upon as a standalone trading signal. Traders should always consider the broader market context, their risk tolerance, and their overall trading plan when making decisions based on the information provided by this indicator.
In conclusion, Volatility Footprint offers traders a dynamic and visually intuitive way to analyze market structure, volume, and order flow. By identifying key levels, assessing market sentiment, confirming breakouts, detecting imbalances, and adapting to market conditions, traders can leverage this powerful tool to make more informed and confident trading decisions. As with any technical analysis tool, Volatility Footprint should be used in conjunction with sound risk management principles and a well-defined trading strategy to maximize its effectiveness.

Support and ResistanceThis indicator, titled "Support and Resistance," is designed to identify and display key price levels based on volume and pivot points. It's a versatile tool that can be adapted for different market views and timeframes.
Key Features
Market View Options
The indicator offers three market view settings:
Short term
Standard
Long term
These settings affect the lookback periods used in calculations, allowing users to adjust the indicator's sensitivity to market movements.
Volume-Based Levels
The indicator calculates support and resistance levels using a rolling Point of Control (POC) derived from volume data. This approach helps identify price levels where the most trading activity has occurred.
Pivot Points
In addition to volume-based levels, the indicator incorporates pivot points to identify potential support and resistance areas.
Customizable Appearance
Users can adjust:
Number of lines to display (1-8)
Colors for support and resistance levels
Line thickness based on level importance
Calculation Methods
Rolling POC
The indicator uses a custom function f_rolling_poc to calculate the rolling Point of Control. This function analyzes volume distribution across price levels within a specified lookback period.
Pivot Points
Both standard and quick pivot points are calculated using the rolling POC as input, rather than traditional price data.
Level Importance
The indicator assigns importance to each level based on:
Number of touches (how often price has interacted with the level)
Duration (how long the level has been relevant)
This importance score determines the thickness of the displayed lines.
Unique Aspects
Dynamic Line Thickness: Lines become thicker when levels overlap, highlighting potentially stronger support/resistance areas.
Adaptive Coloring: The color of each line changes dynamically based on whether the current price is above or below the level, indicating whether it's acting as support or resistance.
Flexible Time Frames: The market view options allow the indicator to be easily adapted for different trading styles and timeframes.
Potential Uses
This indicator could be valuable for:
Identifying key price levels for entry and exit points
Recognizing potential breakout or breakdown levels
Understanding the strength of support and resistance based on line thickness
Adapting analysis to different market conditions and timeframes
Overall, this "Support and Resistance" indicator offers a sophisticated approach to identifying key price levels, combining volume analysis with pivot points and providing visual cues for level importance and current market position.
This Support and Resistance indicator is provided for informational and educational purposes only. It should not be considered as financial advice or a recommendation to buy or sell any security. The indicator's calculations are based on historical data and may not accurately predict future market movements. Trading decisions should be made after thorough research and consultation with a licensed financial advisor. The creator of this indicator is not responsible for any losses incurred from its use. Past performance does not guarantee future results. Use at your own risk.
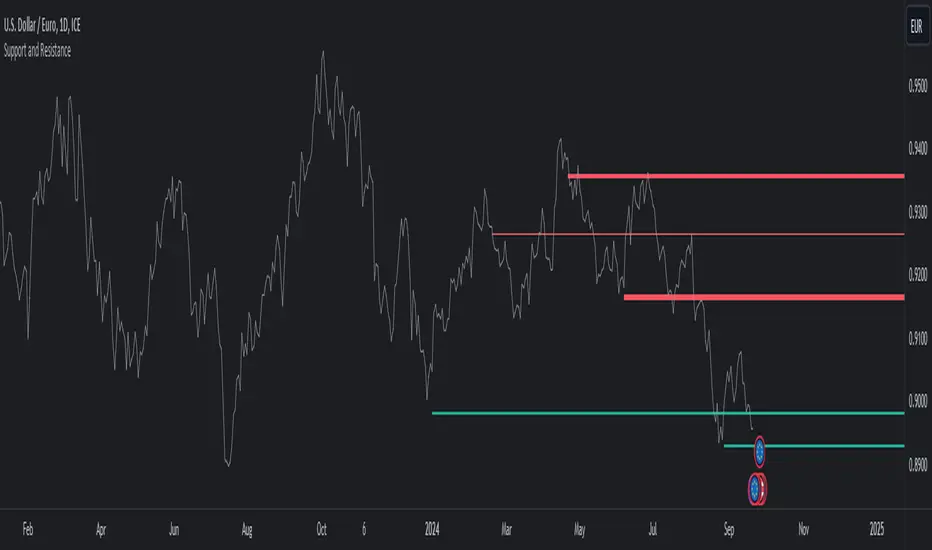
Volume Profile [projeadam]Volume Profile Indicator
OVERVIEW
The "Volume Profile " indicator is designed to analyze and visualize the volume distribution within a specified number of past bars on the TradingView platform. This tool helps traders to identify key levels of volume activity, which can indicate significant support and resistance zones.
USER GUIDE
The primary purpose of this indicator is to provide a detailed volume profile over a specified range of bars. It highlights areas of high and low trading activity, enabling traders to make more informed decisions based on historical volume data.
SETTINGS PANEL
🌟 Indicator Settings 🌟
1. Back Bars Value :
o Description: Sets the number of past bars to be considered for volume profile calculation.
o Default Value: 43
o Range: 1 to 500
2. Value Area Volume %:
o Description: Specifies the percentage of total volume to be included in the value area.
o Default Value: 50%
o Range: 1% to 100%
🪐 Histogram Settings 🪐
1. Show Histogram:
o Description: Toggles the display of the volume histogram on the chart.
o Default: Enabled
2. Right Or Left Side Histogram:
o Description: Allows the user to choose the position of the histogram on the chart (right or left side).
o Default: Left Side
3. Number of Histogram Branches:
o Description: Sets the number of segments or branches in the histogram.
o Default Value: 50
4. Value Area BUY Color:
o Description: Sets the color for the histogram bars indicating buying volume areas.
o Default: Green (#73ff21 with 15% opacity)
5. Value Area SELL Color:
o Description: Sets the color for the histogram bars indicating selling volume areas.
o Default: Red (#ff2828 with 15% opacity)
🎯 Lines Settings 🎯
1. Show Lines:
o Description: Toggles the display of horizontal lines representing key volume levels.
o Default: Enabled
2. Show Labels:
o Description: Toggles the display of labels for the horizontal lines.
o Default: Enabled
3. High Level Line:
o Show Line: Enables the high volume level line.
o Line Style: Options for solid, dotted, or dashed lines.
o Line Width: Adjustable from 1 to 5.
o Line Color: Customizable color for the high level line.
4. Middle Level Line (POC Line):
o Show Line: Enables the Point of Control (POC) line.
o Line Style: Options for solid, dotted, or dashed lines.
o Line Width: Adjustable from 1 to 5.
o Line Color: Customizable color for the POC line.
5. Low Level Line:
o Show Line: Enables the low volume level line.
o Line Style: Options for solid, dotted, or dashed lines.
o Line Width: Adjustable from 1 to 5.
o Line Color: Customizable color for the low level line.
Visualization
- Histogram Positioning: The histogram can be displayed on either the right or left side of the chart, providing flexibility based on user preference.
- Line and Label Customization: Users can customize the style, width, and color of the lines and labels to match their trading style and charting preferences.
ALARMS
This indicator can trigger alarms based on significant price movements relative to the identified volume levels:
- Break High Level: An alarm is triggered when the price crosses above the high volume level.
- Break Low Level: An alarm is triggered when the price crosses below the low volume level.
ALGORITHM
The indicator calculates the highest and lowest prices within the specified number of past bars and divides the price range into segments. It then allocates the volume within each segment, distinguishing between buying and selling volumes. The key volume levels (Point of Control, High Volume Node, and Low Volume Node) are identified and highlighted on the chart.
Example
In the example below, the histogram is displayed on the left side, showing higher buying volumes in green and selling volumes in red. The key volume levels are marked with horizontal lines and labels, providing clear visual cues for significant support and resistance zones.
BENEFITS
- Enhanced Market Insight: Provides a detailed view of volume distribution, highlighting key trading levels.
- Customizable Visualization: Flexible settings allow traders to customize the indicator to their needs.
- Alert Mechanism: Automated alarms keep traders informed of significant market movements in real-time.
ADDITIONAL FEATURES
If you have suggestions for additional features or improvements, please feel free to reach out.

Depth of Market (DOM) [LuxAlgo]The Depth Of Market (DOM) tool allows traders to look under the hood of any market, taking price and volume analysis to the next level. The following features are included: DOM, Time & Sales, Volume Profile, Depth of Market, Imbalances, Buying Pressure, and up to 24 key intraday levels (it really packs a punch).
As a disclaimer, this tool does not use tick data, it is a DOM reconstruction from the provided real-time time series data (price and volume). So the volume you see is from filled orders only, this tool does not show unfilled limit orders.
Traders can enable or disable any of the features at will to avoid being overwhelmed with too much information and to make the tool perform faster.
The features that have the biggest impact on performance are Historical Data Collection, Key Levels (POC & VWAP), Time & Sales, Profile, and Imbalances. Disable these features to improve the indicator computational performance.
🔶 DOM
This is the simplest form of the tool, a simple DOM or ladder that displays the following columns:
PRICE: Price level
BID: Total number of market sell orders filled or limit buy orders filled.
SELL: Sell market orders
BUY: Buy market orders
ASK: Total number of market buy orders filled or limit sell orders filled.
The DOM only collects historical data from the last 24 hours and real-time data.
Traders can select a reset period for the DOM with two options:
DAILY: Resets at the beginning of each trading day
SESSIONS: Resets twice, as DAILY and 15.5 hours later, to coincide with the start of the RTH session for US tickers.
The DOM has two main modes, it can display price levels as ticks or points. The default is automatic based on the current daily volatility, but traders can manually force one mode or the other if they wish.
For convenience, traders have the option to set the number of lines (price levels), and the size of the text and to display only real-time data.
By default, the top price is set to 0 so that the DOM automatically adjusts the price levels to be displayed, but traders can set the top price manually so that the tool displays only the desired price levels in a fixed manner.
🔹 Volume Profile
As additional features to the basic DOM, traders have access to the volume profile histogram and the total volume per price level.
This helps traders identify at a glance key price areas where volume is accumulating (high volume nodes) or areas where volume is lacking (low volume nodes) - these areas are important to some traders who base their decision-making process on them.
🔹 Imbalances
Other added features are imbalances and buying pressure:
Interlevel Imbalance: volume delta between two different price levels
Intralevel Imbalance: delta between buy and sell volume at the same price level
Buying Pressure Percent: percentage of buy volume compared to total volume
Imbalances can help traders identify areas of interest in the price for possible support or resistance.
🔹 Depth
Depth allows traders to see at a glance how much supply is above the current price level or how much demand is below the current price level.
Above the current price level shows the cumulative ask volume (filled sell limit orders) and below the current price level shows the cumulative bid volume (filled buy limit orders).
🔶 KEY LEVELS
The tool includes up to 24 different key intraday levels of particular relevance:
Previous Week Levels
PWH: Previous week high
PWL: Previous week low
PWM: Previous week middle
PWS: Previous week settlement (close)
Previous Day Levels
PDH: Previous day high
PDL: Previous day low
PDM: Previous day middle
PDS: Previous day settlement (close)
Current Day Levels
OPEN: Open of day (or session)
HOD: High of day (or session)
LOD: Low of day (or session)
MOD: Middle of day (or session)
Opening Range
ORH: Open range high
ORL: Open range low
Initial Balance
IBH: Initial balance high
IBL: Initial balance low
VWAP
+3SD: Volume weighted average price plus 3 standard deviations
+2SD: Volume weighted average price plus 2 standard deviations
+1SD: Volume weighted average price plus 1 standard deviation
VWAP: Volume weighted average price
-1SD: Volume weighted average price minus 1 standard deviation
-2SD: Volume weighted average price minus 2 standard deviations
-3SD: Volume weighted average price minus 3 standard deviations
POC: Point of control
Different traders look at different levels, the key levels shown here are objective and specific areas of interest that traders can act on, providing us with potential areas of support or resistance in the price.
🔶 TIME & SALES
The tool also features a full-time and sales panel with time, price, and size columns, a size filter, and the ability to set the timezone to display time in the trader's local time.
The information shown here is what feeds the DOM and it can be useful in several ways, for example in detecting absorption. If a large number of orders are coming into the market but the price is barely moving, this indicates that there is enough liquidity at these levels to absorb all these orders, so if these orders stop coming into the market, the price may turn around.
🔶 SETTINGS
Period: Select the anchoring period to start data collection, DAILY will anchor at the start of the trading day, and SESSIONS will start as DAILY and 15.5 hours later (RTH for US tickers).
Mode: Select between AUTO and MANUAL modes for displaying TICKS or POINTS, in AUTO mode the tool will automatically select TICKS for tickers with a daily average volatility below 5000 ticks and POINTS for the rest of the tickers.
Rows: Select the number of price levels to display
Text Size: Select the text size
🔹 DOM
DOM: Enable/Disable DOM display
Realtime only: Enable/Disable real-time data only, historical data will be collected if disabled
Top Price: Specify the price to be displayed on the top row, set to 0 to enable dynamic DOM
Max updates: Specify how many times the values on the SELL and BUY columns are accumulated until reset.
Profile/Depth size: Maximum size of the histograms on the PROFILE and DEPTH columns.
Profile: Enable/Disable Profile column. High impact on performance.
Volume: Enable/Disable Volume column. Total volume traded at price level.
Interlevel Imbalance: Enable/Disable Interlevel Imbalance column. Total volume delta between the current price level and the price level above. High impact on performance.
Depth: Enable/Disable Depth, showing the cumulative supply above the current price and the cumulative demand below. Impact on performance.
Intralevel Imbalance: Enable/Disable Intralevel Imbalance column. Delta between total buy volume and total sell volume. High impact on performance.
Buying Pressure Percent: Enable/Disable Buy Percent column. Percentage of total buy volume compared to total volume.
Imbalance Threshold %: Threshold for highlighting imbalances. Set to 90 to highlight the top 10% of interlevel imbalances and the top and bottom 10% of intra-level imbalances.
Crypto volume precision: Specify the number of decimals to display on the volume of crypto assets
🔹 Key Levels
Key Levels: Enable/Disable KEY column. Very high performance impact.
Previous Week: Enable/Disable High, Low, Middle, and Close of the previous trading week.
Previous Day: Enable/Disable High, Low, Middle, and Settlement of the previous trading day.
Current Day/Session: Enable/Disable Open, High, Low and Middle of the current period.
Open Range: Enable/Disable High and Low of the first candle of the period.
Initial Balance: Enable/Disable High and Low of the first hour of the period.
VWAP: Enable/Disable Volume-weighted average price of the period with 1, 2, and 3 standard deviations.
POC: Enable/Disable Point of Control (price level with the highest volume traded) of the period.
🔹 Time & Sales
Time & Sales: Enable/Disable time and sales panel.
Timezone offset (hours): Enter your time zone\'s offset (+ or −), including a decimal fraction if needed.
Order Size: Set order size filter. Orders smaller than the value are not displayed.
🔶 THANKS
Hi, I'm makit0 coder of this tool and proud member of the LuxAlgo Opensource team, it's an honor to be part of the LuxAlgo family doing something I love as it's writing opensource code and sharing it with the world. I'd like to thank all of you who use, comment on, and vote for all of our open-source tools, and all of you who give us your support.
And of course thanks to the PineCoders family for all the work in front of and behind the scenes that makes the PineScript community what it is, simply the best.
Peace, Love & PineScript!

Price-Volume Dynamic - Strategy [presentTrading]█ Introduction and How it is Different
The "Price-Volume Dynamic - Strategy" leverages a unique blend of price action, volume analysis, and statistical z-scores to establish trading positions. This approach differentiates itself by integrating the concept of the Point of Control (POC) from volume profile analysis with price-based z-score indicators to create a dynamic trading strategy. It tailors entry and exit thresholds based on current market volatility, providing a responsive and adaptive trading method. This strategy stands out by considering both historical volatility and price trends to adjust trading decisions in real-time, enhancing its effectiveness in various market conditions.
BTCUSD 4h LS Performance
█ Strategy: How It Works – Detailed Explanation
🔶 Calculating Point of Control (POC)
The Point of Control (POC) represents the price level with the highest traded volume over a specified lookback period. It's calculated by dividing the price range into a number of rows, each representing a price level. The volume at each price level is tallied and the level with the maximum volume is designated as the POC.
🔶 Dynamic Thresholds Adjustments
The entry and exit thresholds are dynamically adjusted based on normalized volatility, which is derived from the current, minimum, and maximum ATR over a specified period. This normalization ensures that the thresholds adapt to changes in market conditions, making the strategy sensitive to shifts in market volatility.
BTCUSD local performance
█ Trade Direction
The strategy can be configured to trade in three different directions: Long, Short, or Both. This flexibility allows traders to align their trading strategy with their market outlook or risk preferences. By adjusting the `POC_tradeDirection` input, traders can selectively participate in market movements that match their trading style and objectives.
█ Usage
To deploy this strategy, traders should apply it within a trading software that supports scripting and backtesting, such as TradingView's Pine Script environment. Users can input their parameters based on their analysis of the market conditions and their risk tolerance. It is essential for traders to backtest the strategy using historical data to evaluate its performance and make necessary adjustments before applying it in live trading scenarios.
█ Default Settings
- Lookback Length: Sets the period over which the highest and lowest prices, and the volume per price level, are calculated. A higher lookback length smoothens the volatility but may delay response to recent market movements.
- Number of Rows: Determines the granularity of price levels within the price range. More rows provide a more detailed volume profile but require more computational resources.
- Entry Z-Score Threshold Base: Influences the sensitivity of the strategy to enter trades. Higher values make the strategy more conservative, requiring stronger deviation from the mean to trigger a trade.
- Exit Z-Score Threshold Base: Sets the threshold for exiting trades, with lower values allowing trades to close on smaller price retractions, thereby potentially preserving profits or reducing losses.
- Trading Direction: Allows selection between Long, Short, or Both, enabling traders to tailor the strategy to their market view or risk preferences.
