IMR DAILY FIBGREETINGS TRADERS !!!
TRADE in trend
with support & resistence of fibonachi pivot of daily
usefull for each & every script
built in ema crossovers for safe traders
specialy used for intraday (1-2-3-5 min timeframe )& swing trades SIMPEL & HANDY INDICATOR
tried to kept the function of indicatoer very easy & user freindly
plz use & share your feedback
ENJOY LIKE & SHARE TO OTHERS !!!!
ค้นหาในสคริปต์สำหรับ "pivot"

Dynamic Price ChannelsThis indicator plots dynamic price channels based on the security highest close and lowest open.
The default is to display 8 core channels (with the option to plot the sub channel lines, off by default).
It’s simple really—this just divides the price action into equal channels. I’ve found this pattern helpful across all markets.
It’s dynamic because if a new high close or a new low close is created the all channels will adjust.
The key levels are 75% (blue), 50% (aqua), 25% (blue).
In between those key levels is a level separator.
The high close and the low open are both red.
These can all be customized in the settings.
What you’ll typically see at these channel boundaries are price slow downs, reversals, support and resistance.
Turning on sub-channels will provide further channel plots. On these sub-channels you’ll also see the same type of price action activity as mentioned above.
I’ve developed a trading system where this indicator helps identify key pivot areas. Combined with a few other indicators and key EMAs this trade system provides high probability trades around these key channel areas.

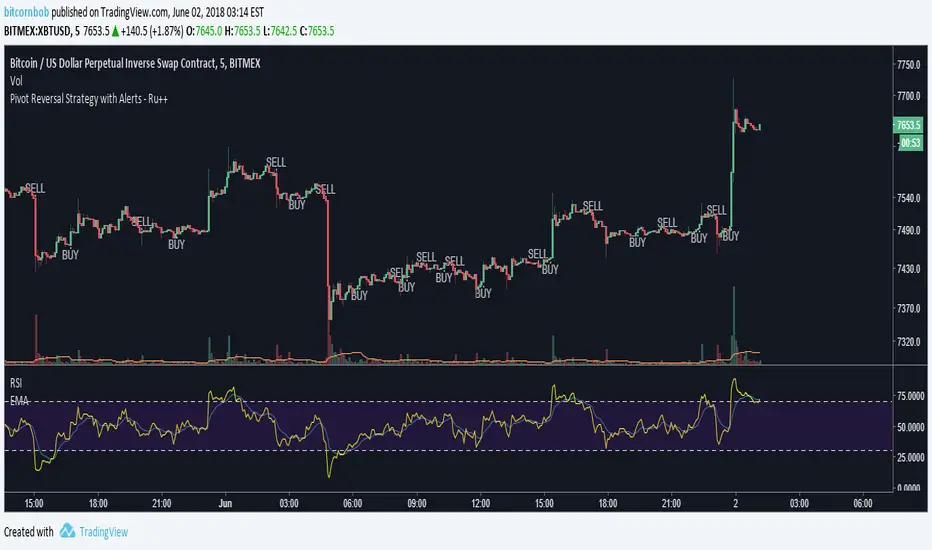
Pivot Reversal Strategy with Alerts - Ru++changing from blue to white for better visibility on dark theme
On Balance True Range and Kalman FilterThis is a modification of On Balance True Range where the plot is made on the chart based on VWAP. Getting the previous day values of this logic is useful in determining the major pivot points during the day. The intra day VWAP is also plotted to know if the price is being traded above or below the average price.
The script also has a Kalman Filter based moving average that acts as a short term moving average.

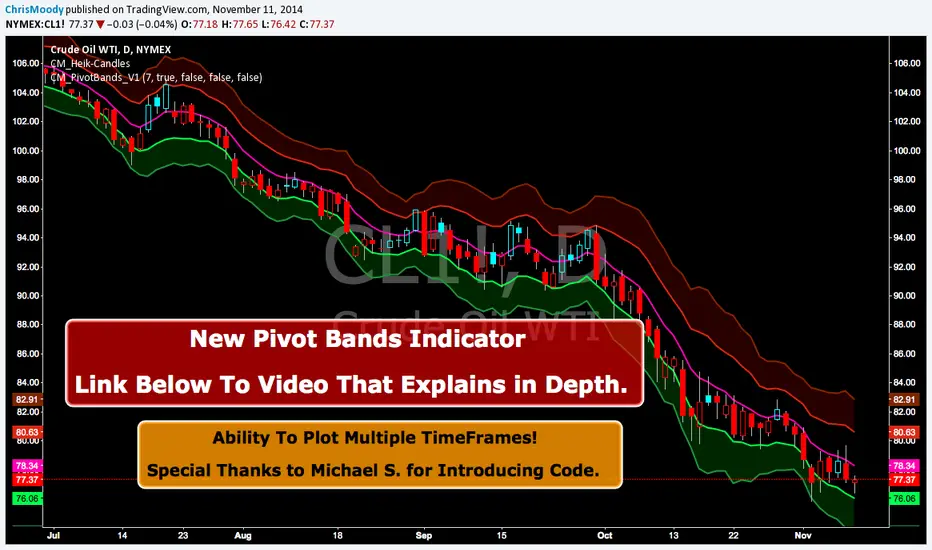
CM Pivot Bands V1CM_Pivot Bands V1
Special Thanks to Michael S for Introducing Code.
Instead of a Long Write Up I Recorded A Video Going Into Detail On V1 Of This Indicator. Please View To See My Initial Findings, My Thoughts For V2, And Items I Need YOUR Help With!!!
In Inputs Tab Indicator Has Ability to Turn On/Off Multiple TimeFrames…Thought Process Explained In Video.
Link To Video:
vimeopro.com
Link To PDF Mentioned In Video:
d.pr
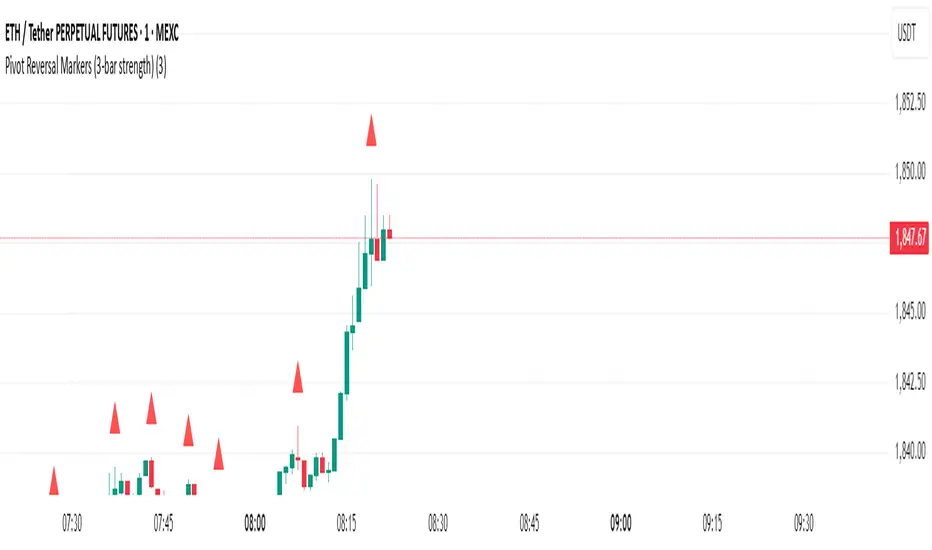
Pivot Reversal Markers (3-bar strength)### Pivot Reversal Markers (3-Bar Strength)
**Overview:**
This indicator identifies and marks pivot high and pivot low reversal points on your chart using a customizable pivot strength. Ideal for traders seeking clear visual signals of potential reversals.
**Settings:**
* **Pivot Strength:** Number of bars checked before and after to confirm a pivot (default = 3).
**Signals:**
* 🔺 **Red Triangle (Pivot High):** Potential short entry or reversal from upward to downward trend.
* 🔻 **Green Triangle (Pivot Low):** Potential long entry or reversal from downward to upward trend.
**Usage:**
Combine these pivot signals with other technical analysis tools or indicators for optimal results.
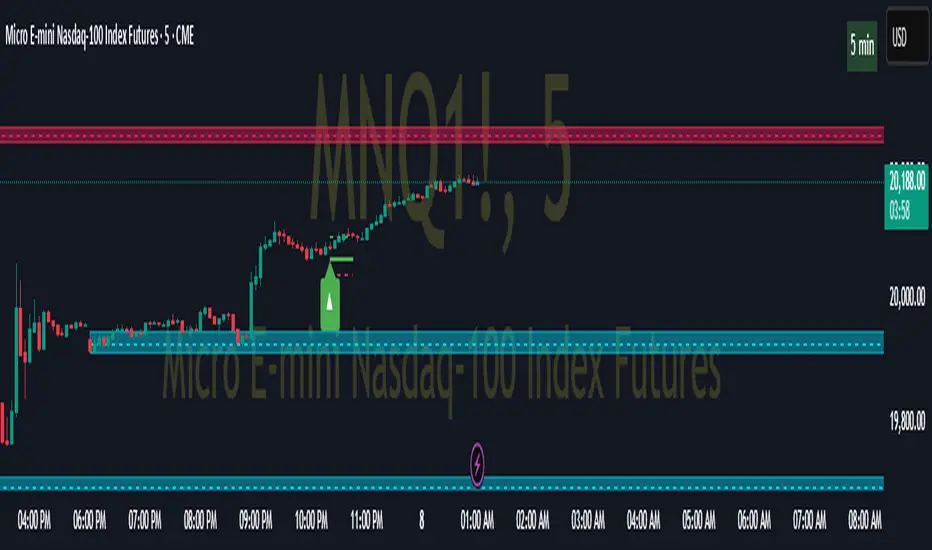
Pivot ATR Zones [v6]🟩 Pivot ATR Zones
Overview:
The Pivot ATR Zones indicator plots dynamic support and resistance zones based on pivot highs and lows, combined with ATR (Average True Range) volatility levels. It helps traders visually identify potential long and short trade areas, along with realistic target and stop loss zones based on market conditions.
Features:
Automatically detects pivot highs and lows
Draws ATR-based entry zones on the chart
Plots dynamic take-profit and stop-loss levels using ATR multipliers
Color-coded long (green) and short (red) zones
Entry arrow markers for clearer trade visualization
Real-time alerts when new zones form
Best For:
Scalpers, intraday traders, and swing traders who want a visual, volatility-aware way to mark potential trade areas based on key pivot structures.
How to Use:
Look for newly formed green zones for long opportunities and red zones for short setups.
Use the dashed lines as dynamic take-profit and stop levels, tuned to the current ATR value.
Combine with other confirmation tools or indicators for optimal results.
Pivot Point Calculator PPC V2 by [KhedrFx]📈 Trade Smarter with the Pivot Point Calculator (PPC) by KhedrFx
Want to spot key price levels and make better trading decisions? The Pivot Point Calculator (PPC) by KhedrFx is your go-to TradingView tool for identifying potential support and resistance zones. Whether you’re a Scalper trader, day trader, swing trader, or long-term investor, this script helps you plan precise entries and exits with confidence.
🔹 How to Use Pivot Points in Trading
📊 Step 1: Identify Key Levels
The PPC automatically plots:
Pivot Point (P): The main level where sentiment shifts between bullish and bearish.
Support Levels (S1, S2, S3): Areas where price may bounce higher.
Resistance Levels (R1, R2, R3): Areas where price may face selling pressure.
These levels act as dynamic price zones, helping you anticipate potential market movements.
🔥 Step 2: Choose Your Trading Strategy
1️⃣ Breakout Trading
Buy when the price breaks above the pivot point (P) with strong momentum.
Sell when the price drops below the pivot point (P) with strong momentum.
Use R1, R2, or R3 as profit targets in an uptrend and S1, S2, or S3 in a downtrend.
2️⃣ Reversal (Bounce) Trading
Buy when the price pulls back to S1, S2, or S3 and shows bullish confirmation (e.g., candlestick patterns like a bullish engulfing or hammer).
Sell when the price rallies to R1, R2, or R3 and shows bearish confirmation (e.g., rejection wicks or a bearish engulfing pattern).
🎯 Step 3: Set Smart Stop-Loss & Take-Profit Levels
Stop-Loss: Place it slightly below support (for buy trades) or above resistance (for sell trades).
Take-Profit: Use the next pivot level as a target.
Extreme Zones: R3 and S3 often signal strong reversals or breakouts—watch them closely!
🚀 How to Get Started
1️⃣ Add the PPC script to your TradingView chart.
2️⃣ Choose a timeframe that fits your strategy (5m, 15m, 30m, 1H, 4H, Daily, or Weekly).
3️⃣ Use the pivot points and support/resistance levels to fine-tune your trade entries, exits, and risk management.
⚠️ Trade Responsibly
This tool helps you analyze the market, but it’s not a guarantee of profits. Always do your own research, manage risk, and trade with caution.
💡 Ready to take your trading to the next level? Try the Pivot Point Calculator (PPC) by KhedrFx and start trading with confidence today! 🚀

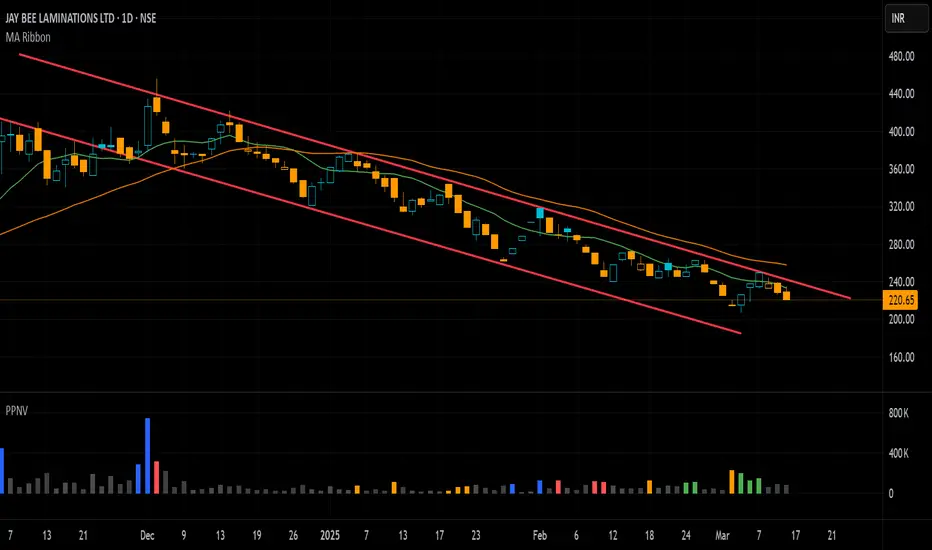
Pivot P/N VolumesTitle: Pivot P/N Volumes
Short Title: PPNV
Description:
The "Pivot P/N Volumes" indicator is a minimalistic volume analysis tool designed to cut through market noise and highlight key volume events in a separate pane. It strips away conventional volume clutter, focusing on four distinct volume types with clear visual cues, making it ideal for traders seeking actionable insights without distractions.
Key Features:
Blue Bars: Pocket Pivot Volumes (PPV) - Up-day volumes exceeding the highest down-day volume of the last 10 down-days, signaling potential bullish strength.
Orange Bars: Pivot Negative Volumes - Down-day volumes greater than the highest up-day volume of the last 10 up-days, indicating significant bearish pressure.
Red Bars: Down-day volumes above the 50-period EMA of volume, highlighting above-average selling activity.
Green Bars: Up-day volumes above the 50-period EMA of volume, showing above-average buying interest.
Noise: All other volumes are muted as dark grey (down-days) or light grey (up-days) for easy filtering.
Pivot-based Swing Highs and LowsRelease Notes for Pivot-based Swing Highs and Lows Indicator with HH, HL, LH, LL and Labels
Version 1.0.0
Release Date: 29th Sept 2024
Overview:
This Pine Script version 5 indicator is designed to identify and display Swing Highs and Swing Lows based on pivot points. The indicator visually marks Higher Highs (HH), Lower Highs (LH), Higher Lows (HL), and Lower Lows (LL) on the chart. The release introduces an improved visual representation with dotted lines and colored labels for easy identification of market structure, using plotshape() and line.new().
Key Features:
1. Pivot-Based Swing Identification:
The indicator uses ta.pivothigh() and ta.pivotlow() to detect significant pivot points on the chart.
The length of the pivot can be adjusted through the pivot_length parameter, allowing users to customize the sensitivity of swing identification.
2. Swing Highs and Lows with Labels:
Higher High (HH) and Lower High (LH) points are marked with green downward triangles.
Higher Low (HL) and Lower Low (LL) points are marked with red upward triangles.
The plotshape() function is used to provide clear visual markers, making it easy to spot the changes in market structure.
3. Dotted Line Visuals:
Green Dotted Lines: Connect Higher Highs (HH) and Higher Lows (HL) to their corresponding previous swings.
Red Dotted Lines: Connect Lower Highs (LH) and Lower Lows (LL) to their corresponding previous swings.
The use of color-coded dotted lines ensures better visual understanding of the trend continuation or reversal patterns.
4. Customizable Input:
The user can adjust the pivot_length parameter to fine-tune the detection of pivot highs and lows according to different timeframes or trading strategies.
Usage:
Higher High (HH): Green downward triangle, indicating a new high compared to the previous pivot high.
Lower High (LH): Green downward triangle, indicating a lower high compared to the previous pivot high.
Higher Low (HL): Red upward triangle, indicating a higher low compared to the previous pivot low.
Lower Low (LL): Red upward triangle, indicating a new lower low compared to the previous pivot low.
Dotted Lines: Connect previous swing points, helping users visualize the trend and potential market structure changes.
Improvements:
Label Substitution: In place of label.new() (which might cause issues in some environments), the indicator now uses plotshape() to provide a reliable and visually effective solution for marking swings.
Streamlined Performance: The logic for determining higher highs, lower highs, higher lows, and lower lows has been optimized for smooth performance across multiple timeframes.
Known Limitations:
No Direct Text Labels: Due to the constraints of plotshape(), text labels like "HH", "LH", "HL", and "LL" are not directly displayed. Instead, color-coded shapes are used for easy identification.
How to Use:
Apply the script to your chart via the TradingView Pine Editor.
Customize the pivot_length to suit your trading style or the timeframe you are analyzing.
Monitor the chart for marked Higher Highs, Lower Highs, Higher Lows, and Lower Lows for potential trend continuation or reversal opportunities.
Use the dotted lines to trace the evolution of market structure.
Please share your comments, thoughts. Also please follow me for more scripts in future. Mean time Happy Trading :)

Pivot Points + Day First Candle Breakout + VWAP + Supertrend This indicator amalgamates several key indicators to provide a comprehensive analysis for trading decisions, including SuperTrend, Pivot Points, VWAP, along with the Day First Candle Breakout strategy.
Key Features:
Day First Candle Breakout: Identifies potential breakout opportunities based on the first candle of the trading day. It utilizes the high and low of the initial trading range to determine entry points.
Timeframe Selection: Allows users to select the timeframe for analyzing the first candle (e.g., 5, 15, or 60 minutes).
Previous Day and Week High/Low: Displays the high and low of the previous day and week to provide additional context for trading decisions and assess the strength of the trend.
Trend Strength Analysis: Indicates whether the current price is above or below the previous day's high or low, signaling a stronger bullish or bearish trend respectively.
SuperTrend Indicator: Visualizes the trend direction and potential reversal points based on the SuperTrend indicator. It helps traders to stay aligned with the prevailing trend and avoid premature exits.
Pivot Points: Presents key support and resistance levels derived from Pivot Points, assisting traders in identifying potential reversal or breakout zones.
VWAP (Volume Weighted Average Price): Plots VWAP to provide insight into the average price traded over a given period, aiding in determining the fair value of the asset and potential buying/selling zones.
Trading Signals:
Buy Signal: Triggered when the price exceeds the high of the initial trading range after an upward price gap.
Sell Signal: Generated when the price falls below the low of the initial trading range after a downward price gap.
Caveats for Effective Trading:
Extended Trading Ranges: Adjusts support and resistance levels if the initial trading range extends beyond the defined timeframe.
Morning Noise Consideration: Exercises caution during volatile morning sessions to avoid false breakouts and whipsaws.
Pullbacks and Narrow Range Bars: Looks for opportunities during pullbacks or when the price forms narrow range bars to enter trades, reducing the risk of sudden reversals.

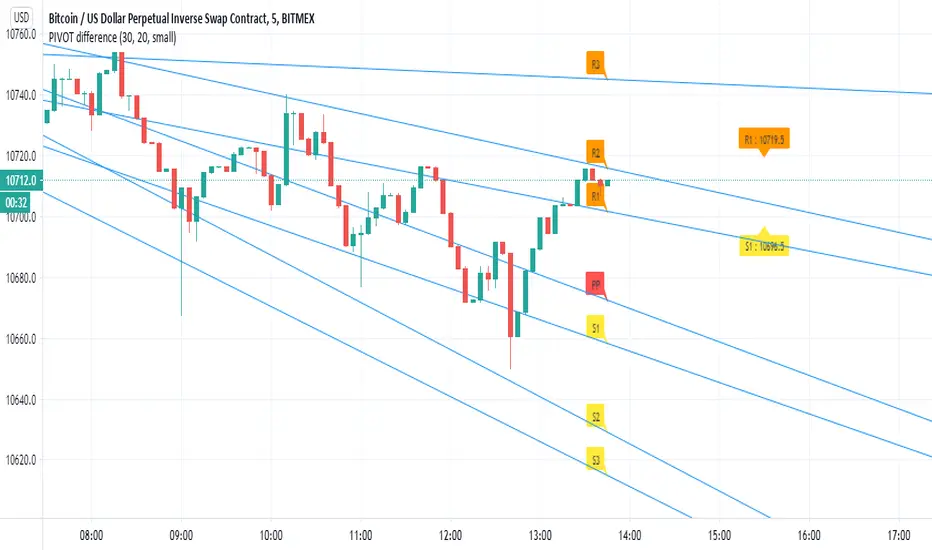
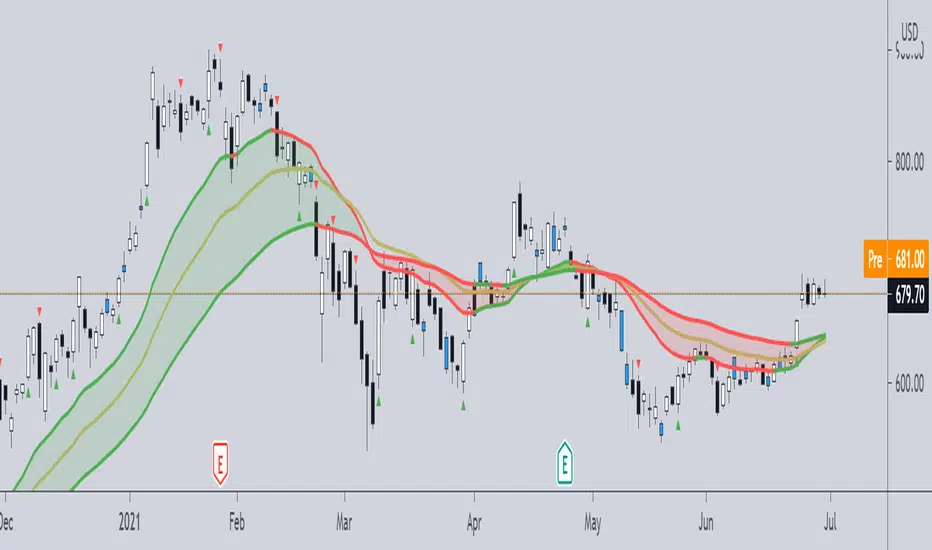
PIVOT differenceall credit to pine coders of TV- www.tradingview.com
this is just example of the new function and how we can make smart pivot system for low TF
on the right side (the normal pivot that we use S1 and R1 level shown)
the lines represent the trend of the pivot and there levels
here i use 30 min pivot MTF on 5 min chart
in this example we can see that we have much more correct way to estimate break up or down
the get price function allow you to make alerts of crossing of the trend line ( I am lazy now so maybe later I add it:) )
you can use same TF as the chart or higher
and then examine where you think you nned to buy and sell
I normaly add linear regression or other method of choice for conformation of buy or sell oppertunity
this is just raw idea but this function can be exploited with any trend line or system that one can think about
this is just example to think on :)
Pivot cycles - JDThis indicator tells you how many bars it takes to get from one pivot point to another.
This can give you a probability of when an upward or downward pivot is 'overdue'.
As is the nature of pivot points, this naturally lags by default by half of the pivot length!!
eg. if the pivot length is set to 6 the indicator will give you the pivot point 3 bars later.
JD.
#DYOR
#nottradingadvice

PIVOT AND ICHIMOKU BACKGROUND BY PRANOJIT DEYIt shows pivot bias in relation to day open line and it also shows ichimoku bullish trend background. good for option buyers to understand market bias.

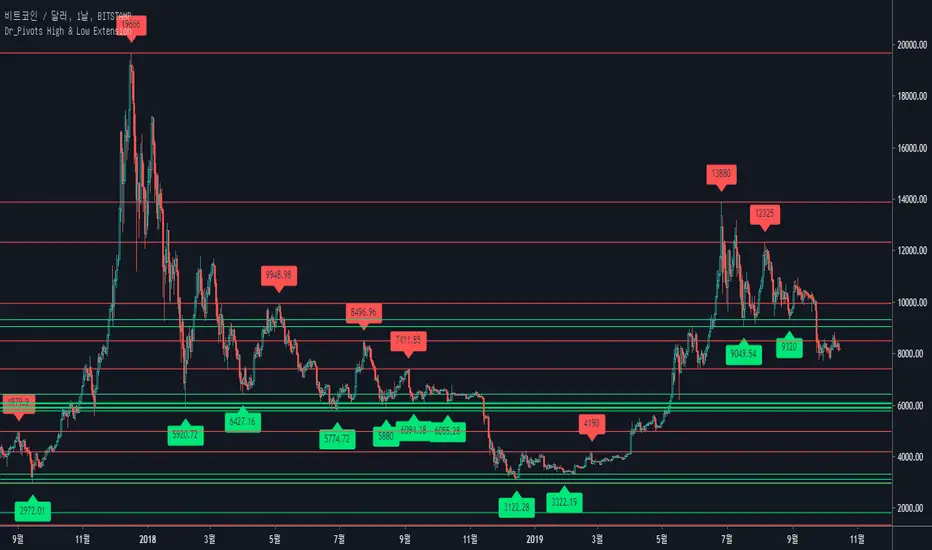
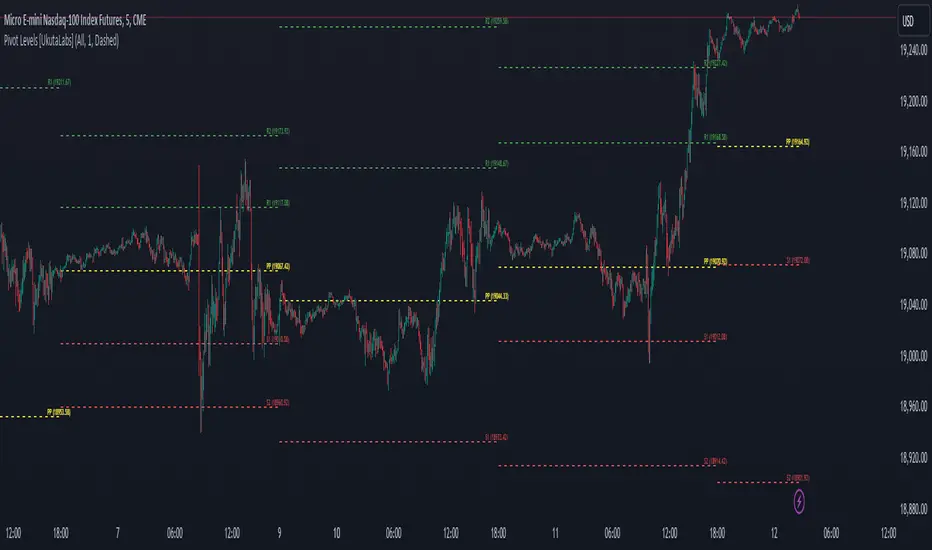
Pivot Levels [UkutaLabs]█ OVERVIEW
The Pivot Levels Indicator provides real-time insight into key price levels within the market that can serve as powerful support and resistance levels. These levels are based on currently-relevant price-action information to ensure that the lines being drawn provide the most value to traders regardless of their trading style.
The aim of this script is to simplify the trading experience of users by automatically identifying and displaying price levels that they should be aware of.
█ USAGE
At the beginning of each trading day, the script will identify the previous day’s hlc3 level. We refer to this level as the day’s Source Level, and it is from this price that the other Resistance and Support levels are calculated.
The script then identifies the total price range of the previous day (Previous Day High - Previous Day Low), then draws Resistance and Support lines based on the Source Level and the previous day’s range.
The script identifies these levels on both sides of the Source. Levels above the Source are considered to be points of Resistance and below the Source are considered to be Support, but the levels are free to be interpreted and used in whatever way fits the user’s trading strategy.
A label is drawn at the end of each line that identifies the line and whether it represents support or resistance. These labels can be disabled in the settings.
█ SETTINGS
Configuration
• Show Labels: Determines whether or not labels are displayed at the end of each line.
• Display Mode: Determines the number of days for the script to load.
Line Settings
• Resistance Color: Determines the color of the resistance lines and labels above the Source Level.
• Source Color: Determines the color of the source line and label.
• Support Color: Determines the color of the support lines and labels below the Source Level.
• Line width: Determines the width of lines.
• Line Style: Determines the style of lines.
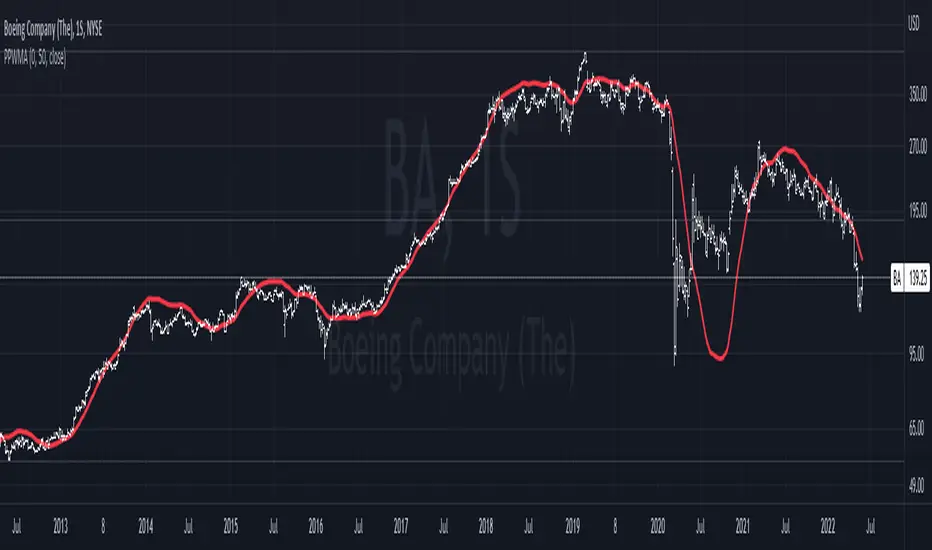
Pivot-Point Weighted Moving AverageThe Pivot-Point Weighted MA is very different from other weighted MAs, in the sense that the price weights can achieve negative values. For an example, if a length of 21 is used, the pivot point will be calculated as 13, meaning that the 13th prior candle will have 0 weight, and all prices before it will have a negative weight on the sum, so their impact is reversed rather than just unweighted.
The intent of this is to reduce lag by front-loading the prices. It works better in cyclic markets, and with a longer length, where the inflection point (the one with 0 weight) is aligned with the cyclic turn.
You can configure where the weight starts. If you leave it as 0, it will start with floor(length * 0.66) - 1.
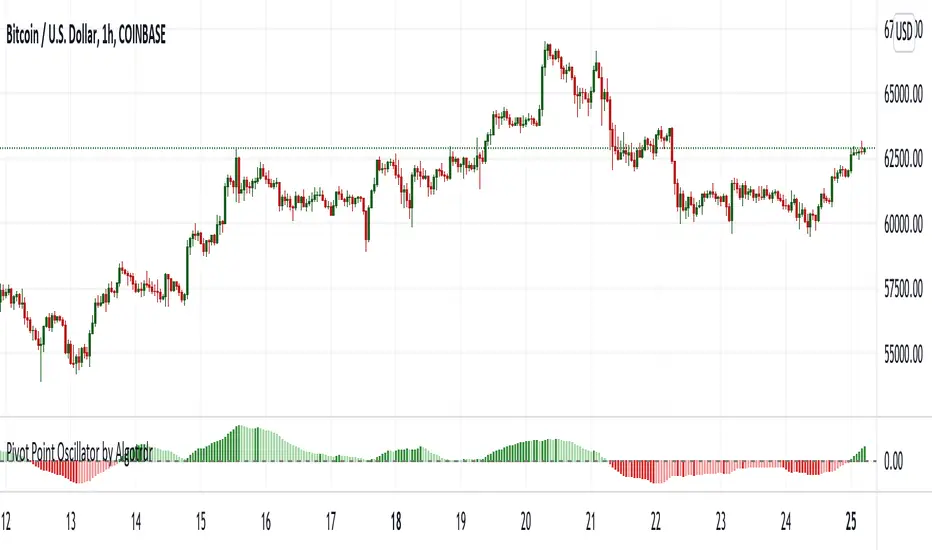
Pivot Point Oscillator by AlgotrdrThis script tracks moments where price closes over s/r levels on 3 sets of pivot points and turns it into an oscillator to help users analyze price movements at a glance. Enjoy!
Pivot TrackerThis script finds swing lows and swing highs based on input criteria for lookback and lookforward periods, and plots letters accordingly.
Helps identify trend or lacktherof
HH = higher high
LH = lower high
HL = higher low
LL = lower low

Pivot Boss -- Squat bars and Non Squat Bars 2.0Squat Bar Signal -- current Volume is greater than previous volume but Current bar MFI(Market Facilitation index) is lesser than previous bar MFI
Other Conditions -- Current Bars Range is lesser than (Average Range * Range Multiplier)
Non Squat Bar Buy Signal(Green Up Triangle) -- Volume and MFI is greater than previous bar, Close greater than open, Close is greater than midpoint
Non Squat Bar Sell Signal(Red Down Triangle) -- Volume and MFI is greater than previous bar, Close lesser than open, Close is lesser than midpoint
Usually Squat signal is confirmed by Non Squat Bar Signal..
Other indicator used -- PEMA -- Pivot based EMA
For Better results use it along with Advanced Volume indicator and PEMA
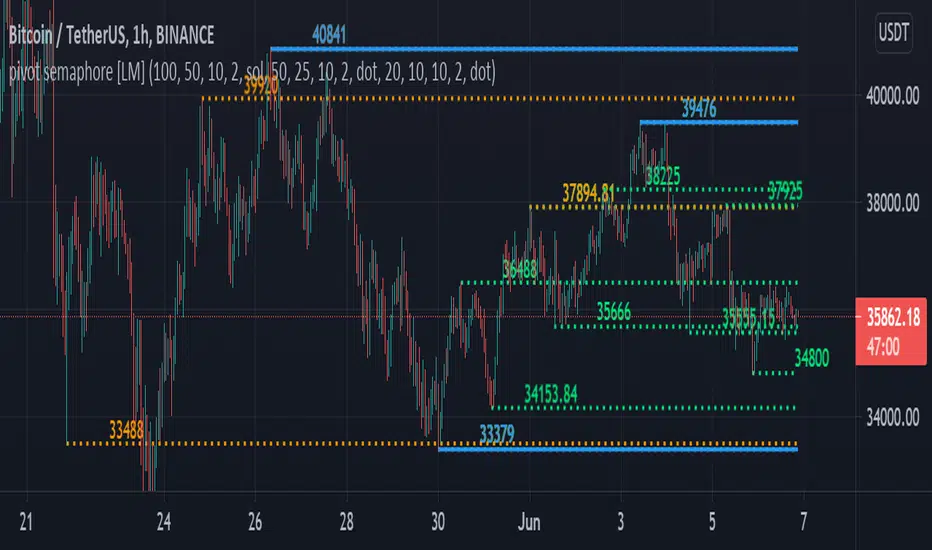
pivot semaphore support&resistance levels [LM]Hello Traders,
I would like to introduce you pivot semaphore support&resistance levels. The idea is the same as the zigzag script of mine to spot the importance of support&resistence
The Semafor is used to spot future multi-level Supports and Resistance zones.
It is also useful to spot HL or LL or HH or LH zones at different Depth settings.
The red zones are the extreme places where the market has a higher chance of reversing while the green zones have the lowest setting with lower chances of the market reversal
The lines can be extended like so
The lines also can just stop extending when price will reach it
Enjoy!
Pivot Points [KrisWaters] vX by DGT (Russian version)A useful multitool script from the talented dgtrd with my translation into Russian. Full description from the author.
Полезный скрипт-мультитул от талантливого dgtrd с моим переводом на русский.
Полное описание у автора:

Pivot Points 17 - StandardDisclaimer!
-This indicator doesn't tell you the market condition (BUY or SELL)
Cons!
- Totally dependent on your knowledge
Pros!
- Projects the Key Levels of a single time frame on the chart
Usage!
- Watch out for rejections at these levels
- Identify breakouts at these levels with strong confirmation like RETEST (as Level Role Reversal)
