Cnagda Liquidit Trading SystemCnagda Liquidit Trading System helps spot where price is likely to trap traders and reverse, then gives simple, actionable Level to entry, place SL, and take profits with confidence. It blends imbalance zones, trend bias, order blocks, liquidity pools, high-probability fake Signal, and context-aware candle patterns into one clean workflow.
🟩🟥 Imbalance boxes: “Crowd rushed, gaps left”
What it is: Green/red boxes mark fast, one-sided moves where price “skipped” orders—think FVG-like zones that often get revisited.
Why it helps: Price frequently pulls back to “fill” these zones, creating clean retest entries with logical stops.
⏩How to use:
Green box = potential demand retest; Red box = potential supply retest. Enter on pullback into box, not on first impulse. Put stop on far side of box and aim first targets at recent swing points.
↕️ Swing bias (HH/HL vs LH/LL): “Which way is the road?”
What it is: Higher-highs/higher-lows = up-bias; Lower-highs/lower-lows = down-bias. system plots Buy/Sell OB levels aligned with that bias.
Why it helps: Trading with the broader flow reduces “hero trades” against institutions. Bias gives clearer entries and cleaner drawdowns.
⏩How to use:
Up-bias: look for long on Buy OB retests. Down-bias: look for short on Sell OB retests. Wait for a small rejection/engulfing to confirm before triggering.
🧱Order blocks: “Where big players remember”
What it is: last opposite-colored candle before an impulsive move—these zones often hold memory and reaction. system plots these as Buy/Sell OB lines.
Why it helps: Many breakouts pull back to the origin. Good entries often happen on retest, not on the breakout chase.
⏩ How to use:
Let price return into the OB, show wick rejection, and decent volume. Enter with stop beyond OB; define risk-reward before entry.
📊Volume coloring: “How Volume is move?”
What it is: Bar color reflects relative volume; inside bars are black. The dashboard also shows Volume and “Volume vs Prev.”
Why it helps: Patterns without volume often fade; volume validates strength and intent of moves.
⏩ How to use:
Favor entries where imbalance/OB/liquidity-grab coincide with higher volume. If volume is weak, reduce size or skip.
🧲 BSL/SSL liquidity pools: “Fishing for stops”
What it is: Equal highs cluster stops above (BSL); equal lows cluster stops below (SSL). system plots these and highlights the nearest one (“magnet”).
Why it helps: Price often sweeps these pools to trigger stops before reversing. This is a prime trap-reversal location.
⏩ How to use:
Watch nearest BSL/SSL. If price wicks through and closes back inside, anticipate a reversal. Trade reaction, not first poke. When price closes beyond, consider that pool mitigated and move on.
🟢🔴 Advanced liquidity grab: “Catch fakeout”
What it is: Bullish grab = makes a new low beyond a prior low but closes back above it, with a long lower wick, small body, and higher volume. Bearish is mirror. Labeled automatically.
Why it helps: It exposes trap moves (stop hunts) and often precedes true direction.
⏩ How to use:
Best when it aligns with a nearby imbalance/OB and supportive volume. Enter on reversal candle break or on retest. Stop goes beyond sweep wick.
🧠 Smart candlestick patterns (only in right place)
What it is: Engulfing, Hammer, Shooting Star, Hanging Man, Doji (with high volume), Morning/Evening Star, Piercing—but marked “effective” only if context (swing/trend/location) agrees.
Why it helps: same pattern in the wrong place is noise; in the right place, it’s signal.
⏩ How to use:
Location first (BSL/SSL/OB/imbalance), then pattern. Treat pattern as trigger/confirmation—one fresh label shows to keep chart clean.
🧭 Dashboard: “Context in a glance”
⏩ Reversal Level: current swing anchor—expect turns or reactions nearby; great for alerts and planning.
⏩ Volume vs Prev + Volume: Strength meter for signal candle—higher adds conviction.
⏩ Nearest Pool: next “magnet” area—look for sweeps/rejections there.
🧩Step-by-step trading flow (with mindset)
⏩ Set bias: HH/HL = long bias, LH/LL = short bias. Counter-trend only on clean sweeps with strong confirmation.
⏩ Find magnet: Check Nearest Pool (BSL/SSL). Focus attention there; it saves screen time.
⏩ Wait for event: Look for a sweep/grab label, or sharp rejection at pool/OB/imbalance. Avoid FOMO.
⏩ Add confluence: Stack 2–3 of these—imbalance box, OB, contextual pattern, supportive volume.
⏩Plan entry: Bullish: trigger above reversal candle high or take retest of FVG/OB. Stop below sweep wick/zone. Target at least 1:1.5–1:2.
Bearish: mirror above.
⏩Manage smartly: Take partials, move to breakeven or trail thoughtfully. Don’t drag stops inside zone out of emotion.
🎛️ Parameter tuning (to reduce human error)
⏩ swingLen: Smaller = faster but noisier; larger = cleaner but slower. Backtest first, then go live.
⏩ Tolerance (ATR or percent): ATR tolerance adapts to volatility (good for fast markets and lower TFs). Start around 0.15–0.30. In calm markets, try percent 0.05–0.15%.
⏩ minBarsGap: Start with 3–5 so equal highs/lows are truly equal—reduces false pools.
❌Common mistakes → ✅ Better habits
⏩Chasing every breakout → Wait for sweep/rejection, then confirm.
⏩Ignoring volume → Validate strength; cut size or skip on weak volume.
⏩Losing history of pools → If reviewing/backtesting, keep mitigated pools visible (dashed/faded).
⏩Over-tight tolerance/too small swingLen → Increases false signals; backtest to find balance.
📝 checklist (before entry)
⏩ Is there a nearby BSL/SSL and did a sweep/grab happen there?
⏩ Is there a close imbalance/OB that price can retest?
⏩ Do we have an effective pattern plus supportive volume?
⏩Is the stop beyond the wick/zone and RR ≥ 1:1.5?
•?((¯°·._.• 🎀 𝐻𝒶𝓅𝓅𝓎 𝒯𝓇𝒶𝒹𝒾𝓃𝑔 🎀 •._.·°¯((?•
ค้นหาในสคริปต์สำหรับ "fvg"

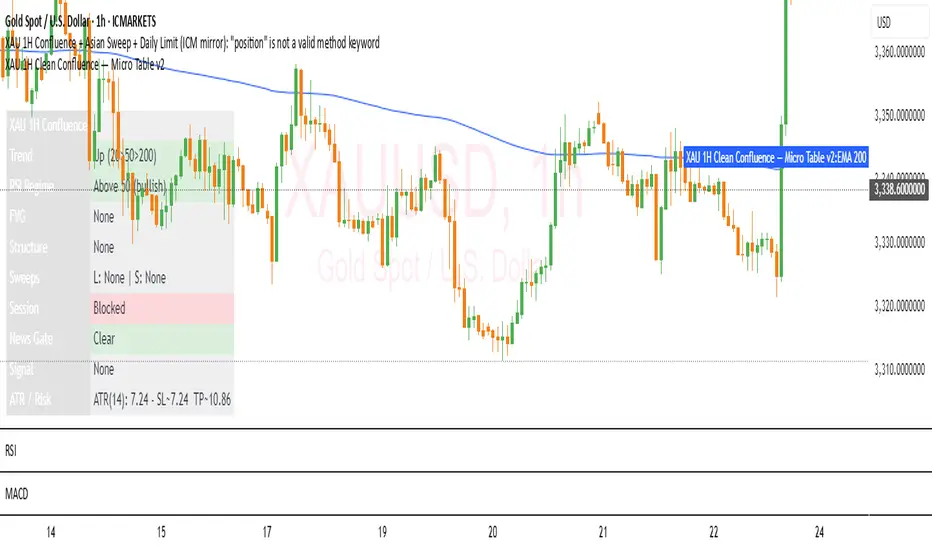
XAU 1H Clean Confluence — Micro Table v2XAU 1H Clean Confluence — Micro Table
What it is
A clean, low-clutter 1-hour XAUUSD indicator that summarizes confluences in a compact on-chart table. It’s designed for traders who want structure + momentum + location without covering the chart in drawings.
Best used on: ICMARKETS:XAUUSD or your broker’s XAUUSD feed, 1H timeframe.
Style: Table-only by default (optional EMA200 line and tiny signal markers).
How signals are built (long example; shorts mirror)
A Long Confluence is printed when all of the below are true:
Trend alignment: EMA20 > EMA50 > EMA200
Pullback & re-engage: price crossed back above EMA20 after a pullback
RSI regime: RSI(14) crosses up through 50 (trend confirmation)
Displacement/imbalance: a 3-candle Bull FVG exists (low > high )
Structure: either a BOS up or CHOCH up via swing pivots (pivotLen input)
Sweep (optional): if enabled, require a sweep of Asian Low and/or PDL first
Time gating (optional): only during London/NY windows and outside news windows
Short signals use the mirrored conditions (EMA stack down, cross back below EMA20, RSI cross down through 50, Bear FVG, BOS/CHOCH down, optional Asian High/PDH sweep).
XAUUSD Strength Dashboard with VolumeXAUUSD Strength Dashboard with Volume Analysis
📌 Description
This advanced Pine Script indicator provides a multi-timeframe dashboard for XAUUSD (Gold vs. USD), combining price action analysis with volume confirmation to generate high-probability trading signals. It detects:
✅ Break of Structure (BOS)
✅ Fair Value Gaps (FVG)
✅ Change of Character (CHOCH)
✅ Trendline Breaks (9/21 SMA Crossover)
✅ Volume Spikes (Confirmation of Strength)
The dashboard displays strength scores (0-100%) and action recommendations (Strong Buy/Buy/Neutral/Sell/Strong Sell) across multiple timeframes, helping traders identify confluences for better trade decisions.
🎯 How It Works
1. Multi-Timeframe Analysis
Fetches data from 1m, 5m, 15m, 30m, 1h, 4h, Daily, and Weekly timeframes.
Compares trend direction, BOS, FVG, CHOCH, and volume spikes across all timeframes.
2. Volume-Confirmed Strength Score
The Strength Score (0-100%) is calculated using:
Trend Direction (25 points) → 9 SMA vs. 21 SMA
Break of Structure (20 points) → New highs/lows with momentum
Fair Value Gaps (10 points) → Imbalance zones
Change of Character (10 points) → Shift in market structure
Trendline Break (20 points) → SMA crossover confirmation
Volume Spike (15 points) → High volume confirms moves
Score Interpretation:
≥75% → Strong Buy (High confidence bullish move)
60-74% → Buy (Bullish but weaker confirmation)
40-59% → Neutral (No strong bias)
25-39% → Sell (Bearish but weaker confirmation)
≤25% → Strong Sell (High confidence bearish move)
3. Dashboard & Chart Markers
Dashboard Table: Shows Trend, BOS, Volume, CHOCH, TL Break, Strength %, Key Level, and Action for each timeframe.
Chart Markers:
🟢 Green Triangles → Bullish BOS
🔴 Red Triangles → Bearish BOS
🟢 Green Circles → Bullish CHOCH
🔴 Red Circles → Bearish CHOCH
📈 Green Arrows → Bullish Trendline Break
📉 Red Arrows → Bearish Trendline Break
"Vol↑" (Lime) → Bullish Volume Spike
"Vol↓" (Maroon) → Bearish Volume Spike
🚀 How to Use
1. Dashboard Interpretation
Higher Timeframes (D/W) → Show the dominant trend.
Lower Timeframes (1m-4h) → Help with entry timing.
Strength Score ≥75% or ≤25% → Look for high-confidence trades.
Volume Spikes → Confirm breakouts/reversals.
2. Trading Strategy
📈 Long (Buy) Setup:
Higher TFs (D/W/4h) show bullish trend (↑).
Current TF has BOS & Volume Spike.
Strength Score ≥60%.
Key Level (Low) holds as support.
📉 Short (Sell) Setup:
Higher TFs (D/W/4h) show bearish trend (↓).
Current TF has BOS & Volume Spike.
Strength Score ≤40%.
Key Level (High) holds as resistance.
3. Customization
Adjust Volume Spike Multiplier (Default: 1.5x) → Controls sensitivity to volume spikes.
Toggle Timeframes → Enable/disable higher/lower timeframes.
🔑 Key Benefits
✔ Multi-Timeframe Confluence → Avoids false signals.
✔ Volume Confirmation → Filters low-quality breakouts.
✔ Clear Strength Scoring → Removes emotional bias.
✔ Visual Chart Markers → Easy to spot key signals.
This indicator is ideal for gold traders who follow institutional order flow, market structure, and volume analysis to improve their trading decisions.
🎯 Best Used With:
Support/Resistance Levels
Fibonacci Retracements
Price Action Confirmation
🚀 Happy Trading! 🚀

MistaB SMC Navigation ToolkitMistaB SMC Navigation Toolkit
A complete Smart Money Concepts (SMC) toolkit designed for precision navigation of market structure, order flow, and premium/discount trading zones. Perfect for traders following ICT-style concepts and multi-timeframe confluence.
Features
✅ Order Blocks (OBs)
• Automatic bullish & bearish OB detection
• Optional displacement & high-volume filters
• Midline display for quick equilibrium view
• Auto-expiry and broken OB cleanup
✅ Fair Value Gaps (FVGs)
• Bullish & bearish gap detection
• HTF bias filtering for higher accuracy
• Compact boxes with labels
• Automatic removal when filled
✅ Market Structure (BoS / CHoCH)
• Fractal-based swing detection
• Break of Structure & Change of Character labeling
• Dynamic HTF bias dimming
✅ Premium / Discount Zones
• Auto-calculated mid-level
• Highlighted zones for optimal trade placement
✅ Higher Timeframe (HTF) Confirmation
• Configurable confirmation timeframe
• On-chart HTF status label (Bullish / Bearish / Not Required)
✅ Automatic Cleanup System
• Fast or delayed cleanup for expired/broken zones
• Dimmed colors for invalidated levels
How to Use
Set your preferred HTF in the settings.
Look for OB/FVGs aligned with HTF bias.
Enter in discount zones for longs or premium zones for shorts.
Confirm with BoS / CHoCH signals before entry.
Manage trades towards opposing liquidity zones or HTF levels.
Disclaimer
This indicator is for educational purposes only. It does not provide financial advice or guarantee future results. Always practice proper risk management and test thoroughly before live trading.

AymaN Entry Signal – With HTF + Pin Bar + Multi TP + BE + V1Ayman Entry Signal – Indicator Description
Overview
Ayman Entry Signal – With HTF + Pin Bar + Multi TP + BE + Stats Panel (V1)
This is a professional-grade Pine Script indicator designed for scalping and intraday trading, with full trade management, multi-confirmation logic, and advanced visualization. The tool is ideal for traders focused on XAUUSD (Gold), Forex, and other volatile instruments who seek both precision entries and structured exits with dynamic risk control.
Main Features
Advanced Entry Logic:
- EMA fast/slow crossovers (configurable)
- Optional conditions: Break of Structure (BoS), Order Block (OB), Fair Value Gap (FVG), Liquidity sweeps, Pin Bars
- HTF confirmation using EMA or BoS
- Real-time entry condition display
Trade Management:
- Dynamic calculation of Entry, SL (with ATR buffer), TP1, TP2
- Supports Partial Close and Break Even logic after TP1
- Visual PnL label (dynamic and color-coded)
Statistics Panel:
- Shows total trades, win/loss/breakeven count, cumulative PnL
- Filter by custom date or session
- Fully customizable panel appearance
Trade Visualization:
- Trade box includes all trade levels (Entry, SL, TP1, TP2)
- Visual display of trade conditions and PnL result
- Option to keep previous trades on chart
Alert System:
- Alerts for Buy and Sell entries
- Compatible with webhook automation systems like MT5/MT4
Customization & Inputs
- Capital & risk per trade
- Value per pip/point
- SL buffer (ATR-based)
- Manual EMA override
- Enable/disable: EMA, BoS, OB, FVG, Liquidity, Pin Bars
- HTF: timeframe + confirmation logic
- Trade box/labels visibility
- Full color customization
- PnL label position: top, center, or bottom
Recommended Use
- Ideal for Gold scalping (XAUUSD), also effective for Forex
- Best on 1m–15m charts; use HTF confirmation from 15m–4H
- Pairs well with semi-automated systems using alerts and webhooks
Disclaimer
Note: This is a non-executing indicator. It does not place trades but provides visual and statistical guidance for professional manual or semi-automated trading.

Midnight 30min High/LowMidnight 30min High/Low — Overnight Liquidity Range Tracker
Capture the Overnight Session: A Strategic Level Identification Tool from Professional Trading Methodology
This indicator captures the high and low prices during the critical 30-minute midnight session (12:00-12:30 AM EST) and projects these levels forward as key support and resistance zones. These overnight ranges often contain significant liquidity and serve as crucial reference points for intraday price action, representing areas where institutional activity may have established important levels.
🔍 What This Script Does:
Identifies Critical Overnight Session Levels
- Automatically detects the 12:00-12:30 AM EST session window
- Captures the highest and lowest prices during this 30-minute period
- Projects these levels forward for multiple trading days
Creates Dynamic Support/Resistance Zones
- Extends midnight high/low levels as horizontal lines with customizable projection periods
- Fills the area between high and low to create a visual trading range
- Updates automatically each trading day with new overnight levels
Provides Clear Visual Reference Points
- Optional session start markers (●) highlight when the midnight session begins
- Color-coded lines distinguish between high and low levels
- Transparent fill area creates an easy-to-identify trading zone
Real-Time Level Tracking
- Updates levels in real-time during the active midnight session
- Maintains historical levels for reference and backtesting
- Compatible with data window for precise level values
⚙️ Customization Options:
Extend Days (1-30):** Control how many days forward the levels are projected (default: 5 days)
High Line Color:** Customize the midnight high line color (default: blue)
Low Line Color:** Customize the midnight low line color (default: orange)
Fill Color:** Adjust the transparency and color of the range area (default: light aqua, 80% transparency)
Show Session Markers:** Toggle yellow session start indicators on/off (default: enabled)
💡 How to Use:
Deploy on lower timeframes (1m-15m) for precise level identification and reaction monitoring**
Watch for key price interactions:
- Rejection at midnight high levels (potential resistance)
- Bounce from midnight low levels (potential support)
- Range-bound trading between the high and low levels
Combine with liquidity concepts:
- Monitor for stop hunts above/below these levels
- Look for false breakouts that snap back into the range
- Use as confluence with other ICT concepts like FVGs and Order Blocks
Strategic Applications:
- Range trading between midnight levels
- Breakout confirmation when price closes decisively outside the range
- Support/resistance validation for entry and exit planning
🔗 Combine With These Tools for Complete Market Structure Analysis:
✅ First FVG — Opening Range Fair Value Gap Detector.
✅ ICT Turtle Soup (Liquidity Reversal)— Spot stop hunts and false breakout scenarios
✅ ICT Macro Zones (Grey Box Version)- It tracks real-time highs and lows for each Silver Bullet session
✅ ICT SMC Liquidity Grabs and OBs- Liquidity Grabs, Order Block Zones, and Fibonacci OTE Levels, allowing traders to identify institutional entry models with clean, rule-based visual signals.
Together, these tools create a comprehensive Smart Money Concepts (SMC) framework — helping traders identify, anticipate, and capitalize on institutional-level price movements with precision and confidence during critical overnight sessions.

PRO SMC DASHBOARDPRO SMC DASHBOARD - PRO LEVEL
Advanced Supply & Demand / SMC dashboard for scalping and intraday:
Multi-Timeframe Trend: Visualizes trend direction for M1, M5, M15, H1, H4.
HTF Supply/Demand: Shows closest high time frame (HTF) supply/demand zone and distance (in pips).
Smart “Flip” & Liquidity Signals: Flip and Liquidity Sweep arrows/signals are shown only when truly significant:
Near HTF Supply/Demand zone
And confirmed by volume spike or high confluence score
Momentum & Bias: Real-time momentum (RSI M1), H1 bias and fakeout detection.
Confluence Score: Objective score (out of 7) for trade confidence.
Volume Spike, Divergence, BOS: Includes volume spikes, RSI divergence (M1), and Break of Structure (BOS) for both M15 & H1.
Ultra-clean chart: Only valid signals/alerts shown; no spam or visual clutter.
Full dashboard with all signals and context, always visible bottom-right.
Best used for:
Forex, Gold/Silver, US indices, and crypto
Scalping/intraday with fast, clear decisions based on multi-factor SMC logic
Usage:
Add to your chart, monitor the dashboard for valid setups, and trade only when multiple factors align for high-probability entries.
How to Use the PRO SMC DASHBOARD
1. Add the Script to Your Chart:
Apply the indicator to your favorite Forex, Gold, crypto, or indices chart (best on M1, M5, or M15 for entries).
2. Read the Dashboard (Bottom Right):
The dashboard shows real-time information from multiple timeframes and key SMC filters, including:
Trend (M1, M5, M15, H1, H4):
Arrows show up (↑) or down (↓) trend for each timeframe, based on EMA.
Momentum (RSI M1):
Shows “Strong Up,” “Strong Down,” or “Neutral” plus the current RSI value.
RSI (H1):
Higher timeframe momentum confirmation.
ATR State:
Indicates current volatility (High, Normal, Low).
Session:
Detects if the market is in London, NY, or Asia session (based on UTC).
HTF S/D Zone:
Shows the nearest high timeframe Supply or Demand zone, its timeframe (M15, H1, H4), and exact pip distance.
Fakeout (last 3):
Detects recent false breakouts—if there are multiple fakeouts, potential for reversal is higher.
FVG (Fair Value Gap):
Indicates direction and distance to the nearest FVG (Above/Below).
Bias:
“Strong Buy,” “Strong Sell,” or “Neutral”—multi-timeframe, momentum, and volatility filtered.
Inducement:
Alerts for possible “stop hunt” or liquidity grab before reversal.
BOS (Break of Structure):
Recent or live breaks of market structure (for both M15 & H1).
Liquidity Sweep:
Shows if price just swept a key high/low and then reversed (often key reversal point).
Confluence Score (0-7):
Higher score means more factors align—look for 5+ for strong setups.
Volume Spike:
“YES” appears if the current volume is significantly above average—big players are active!
RSI Divergence:
Bullish or bearish divergence on M1—signals early reversal risk.
Momentum Flip:
“UP” or “DN” appears if RSI M1 crosses the 50 line, confirmed by location and other filters.
Chart Signals (Arrows & Markers):
Flip arrows (up/down) and Liquidity markers only appear when price is at/near a key Supply/Demand zone and confirmed by either a volume spike or strong confluence.
No signal spam:
If you see an arrow or LIQ tag, it’s a truly significant moment!
Suggested Trading Workflow:
Scan the Dashboard:
Is the multi-timeframe trend aligned?
Are you near a major Supply or Demand zone?
Is the Confluence Score high (5 or more)?
Check for Signals:
Is there a Flip or LIQ marker near a Supply/Demand zone?
Is volume spiking or a fakeout just occurred?
Look for Reversal or Continuation:
If there’s a Flip at Demand (with high confluence), consider a long setup.
If there’s a LIQ sweep + flip + volume at Supply, consider a short.
Manage Risk:
Don’t chase every signal.
Confirm with your entry criteria and preferred session timing.
Pro Tips:
Highest confidence trades:
When dashboard signals and chart arrows/markers agree, especially with high confluence and volume spike.
Adapt pip distance filter:
Dashboard is tuned for FX and gold; for other assets, adjust pip-size filter if needed.
Use alerts (if enabled):
Set up custom TradingView alerts for “Flip” or “Liquidity” signals for auto-notifications.
Designed to help you make professional, objective decisions—without chart clutter or second-guessing!

Path of Least ResistancePath of Least Resistance (PLR)
Concept Overview
The Path of Least Resistance indicator identifies key zones on your chart that act like "muddy" or "sticky" areas where price tends to get bogged down, creating choppy and unpredictable price action. Between these zones lie the "empty spaces" - clear paths where price can move freely with momentum and direction.
The Analogy: Muddy Fields vs Open Roads
Think of your chart like a landscape:
🟫 ZONES (Muddy/Sticky Areas)
Fair Value Gaps (FVGs) from higher timeframes
Pivot wick zones from higher timeframe pivots
Areas where price gets "stuck" and churns
Like walking through thick mud - slow, choppy, unpredictable movement
Price action becomes erratic and difficult to trade
🟢 EMPTY SPACES (Open Roads)
The clear areas between zones
Where price can move freely with momentum
Like driving on an open highway - smooth, directional movement
The "Path of Least Resistance" for price movement
Trading Philosophy
AVOID Trading Within Zones:
Price action is typically choppy and unpredictable
Higher probability of false signals and whipsaws
Like trying to drive through mud - you'll get stuck
TRADE Through the Empty Spaces:
Look for moves that travel between zones
Price tends to move with momentum and direction
Higher probability setups with cleaner price action
Like taking the highway instead of back roads
Zone Types Detected
Fair Value Gaps (FVGs)
Imbalances from higher timeframe candles
Areas where price "owes" a return visit
Often act as magnets, creating choppy price action
Pivot Wick Zones
Upper and lower wicks from higher timeframe pivots
Rejection areas where price previously struggled
Often create resistance/support that leads to choppy movement
Color Coding System
The zones dynamically change color based on current price position:
🔴 RED ZONES : Price is below the zone (bearish context)
🟢 GREEN ZONES : Price is above the zone (bullish context)
🔘 GRAY ZONES : Price is within the zone (neutral/choppy area)
The "Mum Trades" Strategy
The best trades - what we call "Mum trades" (trades so obvious even your mum could spot them) - happen in the empty spaces between zones:
✅ High Probability Characteristics:
Clear directional movement between zones
Less noise and false signals
Higher momentum and follow-through
Cleaner technical patterns
❌ Avoid These Areas:
Trading within the muddy zones
Expecting clean moves through sticky areas
Fighting against the natural flow of price
Key Features
Auto Timeframe Detection : Automatically selects appropriate higher timeframe
Dynamic Zone Management : Overlapping zones are automatically cleaned up
Real-time Alerts : Get notified when price enters/exits zones
Visual Clarity : Clean zone display with extending boundaries
How to Use
Identify the Zones : Let the indicator mark the muddy areas
Find the Paths : Look for clear spaces between zones
Plan Your Trades : Target moves that travel through empty space
Avoid the Mud : Stay away from trading within the zones
Follow the Flow : Trade with the path of least resistance
Remember
Price, like water, always seeks the path of least resistance. By identifying where that path is clear (empty spaces) versus where it's obstructed (zones), you can align your trading with the natural flow of the market rather than fighting against it.
The goal is simple: Trade the highways, avoid the mud.

4-EMA Signals + MTF Analysis4-EMA Signals + MTF Analysis Indicator: User Guide
This indicator is designed for active traders; from scalpers / intra-day traders to swing-traders who simply want an easy to understand, simple, but yet comprehensive and easy-to-understand indicator with a quick overview of initial market momentum and overall market direction to assist the trader in their initial trading.
The main feature of this indicator is that It overlays four exponential moving averages (EMAs), and provides a dashboard of real-time trend signals for both buy and sell (long/short) scenarios.
Settings Overview
MA Period Setup
Custom: Set your own EMA periods.
Conservative, Aggressive, Fibonacci: Quickly apply preset EMA period combinations for different trading styles.
EMA Periods (Custom Setup)
Fast EMA: Shortest EMA, reacts quickly to price (default 7).
Medium-Short EMA: Intermediate speed (default 25).
Medium-Long EMA: Slower, filters out more noise (default 70).
Slow EMA: Longest-term trend (default 200).
(These settings can be adjusted to suit your individual needs)
Main Indicator Features
Four EMAs : Plotted in distinct colors (green, yellow, orange, red) for quick trend recognition - this can be altered in colour to your personal preferences.
Buy/Sell Signals : Triangles appear below/above bars when EMA crossovers occur, optionally filtered by volume - the volume filter when applied greatly reduces the influx of signals, only giving high-quality signals!
Trading Sessions + Backgrounds : A trading session feature has been added: (London, New York, Asia, Sydney) with the choice of a background to indicate each global trading session.
Volume Overlay : Volume bars and a blue volume moving average line for context.
Dashboard Table (Top Right):
Market Direction: Shows the overall EMA alignment (bullish, bearish, weak, consolidating).
The initial trend on the 5m, 15m, 1H, and 4H time-frame to give a quick snapshot of overall trend direction.
How to Use
Trend Identification :
-- Use the EMA alignment and dashboard table to quickly see if the market is bullish, bearish, or consolidating.
EMA Set-up
-- Adjust the EMA settings to your specific requirements, the signals will alter depending on the volatility of the instrument your trading.
Signal Confirmation :
-- ''Buy'' signals simply appear when the faster EMAs cross above slower EMAs in and ''Sell'' signals simply appear when they cross below.
Volume Context :
--Use the volume moving average and the optional volume filter to avoid signals during low-activity periods.
No Repainting :
-- All signals and dashboard readings are calculated using only confirmed, closed bars. What you see in real time is exactly what will appear in your back-test — no repainting or look-ahead bias.
Alerts / Notifications
Now for the fun part:
1. Enable Buy/Sell Signal Alerts: Get notifications when buy or sell signals occur.
2. For Alerts to function correctly, set the ''condition'' to the indicator itself.
3. Select ''EMA Bearish Cross'' or ''EMA Bullish Cross'' depending whether you want alerts for either buy/sell signals - Or one can simply set alerts for both scenarios.
4. For ''Interval'' set to ''Same as chart'' - So, the time-frame which you'd like to trade on.
5. For ''Trigger'' set to ''Once Per Bar Close''.
6. Save.
7. Wait for a signal to occur!
NOTE: Before placing a trade, it's often best to also assess the market conditions at that time also - and not rely solely on the signals, the signals are to assist, and it's often occurred a signal has shown, but a pull-back occurs, and a FVG in discount holds -- it's this FVG holding, accompanied by volume, that's the real entry, possibly.
Tip: For the cleanest results, use the indicator during the most active sessions and always check multi-time-frame trend alignment before entering trades. Good Luck! :)

Anchored VWAP by Time (Math by Thomas)📄 Description
This tool lets you plot an Anchored Volume Weighted Average Price (VWAP) starting from any specific date and time you choose. Unlike standard VWAPs that reset daily or weekly, this version gives you full control to track institutional pricing zones from precise anchor points—such as key swing highs/lows, market open, or news-driven candles.
It’s especially useful for price action and Smart Money Concepts (SMC) traders who track liquidity, fair value gaps (FVGs), and institutional zones.
🇮🇳 For NSE India Traders
You can anchor VWAP to Indian market open (e.g., 9:15 AM IST) or major events like RBI policy, earnings, or breakout candles.
The time input uses UTC by default, so for Indian Standard Time (IST), remember:
9:15 AM IST = 3:45 AM UTC
3:30 PM IST = 10:00 AM UTC
⚙️ How to Use
Add the indicator to your chart.
Open the settings panel.
Under “Anchor Start Time”, choose the date & time to begin the VWAP.
Use UTC format (adjust from IST if needed).
Customize the line color and thickness to suit your chart style.
The VWAP will begin plotting from that time forward.
🔎 Best Use Cases
Track VWAP from intraday range breakouts
Anchor from swing highs/lows to identify mean reversion zones
Combine with your FVGs, Order Blocks, or CHoCHs
Monitor VWAP reactions during key macro events or expiry days
🔧 Clean Design
No labels are used, keeping your chart clean.
Works on all timeframes (1min to Daily).
Designed for serious intraday & positional traders.

US30 Smart Money 5M/4H Strategy🧠 How It Works
✅ 1. 4H Trend Bias Detection
Uses the 4-hour chart (internally) to determine if the market is in an uptrend or downtrend.
Background turns green for bullish trend, red for bearish trend.
This helps filter trades — only take longs during uptrend, shorts during downtrend.
✅ 2. Liquidity Sweeps (Stop Hunts) on 5M
Highlights candles that break previous highs/lows and then reverse (typical of institutional stop raids).
Draws a shaded red box above sweep-high candles and green box under sweep-lows.
These indicate key reversal zones.
✅ 3. Order Block Zones
Detects bullish/bearish engulfing patterns after liquidity sweeps.
Draws a supply or demand zone box extending forward.
These zones show where institutions likely placed large orders.
✅ 4. FVG Midpoint from 30-Min Chart
Detects Fair Value Gaps (imbalances) on the 30-minute chart.
Plots a line at the midpoint of the gap (EQ level), which is often revisited for entries or rejections.
✅ 5. Buy/Sell Signals (Non-Repainting)
Buy = 4H uptrend + 5M liquidity sweep low + bullish engulfing candle.
Sell = 4H downtrend + 5M liquidity sweep high + bearish engulfing.
Prints green “BUY” or red “SELL” label on the chart — these do not repaint.
📈 How to Use It
Wait for trend bias — only take trades in the direction of the 4H trend.
Watch for liquidity sweep boxes — these hint a stop hunt just occurred.
Look for a signal label (BUY/SELL) — confirms entry criteria.
Use FVG EQ lines & Order Block zones as confluence or targets.
Take trades after NY open (9:30 AM EST) for best momentum.

ICT Turtle Soup (Liquidity Reversal)ICT Turtle Soup — Liquidity Reversal Detection
Trap the Trap: A Precision Reversal Strategy from the Inner Circle Trader Playbook
This indicator implements the Turtle Soup liquidity reversal setup — a widely used ICT (Inner Circle Trader) concept that targets false breakouts beyond recent swing highs or lows. These patterns typically occur when price grabs liquidity above or below a known level, then snaps back, trapping retail traders and creating a high-probability reversal scenario.
🔍 What This Script Does:
Detects Liquidity Sweeps Above/Below Key Swing Levels
Uses a customizable swing lookback to identify recent swing highs and lows.
Triggers a Bearish Turtle Soup when price runs above a previous swing high and closes back below.
Triggers a Bullish Turtle Soup when price sweeps below a prior swing low and closes back above.
Plots Clear Visual Signals
Reversal signals appear as 🐢🔻 (Bearish) or 🐢🔺 (Bullish) markers directly on your chart.
Optional labels can be enabled for enhanced journaling and review.
Real-Time Alerts
Receive alert notifications when a Turtle Soup setup is detected — ideal for scalpers or intraday traders watching for reversals around liquidity pools.
⚙️ Customization Options:
Set the swing lookback sensitivity (default: 5)
Enable or disable labels
Choose label font size
Customize colors for bullish and bearish signals
💡 How to Use:
Deploy on intraday timeframes (e.g. 5m–15m) for high-resolution liquidity analysis.
Watch for signals at key highs/lows, session extremes, or zones where liquidity is likely resting.
Combine with tools like FVGs, Order Blocks, and OTE zones for layered confirmation.
🔗 Combine With These Tools for a Complete SMC Edge:
✅ First FVG — Opening Range Fair Value Gap Detector
✅ ICT SMC Liquidity Grabs + OB + Fibonacci OTE Levels
✅ Liquidity Levels — Smart Swing Lows
Together, these tools form a high-precision Smart Money toolkit — helping traders map, anticipate, and act on institutional-level liquidity events with clarity and confidence.

ICT Turtle Soup (Liquidity Reversal)ICT Turtle Soup — Liquidity Reversal Detection
Classic Liquidity Trap Reversal Strategy for Smart Money Traders
This indicator implements the ICT Turtle Soup concept — a classic liquidity-based reversal pattern — which occurs when price runs above or below a recent swing level to grab liquidity, then sharply reverses. This pattern is commonly used in Smart Money Concepts (SMC) and Inner Circle Trader (ICT) strategies to anticipate false breakouts and high-probability reversals.
🔍 What This Script Does:
Identifies Swing Highs & Lows
Detects recent swing highs and lows using a customizable lookback period.
Tracks Liquidity Grabs
A bearish Turtle Soup setup is triggered when price breaks above a recent swing high but closes back below it.
A bullish Turtle Soup setup is triggered when price breaks below a recent swing low but closes back above it.
These conditions often signal liquidity traps, where price sweeps resting orders before reversing.
Plots Signals Directly on the Chart
Turtle Soup setups are marked with 🐢🔻 (bearish) and 🐢🔺 (bullish) labels.
Optional full-text labels can also be displayed for clarity and journaling.
Includes Alert Conditions
Alerts can be enabled to notify you of bullish or bearish Turtle Soup reversals in real-time.
⚙️ Customization Features:
Adjustable swing lookback period
Enable/disable Turtle Soup labels
Set label font size
Choose your preferred bullish/bearish signal colors
💡 How to Use:
Add this script to your chart (ideally on intraday timeframes such as 5m–15m).
Wait for a Turtle Soup signal near a key swing high/low or liquidity zone.
Combine with other confirmation tools (e.g., FVGs, Order Blocks, OTE) for stronger setups.
Use alerts to stay ahead of fast-moving reversals.
🧠 Why It Works:
Turtle Soup setups are rooted in liquidity theory — they exploit the market’s tendency to sweep obvious swing levels before reversing. These moves often trap retail traders and mark the beginning of Smart Money entries.
🔗 Best Used With:
Maximize the edge by combining this with other SMC tools:
✅ First FVG — Opening Range Fair Value Gap Detector
✅ ICT SMC Liquidity Grabs + OB + Fibonacci OTE Levels
✅ Liquidity Levels — Smart Swing Lows
Together, they create a complete ecosystem for identifying, confirming, and executing liquidity-driven trade setups with precision.

Nef33 Forex & Crypto Trading Signals PRO
1. Understanding the Indicator's Context
The indicator generates signals based on confluence (trend, volume, key zones, etc.), but it does not include predefined SL or TP levels. To establish them, we must:
Use dynamic or static support/resistance levels already present in the script.
Incorporate volatility (such as ATR) to adjust the levels based on market conditions.
Define a risk/reward ratio (e.g., 1:2).
2. Options for Determining SL and TP
Below, I provide several ideas based on the tools available in the script:
Stop Loss (SL)
The SL should protect you from adverse movements. You can base it on:
ATR (Volatility): Use the smoothed ATR (atr_smooth) multiplied by a factor (e.g., 1.5 or 2) to set a dynamic SL.
Buy: SL = Entry Price - (atr_smooth * atr_mult).
Sell: SL = Entry Price + (atr_smooth * atr_mult).
Key Zones: Place the SL below a support (for buys) or above a resistance (for sells), using Order Blocks, Fair Value Gaps, or Liquidity Zones.
Buy: SL below the nearest ob_lows or fvg_lows.
Sell: SL above the nearest ob_highs or fvg_highs.
VWAP: Use the daily VWAP (vwap_day) as a critical level.
Buy: SL below vwap_day.
Sell: SL above vwap_day.
Take Profit (TP)
The TP should maximize profits. You can base it on:
Risk/Reward Ratio: Multiply the SL distance by a factor (e.g., 2 or 3).
Buy: TP = Entry Price + (SL Distance * 2).
Sell: TP = Entry Price - (SL Distance * 2).
Key Zones: Target the next resistance (for buys) or support (for sells).
Buy: TP at the next ob_highs, fvg_highs, or liq_zone_high.
Sell: TP at the next ob_lows, fvg_lows, or liq_zone_low.
Ichimoku: Use the cloud levels (Senkou Span A/B) as targets.
Buy: TP at senkou_span_a or senkou_span_b (whichever is higher).
Sell: TP at senkou_span_a or senkou_span_b (whichever is lower).
3. Practical Implementation
Since the script does not automatically draw SL/TP, you can:
Calculate them manually: Observe the chart and use the levels mentioned.
Modify the code: Add SL/TP as labels (label.new) at the moment of the signal.
Here’s an example of how to modify the code to display SL and TP based on ATR with a 1:2 risk/reward ratio:
Modified Code (Signals Section)
Find the lines where the signals (trade_buy and trade_sell) are generated and add the following:
pinescript
// Calculate SL and TP based on ATR
atr_sl_mult = 1.5 // Multiplier for SL
atr_tp_mult = 3.0 // Multiplier for TP (1:2 ratio)
sl_distance = atr_smooth * atr_sl_mult
tp_distance = atr_smooth * atr_tp_mult
if trade_buy
entry_price = close
sl_price = entry_price - sl_distance
tp_price = entry_price + tp_distance
label.new(bar_index, low, "Buy: " + str.tostring(math.round(bull_conditions, 1)), color=color.green, textcolor=color.white, style=label.style_label_up, size=size.tiny)
label.new(bar_index, sl_price, "SL: " + str.tostring(math.round(sl_price, 2)), color=color.red, textcolor=color.white, style=label.style_label_down, size=size.tiny)
label.new(bar_index, tp_price, "TP: " + str.tostring(math.round(tp_price, 2)), color=color.blue, textcolor=color.white, style=label.style_label_up, size=size.tiny)
if trade_sell
entry_price = close
sl_price = entry_price + sl_distance
tp_price = entry_price - tp_distance
label.new(bar_index, high, "Sell: " + str.tostring(math.round(bear_conditions, 1)), color=color.red, textcolor=color.white, style=label.style_label_down, size=size.tiny)
label.new(bar_index, sl_price, "SL: " + str.tostring(math.round(sl_price, 2)), color=color.red, textcolor=color.white, style=label.style_label_up, size=size.tiny)
label.new(bar_index, tp_price, "TP: " + str.tostring(math.round(tp_price, 2)), color=color.blue, textcolor=color.white, style=label.style_label_down, size=size.tiny)
Code Explanation
SL: Calculated by subtracting/adding sl_distance to the entry price (close) depending on whether it’s a buy or sell.
TP: Calculated with a double distance (tp_distance) for a 1:2 risk/reward ratio.
Visualization: Labels are added to the chart to display SL (red) and TP (blue).
4. Practical Strategy Without Modifying the Code
If you don’t want to modify the script, follow these steps manually:
Entry: Take the trade_buy or trade_sell signal.
SL: Check the smoothed ATR (atr_smooth) on the chart or calculate a fixed level (e.g., 1.5 times the ATR). Also, review nearby key zones (OB, FVG, VWAP).
TP: Define a target based on the next key zone or multiply the SL distance by 2 or 3.
Example:
Buy at 100, ATR = 2.
SL = 100 - (2 * 1.5) = 97.
TP = 100 + (2 * 3) = 106.
5. Recommendations
Test in Demo: Apply this logic in a demo account to adjust the multipliers (atr_sl_mult, atr_tp_mult) based on the market (forex or crypto).
Combine with Zones: If the ATR-based SL is too wide, use the nearest OB or FVG as a reference.
Risk/Reward Ratio: Adjust the TP based on your tolerance (1:1, 1:2, 1:3)

Market DNA: Structure, Volume, Range, and SessionsMarket DNA: Structure, Volume, Range, and Sessions**
The Market DNA indicator combines market structure, volume analysis, trading ranges, and global trading sessions into a single, comprehensive tool for traders. It helps identify key price levels, volume patterns, consolidation phases, and active market periods, enabling informed trading decisions.
Market Structure Detects swing highs and lows using `ta.pivothigh` and `ta.pivotlow`, plotting them as red/green triangles to highlight support/resistance and trend reversals.
- Fractal Volume Zones (FVG): Highlights areas of significant buying/selling pressure by comparing current volume to an average over a lookback period; high-volume zones are marked with a semi-transparent blue background.
- Trading Range: Defines a price channel using the Average True Range (ATR) and a multiplier, creating upper/lower bands to identify consolidation, breakouts, and potential trade levels.
- Market Sessions: Highlights major global trading sessions (Asia, Europe, US) with colored backgrounds (purple, teal, yellow) to indicate liquidity and volatility shifts.
How It Works
- Swing points help analyze trends and reversals.
- FVG confirms price movements with high volume for stronger signals.
- Trading range bands assist in identifying breakout opportunities and setting stops/take-profits.
- Session highlights allow traders to adapt strategies based on regional activity.
Customization
- Adjust `swing_length` for sensitivity in detecting turning points.
- Modify `volume_lookback` to control volume averaging.
- Tune `range_multiplier` for wider/narrower trading bands.
- Enable/disable session highlighting via `session_highlight`.
Use Cases
- Identify trends and key levels using swing points and FVG.
- Spot breakout opportunities with trading range bands.
- Adapt strategies to regional trading sessions for optimal timing.
This all-in-one indicator provides a clear, customizable view of the market, empowering traders to make data-driven decisions across asset classes and timeframes.

LRLR [TakingProphets]LRLR (Low Resistance Liquidity Run) Indicator
This indicator identifies potential liquidity runs in areas of low resistance, based on ICT (Inner Circle Trader) concepts. It specifically looks for a series of unmitigated swing highs in a downtrend that form without any bearish fair value gaps (FVGs) between them.
What is an LRLR?
- A Low Resistance Liquidity Run occurs when price creates a series of lower highs without any bearish fair value gaps in between
- The absence of bearish FVGs indicates there is no significant resistance in the area
- These formations often become targets for smart money to collect liquidity above the swing highs
How to Use the Indicator:
1. The indicator will draw a diagonal line connecting a series of qualifying swing highs
2. A small "LRLR" label appears to mark the pattern
3. These areas often become targets for future price moves, as they represent zones of accumulated liquidity with minimal resistance
Key Points:
- Minimum of 4 consecutive lower swing highs
- No bearish fair value gaps can exist between these swing highs
- The diagonal line helps visualize the liquidity run formation
- Can be used for trade planning and identifying potential reversal zones
Settings:
- Show Labels: Toggle the "LRLR" label visibility
- LRLR Line Color: Customize the appearance of the diagonal line
Best Practices:
1. Use in conjunction with other ICT concepts and market structure analysis
2. Pay attention to how price reacts when returning to these levels
3. Consider these areas as potential targets for smart money liquidity grabs
4. Most effective when used on higher timeframes (4H and above)
Note: This is an educational tool and should be used as part of a complete trading strategy, not in isolation.

Smart Money Concepts (Advanced)Inspired and initially based on LuxAlgo's Smart Money Concepts Indicator I created a library lib_smc that started to convert every function and return objects. This allowed certain customizations like tracking the current fill level of FVGs or tracking the creation of Order Blocks, by monitoring consecutive bars against the current trend.
This indicator is provided as is, based on, but probably not always be up to date with my lib_smc that I am using for my projects.
WARNING: This indicator shows EXPERIMENTAL Order Blocks that are tracked LIVE. Unlike usual Order Blocks these are not just based on the last confirmed Swing Point (formed 50 bars before) but on consecutive candles opposing an unconfirmed trend. Blocks are confirmed by price movements relative to the unconfirmed block and unconfirmed swing points. This means that some Order Blocks will appear on pullbacks, as well as reversals.
Features
Swing Points (HH / LH / HL / LL), indicating support / resistance zones price might reject off of or want to push through
Market Structure (BOS / ChoCh), indicates confirmation for a continued / changing trend
live Order Blocks (OB), see warning above.
Fair Value Gaps (FVG), optional from higher timeframes
Equal Highs / Lows (EQH/EQL), indicates strong support / resistance zones, especially when the bars forming it have long wicks toward that zone
using my lib_no_delay all moving averages are working from bar 0, so it can be used on charts with limited bars

Enhanced London Session SMC SetupEnhanced London Session SMC Setup Indicator
This Pine Script-based indicator is designed for traders focusing on the London trading session, leveraging smart money concepts (SMC) to identify potential trading opportunities in the GBP/USD currency pair. The script uses multiple techniques such as Order Block Detection, Imbalance (Fair Value Gap) Analysis, Change of Character (CHoCH) detection, and Fibonacci retracement levels to aid in market structure analysis, providing a well-rounded approach to trade setups.
Features:
London Session Highlight:
The indicator visually marks the London trading session (from 08:00 AM to 04:00 PM UTC) on the chart using a blue background, signaling when the high-volume, high-impulse moves tend to occur, helping traders focus their analysis on this key session.
Order Block Detection:
Identifies significant impulse moves that may form order blocks (supply and demand zones). Order blocks are areas where institutions have executed large orders, often leading to price reversals or continuation. The indicator plots the high and low of these order blocks, providing key levels to monitor for potential entries.
Imbalance (Fair Value Gap) Detection:
Detects and highlights price imbalances or fair value gaps (FVG) where the market has moved too quickly, creating a gap in price action. These areas are often revisited by price, offering potential trade opportunities. The upper and lower bounds of the imbalance are visually marked for easy reference.
Change of Character (CHoCH) Detection:
This feature identifies potential trend reversals by detecting significant changes in market character. When the price action shifts from bullish to bearish or vice versa, a CHoCH signal is triggered, and the corresponding level is marked on the chart. This can help traders catch trend reversals at key levels.
Fibonacci Retracement Levels:
The script calculates and plots the key Fibonacci retracement levels (0.618 and 0.786 by default) based on the highest and lowest points over a user-defined swing lookback period. These levels are commonly used by traders to identify potential pullback zones where price may reverse or find support/resistance.
Directional Bias Based on Market Structure:
The indicator provides a market structure analysis by comparing the current highs and lows to the previous periods' highs and lows. This helps in identifying whether the market is in a bullish or bearish state, providing a clear directional bias for trade setups.
Alerts:
The indicator comes with built-in alert conditions to notify the trader when an order block, imbalance, CHoCH, or other significant price action event is detected, ensuring timely action can be taken.
Ideal Usage:
Timeframe: Suitable for intraday trading, particularly focusing on the London session (08:00 AM to 04:00 PM UTC).
Currency Pair: Specifically designed for GBP/USD but can be adapted to other pairs with similar market behavior.
Trading Strategy: Best used in conjunction with a price action strategy, focusing on the key levels identified (order blocks, FVG, CHoCH) and using Fibonacci retracement levels for precision entries.
Target Audience: Ideal for traders who follow smart money concepts (SMC) and are looking for a structured approach to identify high-probability setups during the London session.

ICT HTF Candles [Source Code] (fadi)Plotting a configurable higher timeframe on current chart's timeframe helps visualize price movement without changing timeframes. It also plots FVG and Volume Imbalance on the higher timeframe for easier visualization.
With ICT concepts, we usually wait for HTF break of structure and then find an entry on a lower timeframe. With this indicator, we can set it to the HTF and watch the develop of price action until the break of structure happens. We can then take an entry on the current timeframe.
Settings
HTF Higher timeframe to plot
Number of candles to display The number of higher timeframe candles to display to the right of current price action
Body/Border/Wick The candle colors for the body, border, and wick
Padding from current candles The distance from current timeframe's candles
Space between candles Increase / decrease the candle spacing
Candle width The size of the candles
Imbalance
Fair Value Gap Show / Hide FVG on the higher timeframe
Volume Imbalance Show / Hide Volume Imbalance on the higher timeframe
Trace
Trace lines Extend the OHLC lines of the higher timeframe and the source of each
Label Show/Hide the price levels of the OHLC

Liquidity Levels/Voids (VP) [LuxAlgo]The Liquidity Levels/Voids (VP) is a script designed to detect liquidity voids & levels by measuring traded volume at all price levels on the market between two swing points and highlighting the distribution of the liquidity voids & levels at specific price levels.
🔶 USAGE
Liquidity is a fundamental market force that shapes the trajectory of assets.
The creation of a liquidity level comes as a result of an initial imbalance of supply/demand, which forms what we know as a swing high or swing low. As more players take positions in the market, these are levels that market participants will use as a historical reference to place their stops. When the levels are then re-tested, a decision will be made. The binary outcome here can be a breakout of the level or a reversal back to the mean.
Liquidity voids are sudden price changes that occur in the market when the price jumps from one level to another with little trading activity (low volume), creating an imbalance in price. The price tends to fill or retest the liquidity voids area, and traders understand at which price level institutional players have been active.
Liquidity voids are a valuable concept in trading, as they provide insights about where many orders were injected, creating this inefficiency in the market. The price tends to restore the balance.
🔶 SETTINGS
The script takes into account user-defined parameters and detects the liquidity voids based on them, where detailed usage for each user-defined input parameter in indicator settings is provided with the related input's tooltip.
🔹 Liquidity Levels / Voids
Liquidity Levels/Voids: Color customization option for Unfilled Liquidity Levels/Voids.
Detection Length: Lookback period used for the calculation of Swing Levels.
Threshold %: Threshold used for the calculation of the Liquidity Levels & Voids.
Sensitivity: Adjusts the number of levels between two swing points, as a result, the height of a level is determined, and then based on the above-given threshold the level is checked if it matches the liquidity level/void conditions.
Filled Liquidity Levels/Voids: Toggles the visibility of the Filled Liquidity Levels/Voids and color customization option for Filled Liquidity Levels/Voids.
🔹 Other Features
Swing Highs/Lows: Toggles the visibility of the Swing Levels, where tooltips present statistical information, such as price, price change, and cumulative volume between the two swing levels detected based on the detection length specified above, Coloring options to customize swing low and swing high label colors, and Size option to adjust the size of the labels.
🔹 Display Options
Mode: Controls the lookback length of detection and visualization.
# Bars: Lookback length customization, in case Mode is set to Present.
🔶 RELATED SCRIPTS
Liquidity-Voids-FVG
Buyside-Sellside-Liquidity
Swing-Volume-Profiles

KeitoFX Dynamic Indicator Free vers.This script represents a versatile dynamic indicator called "KeitoFX Dynamic Indicator Free version." It is developed by the author "KeitoFX" and operates as a custom indicator overlaying on financial charts. The indicator utilizes a unique algorithm to dynamically identify bullish and bearish candlestick patterns with specific criteria.
Key Features:
- The indicator visually marks bullish and bearish candlestick patterns using triangle shapes, providing quick visual cues to traders.
- Bullish patterns are detected when the closing price is higher than the opening price and the high and low prices of the candlestick form a narrow range.
- Bearish patterns are identified when the closing price is lower than the opening price, and the high and low prices also form a narrow range.
The indicator incorporates flexible settings that users can customize to fit their trading preferences:
- Users can choose the table's placement, either at the "Top Right," "Middle Right," or "Bottom Right" of the chart.
- Customizable dimensions for the width and height of the table are available.
- Adjustable text size settings ranging from "Auto" to "Huge" are provided for the displayed text.
- A descriptive table containing trading rules and conditions is optionally displayed below the price chart.
Additional Information:
- The indicator's color scheme is harmonious, with shades of purple and neutral tones.
- The "Require FVG" setting influences the pattern detection's sensitivity.
- A dynamic standard deviation is calculated based on the selected displacement settings and historical candle ranges.
- A "FVG" condition enhances pattern accuracy.
- Bullish and bearish pattern detection includes overlapping with other predefined arrays to increase pattern significance.
Note:
This indicator is provided under the Mozilla Public License 2.0, as indicated by the source code comment at the beginning of the script. Users are encouraged to review and comply with the license terms when using this indicator in their trading activities.

itradesize /\ Overnight Session & Silver BulletOvernight Session & Silver Bullet indicator
The indicator can be divided into two separate stuff:
ONS ( Overnight Session ) based on TCM’s ( TheCurrencyMerchant ) theory and Silver Bullet based on what ICT ( InnerCircleTrader ) is teaching to us.
Overnight Session
• ONS will be always based on Chicago 4am to 8am time according to TCM’s CME teaching.
The indicator has the option to show TSO ( Today’s session only ) which is good to have the chart not messed up by it. At this time when it comes to backtesting just turn this off to have the past ONS and SB ranges showed up on your chart.
• Mid line at the ONS range is useful to have as you are able to decide wether price is in a premium or a discount under the ONS.
If Im a buyer target is above the range, if Im a seller target is below the range.
• You are also able to have SD ( Standard Deviation ) lines for price projections. In the variety of TCM’s videos you are able to have a deeper knowledge.
• You can also extend Today’s ONS lines to the very end of the chart which could make an easier looking on the levels you eyeing with.
Silver Bullet
It’s based on New York time as ICT ( Inner Circle Trader ) is always teaching to us that we should use New York time, every time when it comes to his concepts.
Silver Bullets are always be there aiming of an opposing liquidity pool. They are working even on choppy days.
Silver Bullet hours:
• 03:00 - 04:00am NY Time
• 10:00 - 11:00am NY Time
• 02:00 - 03:00pm NY Time
SB highlighted areas could be shown as a box or a range according to your taste, with or without Start/End lines.
Both of them ca be used to form trades.
You should dig yourself into Silver Bullet ( InnerCircleTrader ) and Overnight Session ( TheCurrencyMerchant ) teachings before the use of the indicator.
Simple setups
• Silver Bullet
Look 20-30 minutes before any SB where the Buy or Sell program has started.
Where the first 1m FVG ( Fair Value Gap ) appears under the range, enter the trade.
Expect only a 5 handle move as a beginner.
1m chart is a must for these kind of FVG entries. ( 30s , 15s can also be used )
• ONS
Price is trading aggressively out of the range to take liquidity.
Once price grabbed liquidity that candle on the 3-5m could considered as on order block for the further movement.
If you are trading in the range, then the opposite side can be the target, if its out of the range and trading one sided, then use standard deviations as 0.5 is a minimum target.

SMC Pro (Wellington) v1.4.2This SMC indicator combines BOS/CHoCH, OBs, FVGs, liquidity, and Premium/Discount with confirmation on the 1H (EMA200).
Entries only appear when 3+ confluences align, filtering noise and delivering clear signals.
✅ Ready-to-use alerts (LONG, SHORT, or unified)
✅ Real-time HUD
✅ Strategy tailored for XAUUSD
