Opening Range & Prior Day High/Low [Gorb]Introduction:
Opening Range & Prior Day High/Low indicator is an easy to use day traders tool. This indicator automatically plots the previous days high and low, as well as drawing a box from the opening range that the user specifies in the settings. These two together can help provide an indication of market sentiment and price trends for the day. They are often used as a trading strategy for day traders.
Overview:
The Opening Range , draws a box from the high to the low of the user defined time period and is extended until the end of the trading session. Most common are the 5/15/30min opening ranges.
Prior Day High/Low , draws lines from the previous days high and low that extend across the current session. These are used as support/resistance and also a marker to see market sentiment by crossing one of these levels.
The indicator is designed for all kinds of traders, offering a simple approach to automatically plot levels for you.
Features:
All skill-level friendly presets, easy to enable with one-click
Opening Range: Allows user to choose what time the range starts and ends to measure the high & low.
Extend Range Lines: allows the user to choose when the box stops extending according to the trading session time.
Enable Opening Range Box: allows the user to choose to plot the opening range or not.
ORB Border Color: allows the user to change the box border color.
ORB Box Shade Color: allows the user to change the background of the opening range box.
ORB Line Width: allows users to chose the width of the opening range box lines.
Enable Previous Day High: allows users to enable the previous days high to be plotted.
Enable Previous Day Low: allows users to enable the previous days high to be plotted.
Previous Day High Color: allows users to choose the color for this line.
Previous Day Low Color: allows users to choose the color for this line.
All colors are changeable for the user to customize to their liking.
Usage Demonstration
In the image below, we can see a basic example of how these 3 features function.
As explained above, the opening range is customizable to meet the users needs and can be disabled with one click. Same goes for the prior day high(green) and low(red) lines. All 3 are plotted each day automatically for the user if enabled.
In the image below, we can see an example of using the opening range break and prior day high together for a trading strategy.
This is a great example of using the prior day high with the opening range to use as a day trading strategy. It provides the trader with levels to watch for price to break out from for possible trade setups.
In this next image, we can see a failed breakdown from the opening range that results in a bullish breakout.
The first move was a fake breakdown with the failed rejection on the retest of the opening range lows. This led to a breakout above the range and a confirmation bounce on the breakout retest. Price did break above the prior day high and confirmed with a retest bounce on that level as well.
In the image below, we can see how previous days levels can act as resistance to use with the opening range.
Price didn't reject the opening range low, but it did reject the prior day high for the second time. This could be used as an entry or once price breaks down out of the opening range again.
Conclusion:
We believe in providing user-friendly tools to help speed up traders technical analysis and implement easy trading strategies. The goal is to provide a user-friendly indicator to automatically draw opening ranges and previous days levels to suit the users needs and trading style.
RISK DISCLAIMER
All content, tools, scripts & education provided by Monstanzer or Gorb Algo LLC are for informational & educational purposes only. Trading is risk and most lose their money, past performance does not guarantee future results.
ค้นหาในสคริปต์สำหรับ "breakout"

Bjorgum Key Levels
Key Levels Aims to capture 3 of the most significant points in price action
Breakouts
False Breakouts (Traps)
Back Checks
These 3 points alone, if properly identified, can be some of the most significant points of movement in the price history of an asset and bring significant gains to traders, if capitalized on. Here are a few examples of these setups
Breakouts
Breakouts can bring significant rallies as the market swings one sided after key levels are breached. This entry type can bring large trending runs to follow. Momentum is on your side, but the trade off is a higher entry.
False Breakouts
Also known as a bull trap or a bear trap, false breaks can lead to swift and significant reversals and potential for a large and sudden move to the opposite side. When a key level breakout fails to hold, parties entering to capitalize on the "epic breakout" can get left holding the bag forcing them to exit at a loss, which can double the force of pressure. Traps can bring swift gains from good entry prices. However, price is still in a larger trend against you so momentum is weak, so price action is susceptible to roll over.
Backchecks
Back checks are pull backs in trend that find middle ground to the 2 areas already described. Both momentum and entry price are decent, but risk is defined as a key level has flipped offering entry with stops below demand, or above supply.
Combining these 3 methods helps to diversify risk, understand trend development, and bring steady gains. This script helps to identify these points to traders with analysis of key levels, price structure, and trend direction, while providing visual signals and alerts for when they occur.
Best of luck in your coding and trading and thank you for your support

Volume Positive Negative (VPN) [LevelUp]The idea and calculations for the Volume Positive Negative (VPN) indicator were created by Markos Katsanos. Markos wrote about the indicator in the article Detecting High-Volume Breakouts, published in Technical Analysis of Stocks & Commodities April, 2021 (Vol. 39, Issue 5).
The goal of the VPN indicator is to detect breakouts using only volume. The basic idea is to compare volume on up days versus volume on down days. The indicator can oscillate between the range of -100 and 100. Values between 0 and 20 are generally considered bullish, negative are bearish.
When the plotted VPN crosses over what Markos refers to as the critical value, that may indicate a high volume breakout. The critical value can be adjusted between 0 to 20, 10 is the default,
Volume Positive Negative Calculation (VPN)
VPN = (VP - VN) / MAV / Period * 100
VP - sum of positive volume
VN - sum of negative volume
MAV - moving average of volume
Volume is considered positive when the average price is higher than the previous day's price by more than .1 of the ATR (average true range).

Trinity Bollinger Bands Pro with BreakoutsTrinity Bollinger Bands Pro Indicator
The **Trinity Bollinger Bands Pro + Triple Bands & Expansion** is a highly customized, advanced volatility and breakout indicator built on the classic Bollinger Bands framework. It expands the standard single-pair bands into **three independent deviation levels** (typically 1σ, 2σ, and 3σ) around a user-selectable moving average basis (default EMA 20). This creates clear "zones" of volatility, with dynamic trend-based coloring, layered fills, fixed-style labels, and a statistical volatility expansion detector shown as a directional background highlight in a separate pane. The result is a visually intuitive tool that helps traders identify consolidation, building momentum, confirmed trends, and rare explosive moves with high-probability filtering.
### Why It's Good and Different from Standard Indicators
This indicator stands out by addressing common limitations of traditional Bollinger Bands and multi-deviation scripts:
- **Layered statistical significance**: Unlike single (2σ) or basic double-band setups, it provides three distinct levels—early momentum (1σ), standard confirmation (2σ), and extreme/rare breakouts (3σ)—making it easier to stage trades progressively rather than relying on one ambiguous cross.
- **Trend-aware visuals**: Bands, basis, and fills change color based on price position relative to a separate trend MA, giving immediate bullish/bearish bias without needing additional indicators.
- **Clean, fixed labels**: Tiny, arrow-pointing labels ("1/2/3 SD Above/Below", "BB Basis") with consistent colors (purple upper, blue lower, yellow basis) provide instant identification
- **Statistical expansion detection**: Uses percentile ranking of band width "bell curve" concept" to identify abnormally high volatility, triggering directional background highlights (green bullish, red bearish) earlier than raw width spikes.
- **Reduced noise and fakeouts**: Tiered breakouts + expansion filter focus alerts on high-probability moves, unlike most BB scripts that flood signals on every touch.
Compared to popular public scripts (e.g., standard Bollinger Bands, Triple BB variants, or separate BBW Percentile tools), this combines everything into one cohesive indicator with superior visual clarity and statistical rigor.
### Key Features
- **Triple customizable bands**: Enable/disable and adjust multipliers for 1σ (early), 2σ (confirmed), 3σ (extreme) deviations.
- **Trend-based dynamic coloring**: Separate editable colors for each band set (bullish/bearish).
- **Layered zone fills**: Colored between bands with transparency, reflecting current trend.
- **Fixed tiny labels**: All left-pointing arrows with purple (upper), blue (lower), yellow (basis) backgrounds for quick reference.
- **Statistical expansion overlay**: with directional background (green/red) during extreme volatility expansions (earlier trigger using 2σ width).
- **Tiered alerts**: Early (Band 1), Confirmed (Band 2), Extreme (Band 3), High-Probability (Extreme + expansion), and general expansion alerts.
- **Fully configurable basis**: Length, type (SMA/EMA/WMA/RMA), and thin fixed lines for minimal clutter.
### How Traders Can Use It
- **Spot squeezes and breakouts**: Watch for tight bands (low width) → expansion background → price closing outside Band 1 (early entry), Band 2 (add/confirm), Band 3 (strong trend conviction).
- **Filter fakeouts**: Only act on crosses accompanied by expansion background color matching trend direction—dramatically reduces whipsaws.
- **Trend riding**: Price "walking" colored bands (e.g., hugging upper purple-label bands in green background = strong bullish momentum).
- **Scalping/intraday**: On lower timeframes (e.g., 10min), use early Band 1 signals with expansion for quick moves.
- **Swing/position trading**: Wait for Band 3 extreme breakout + colored background for higher-probability, larger moves.
- **Risk management**: Place stops near basis or inner band; trail using outer bands during expansions.
Overall, this indicator excels at turning volatility into actionable, staged signals with visual simplicity—ideal for traders seeking an edge in identifying real explosive trends over noise. It's particularly powerful on volatile stocks like AMD/INTC or indices during news/events.

Advanced Volume Suite (24h, Pulse, Spikes, Breakout Pressure)Advanced Volume Suite transforms raw volume into a complete market-intelligence toolkit for breakout, momentum, and liquidity-driven trading.
Unlike the basic volume indicator, this tool analyzes volume in true USDT value, tracks rolling 24h exchange-style volume, measures volume strength vs historical averages, detects smart spikes, and highlights breakout pressure near support/resistance.
Core Features:
• USDT-based volume histogram
• 24h rolling volume line
• Volume Pulse (volume vs moving average)
• Smart spike detection with directional filters
• Breakout pressure system (breakouts + near-breakout conditions)
• 3 advanced volume color modes (Simple / Body / Delta-style)
• All signals and thresholds fully configurable
Perfect for traders who rely on volume confirmation for breakouts, momentum entries, scalping, or detecting institutional activity.

PDH/PDL Breakout Pip MeasurerThis indicator measures the maximum distance (in pips or points) that price travels after breaking through the Previous Day's High (PDH) or Previous Day's Low (PDL), before returning to a user-defined stop loss level. It provides statistical insights into breakout behavior for systematic trading analysis.
Input Parameters
Pip Multiplier: Adjust for different instruments (0.0001 for Forex, 1 for indices)
Bull Stop Loss Pips: Distance below PDH to define stop loss for bull breakouts
Bear Stop Loss Pips: Distance above PDL to define stop loss for bear breakouts
Show Table: Toggle statistics table display
Show Labels: Display pip measurements on chart
Show Levels: Toggle PDH/PDL level visibility
Statistics Table Includes
Total breakout counts (Bull/Bear/Combined)
Average pip distance per breakout type
Minimum and maximum recorded moves
Currently active breakout measurement

Low Volatility Breakout + TP/SL Levels█ OVERVIEW
"Low Volatility Breakout + TP/SL Levels" is a breakout indicator designed to detect and trade breakouts from periods of low volatility (consolidation). Unlike classic strategies based on fixed support/resistance levels, this indicator dynamically identifies consolidations characterized by small candle bodies and only generates a signal when the breakout occurs with a large, decisive candle. It also automatically plots 3 Take Profit levels and a Stop Loss (with two calculation modes), making it a complete breakout trading tool.
█ CONCEPTS
The strongest market moves most often start after a prolonged period of very low volatility — when candles become small and the market "falls asleep". The indicator first detects such consolidations (small bodies for at least X bars), draws a box around them, and then waits for a breakout with a candle significantly larger than the average. Additional filters (e.g., the box height cannot exceed the average candle body by too much) eliminate false consolidations and volatility traps. Immediately after the breakout, TP1, TP2, TP3, and SL levels are plotted.
█ FEATURES
Dynamic detection of low-volatility consolidations
- candles with small bodies (< average body × consolidationMultiplier)
- minimum number of bars in consolidation: confirmBars (default 5)
Automatic drawing of consolidation boxes
- green (bullish) or red (bearish) with transparent background (85)
- adjustable border thickness (border_width 1–5)
- box height filter (boxHeightMultiplier, default 6.0 × average body) – removes overly stretched/false consolidations
Breakout conditions
- current candle must be larger than average body × threshold (default 1.5)
- must be the largest candle in the entire consolidation
- must close above the highest high (long) or below the lowest low (short)
Breakout signals
- small green triangles below the bar (long)
- small red triangles above the bar (short)
Automatic Take Profit and Stop Loss levels (drawn 5 bars forward)
- two calculation modes:
• Candle Multiplier – based on average true range (high-low) over tp_sl_length period
• Percentage – fixed percentage from breakout close price (percentages must be manually adjusted to the asset and timeframe)
- 3 TP levels (default 2×, 3×, 4× or 2%, 3%, 4%)
- 1 SL level (default 2× or 1.5%)
Live TP/SL price table (top-right corner)
- displays exact current values of SL, TP1, TP2, TP3 immediately after each new signal
- colors identical to drawn lines (red background for SL, green for TP levels)
- updates automatically with every new breakout
Built-in alerts
- “Bullish Breakout Alert” and “Bearish Breakout Alert”
█ HOW TO USE
Add the indicator to your TradingView chart → Indicators → search “Low Volatility Breakout + TP/SL Levels”.
After each valid breakout you will immediately see:
- the colored box
- signal triangle
- horizontal TP/SL lines
- updated table in the top-right corner showing precise price levels for the current trade
Key settings to adjust:
Consolidation Settings
- Volatility Window (length) – period for average body calculation (default 20)
- Consolidation Multiplier – how small bodies must be to count as consolidation (default 2.0)
- Breakout Multiplier – minimum size of breakout candle (default 1.5)
- Box Height Multiplier – maximum allowed box height (default 6.0)
- Min Consolidation Bars – minimum bars required (default 5)
Risk Management Settings
- Choose TP/SL mode: Candle Multiplier or Percentage
- Adjust TP1–3 and SL multipliers/percentages to match your risk management style
Signal interpretation:
- Green triangle below bar + green box + green TP levels in table = long signal
- Red triangle above bar + red box + red SL level in table = short signal
- Boxes remain on chart until broken — they highlight accumulation/distribution zones
█ APPLICATIONS
- Trading breakouts from consolidation on all markets and timeframes
- Recommended to trade in the direction of the higher-timeframe trend or with additional confirmations (e.g., key level breaks). Aggressive mode (trading both directions) is also possible — provided box and TP/SL settings are properly optimized
- Experiment with different TP/SL ratios — higher reward-to-risk setups (e.g., SL 1×, TP3 6–8×) with lower win rate are often more profitable in the long run
- Strongly encourage testing various box parameters (consolidationMultiplier, boxHeightMultiplier, confirmBars) — small changes can dramatically affect signal frequency and quality
█ NOTES
Always test and optimize parameters for the specific instrument and timeframe.

London Breakout Structure by Ale 2This indicator identifies market structure breakouts (CHOCH/BOS) within a specific London session window, highlighting potential breakout trades with automatic entry, stop loss (SL), and take profit (TP) levels.
It helps traders focus on high-probability breakouts when volatility increases after the Asian session, using price structure, ATR-based volatility filters, and a custom risk/reward setup.
🔹 Example of Strategy Application
Define your session (e.g. 04:00 to 05:00).
Wait for a CHOCH (Change of Character) inside this session.
If a bullish CHOCH occurs → go LONG at candle close.
If a bearish CHOCH occurs → go SHORT at candle close.
SL is set below/above the previous swing using ATR × multiplier.
TP is calculated automatically based on your R:R ratio.
📊 Example:
When price breaks above the last swing high within the session, a “BUY” label appears and the indicator draws Entry, SL, and TP levels automatically.
If the breakout fails and price closes below the opposite structure, a “SELL” signal will replace the bullish setup.
🔹 Details
The logic is based on structural shifts (CHOCH/BOS):
A CHOCH occurs when price breaks and closes beyond the most recent high/low.
The indicator dynamically detects these shifts in structure, validating them only inside your chosen time window (e.g. the London Open).
The ATR filter ensures setups are valid only when the range has enough volatility, avoiding false signals in low-volume hours.
You can also visualize:
The session area (purple background)
Entry, Stop Loss, and Take Profit levels
Direction labels (BUY/SELL)
ATR line for volatility context
🔹 Configuration
Start / End Hour: define your preferred trading window.
ATR Length & Multiplier: adjust for volatility.
Risk/Reward Ratio: set your desired R:R (default 1:2).
Minimum Range Filter: avoids signals with tight SLs.
Alerts: receive notifications when breakout conditions occur.
🔹 Recommendations
Works best on 15m or 5m charts during London session.
Designed for breakout and structure-based traders.
Works on Forex, Crypto, and Indices.
Ideal as a visual and educational tool for understanding BOS/CHOCH behavior.

Momentum Breakout Filter + ATR ZonesMomentum Breakout Filter + ATR Zones - User Guide
What This Indicator Does
This indicator helps you with your MACD + volume momentum strategy by:
Filtering out fake breakouts - Shows ⚠️ warnings when breakouts lack confirmation
Showing clear entry signals - 🚀 LONG and 🔻 SHORT labels when all conditions align
Automatic stop loss & profit targets - Based on ATR (Average True Range)
Visual trend confirmation - Background color + EMA alignment
Signal Types
🚀 LONG Entry Signal (Green Label)
Appears when ALL conditions met:
✅ MACD crosses above signal line
✅ Volume > 1.5× average
✅ Price > EMA 9 > EMA 21 > EMA 200 (bullish trend)
✅ Price closes above recent 20-bar high
🔻 SHORT Entry Signal (Red Label)
Appears when ALL conditions met:
✅ MACD crosses below signal line
✅ Volume > 1.5× average
✅ Price < EMA 9 < EMA 21 < EMA 200 (bearish trend)
✅ Price closes below recent 20-bar low
⚠️ FAKE Breakout Warning (Orange Label)
Appears when price breaks high/low BUT lacks confirmation:
❌ Low volume (below 1.5× average), OR
❌ Wick break only (didn't close through level), OR
❌ MACD not aligned with direction
Hover over the warning label to see what's missing!
ATR Stop Loss & Targets
When you get a signal, colored lines automatically appear:
Long Position
Red solid line = Stop Loss (Entry - 1.5×ATR)
Green dashed lines = Profit Targets:
Target 1: Entry + 2×ATR
Target 2: Entry + 3×ATR
Target 3: Entry + 4×ATR
Short Position
Red solid line = Stop Loss (Entry + 1.5×ATR)
Green dashed lines = Profit Targets:
Target 1: Entry - 2×ATR
Target 2: Entry - 3×ATR
Target 3: Entry - 4×ATR
The lines move with each bar until you exit the position.
Chart Elements
Moving Averages
Blue line = EMA 9 (fast)
Orange line = EMA 21 (medium)
White line = EMA 200 (trend filter)
Volume
Yellow bars = High volume (above threshold)
Gray bars = Normal volume
Background Color
Light green = Bullish trend (all EMAs aligned up)
Light red = Bearish trend (all EMAs aligned down)
No color = Neutral/mixed
MACD (Bottom Pane)
Green/Red columns = MACD Histogram
Blue line = MACD Line
Orange line = Signal Line
Info Dashboard (Bottom Right)
ItemWhat It ShowsVolumeCurrent volume vs average (✓ HIGH or ✗ Low)MACDDirection (BULLISH or BEARISH)TrendEMA alignment (BULL, BEAR, or NEUTRAL)ATRCurrent ATR value in dollarsPositionCurrent position (LONG, SHORT, or NONE)R:RRisk-to-Reward ratio (shows when in position)
How To Use It
Basic Workflow
Wait for setup
Watch for MACD to approach signal line
Volume should be building
Price should be near EMA structure
Get confirmation
Wait for 🚀 LONG or 🔻 SHORT label
Check dashboard shows "✓ HIGH" volume
Verify trend is aligned (green or red background)
Enter the trade
Enter when signal appears
Note your stop loss (red line)
Note your targets (green dashed lines)
Manage the trade
Exit at first target for partial profit
Move stop to breakeven
Trail remaining position
What To Avoid
❌ Don't trade when you see:
⚠️ FAKE labels (wait for confirmation)
Neutral background (no clear trend)
"✗ Low" volume in dashboard
MACD and Trend not aligned
Settings You Can Adjust
Volume Sensitivity
High Volume Threshold: Default 1.5×
Increase to 2.0× for cleaner signals (fewer trades)
Decrease to 1.2× for more signals (more trades)
Fake Breakout Filters
You can toggle these ON/OFF:
Volume Confirmation: Requires high volume
Close Through: Requires candle close, not just wick
MACD Alignment: Requires MACD direction match
Tip: Turn all three ON for highest quality signals
ATR Stop/Target Multipliers
Default settings (conservative):
Stop Loss: 1.5×ATR
Target 1: 2×ATR (1.33:1 R:R)
Target 2: 3×ATR (2:1 R:R)
Target 3: 4×ATR (2.67:1 R:R)
Aggressive traders might use:
Stop Loss: 1.0×ATR
Target 1: 2×ATR (2:1 R:R)
Target 2: 4×ATR (4:1 R:R)
Conservative traders might use:
Stop Loss: 2.0×ATR
Target 1: 3×ATR (1.5:1 R:R)
Target 2: 5×ATR (2.5:1 R:R)
Example Trade Scenarios
Scenario 1: Perfect Long Setup ✅
Stock consolidating near EMA 21
MACD curling up toward signal line
Volume bar turns yellow (high volume)
🚀 LONG label appears
Red stop line and green target lines appear
Result: High probability trade
Scenario 2: Fake Breakout Avoided ✅
Price breaks above resistance
Volume is normal (gray bar)
⚠️ FAKE label appears (hover shows "Low volume")
No entry signal
Price falls back below breakout level
Result: Avoided losing trade
Scenario 3: Premature Entry ❌
MACD crosses up
Volume is high
BUT trend is NEUTRAL (no background color)
No signal appears (trend filter blocks it)
Result: Avoided choppy/sideways market
Quick Reference
Entry Checklist
🚀 or 🔻 label on chart
Dashboard shows "✓ HIGH" volume
Dashboard shows aligned MACD + Trend
Colored background (green or red)
ATR lines visible
No ⚠️ FAKE warning
Exit Strategy
Target 1 (2×ATR): Take 50% profit, move stop to breakeven
Target 2 (3×ATR): Take 25% profit, trail stop
Target 3 (4×ATR): Take remaining profit or trail aggressively
Stop Loss: Exit entire position if hit
Alerts
Set up these alerts:
Long Entry: Fires when 🚀 LONG signal appears
Short Entry: Fires when 🔻 SHORT signal appears
Fake Breakout Warning: Fires when ⚠️ appears (optional)
Tips for Success
Use on 5-minute charts for day trading momentum plays
Only trade high volume stocks ($5-20 range works best)
Wait for full confirmation - don't jump early
Respect the stop loss - it's calculated based on volatility
Scale out at targets - don't hold for home runs
Avoid trading first 15 minutes - let market settle
Best during 10am-11am and 2pm-3pm - peak momentum times
Common Questions
Q: Why didn't I get a signal even though MACD crossed?
A: All conditions must be met - check dashboard for what's missing (likely volume or trend alignment)
Q: Can I use this on any timeframe?
A: Yes, but it's designed for 5-15 minute charts. On daily charts, adjust ATR multipliers higher.
Q: The stop loss seems too tight, can I widen it?
A: Yes, increase "Stop Loss (×ATR)" from 1.5 to 2.0 or 2.5 in settings.
Q: I keep seeing FAKE warnings but price keeps going - what gives?
A: The filter is conservative. You can disable some filters in settings, but expect more false signals.
Q: Can I use this for swing trading?
A: Yes, but use larger timeframes (1H or 4H) and adjust ATR multipliers up (3× for stops, 6-9× for targets).

Institutional Compression Breakout (ICBO Algo) [@darshakssc]The ICBO Algo is a smart intraday trading tool that detects institutional compression zones followed by breakout confirmation. It combines candle range analysis, volume compression, EMA filtering, and ATR-based Risk/Reward zones to highlight high-probability trade setups with visual clarity.
This script is designed for educational and research purposes only, fully aligned with TradingView’s Pine Script policy and publishing guidelines.
🔍 Key Features
🌀 Compression Zone Detection
Identifies low-range, low-volume candles often formed before institutional breakouts.
📈📉 Breakout Signals
Triggered after confirmed price + EMA breakout post-compression.
📊 Dashboard Panel
Displays breakout phase, current R:R ratio, and zone status in real-time.
🟢🔴 Buy/Sell Labels with Emojis
Clean and non-intrusive labels for immediate action recognition.
🔔 Alerts Included
Receive real-time push, email, or webhook alerts for breakout signals.
⚙️ How It Works
Compression Phase:
When the candle range and volume are significantly lower than the moving average, the script flags it as a compression zone.
Breakout Confirmation:
A breakout signal is confirmed when the price breaks the previous high/low and is above/below the trend EMA.
Entry Logic:
📈 Buy: Price > previous high + above EMA after compression
📉 Sell: Price < previous low + below EMA after compression
⚠️ Disclaimer
This script is intended for educational and research purposes only. It does not constitute financial advice or recommendations of any kind. Always use proper risk management. Past performance does not guarantee future results.


Trendline Breakouts With Targets [ omerprıme ]Indicator Explanation (English)
This indicator is designed to detect trendline breakouts and provide early trading signals when the price breaks key support or resistance levels.
Trendline Detection
The indicator identifies recent swing highs and lows to construct dynamic trendlines.
These trendlines act as support in an uptrend and resistance in a downtrend.
Breakout Confirmation
When the price closes above a resistance trendline, the indicator generates a bullish breakout signal.
When the price closes below a support trendline, it generates a bearish breakout signal.
Filtering False Signals
To reduce false breakouts, additional conditions (such as candle confirmation, volume filters, or price momentum) can be applied.
Only significant and confirmed breakouts are highlighted.
Trading Logic
Buy signals are triggered when the price breaks upward through resistance with confirmation.
Sell signals are triggered when the price breaks downward through support with confirmation.

Volatility Cone Forecaster Lite [PhenLabs]📊 Volatility Cone Forecaster
Version: PineScript™v6
📌Description
The Volatility Cone Forecaster (VCF) is an advanced indicator designed to provide traders with a forward-looking perspective on market volatility. Instead of merely measuring past price fluctuations, the VCF analyzes historical volatility data to project a statistical “cone” that outlines a probable range for future price movements. Its core purpose is to contextualize the current market environment, helping traders to anticipate potential shifts from low to high volatility periods (and vice versa). By identifying whether volatility is expanding or contracting relative to historical norms, it solves the critical problem of preparing for significant market moves before they happen, offering a clear statistical edge in strategy development.
This indicator moves beyond lagging measures by employing percentile analysis to rank the current volatility state. This allows traders to understand not just what volatility is, but how significant it is compared to the recent past. The VCF is built for discretionary traders, system developers, and options strategists who need a sophisticated understanding of market dynamics to manage risk and identify high-probability opportunities.
🚀Points of Innovation
Forward-Looking Volatility Projection: Unlike standard indicators that only show historical data, the VCF projects a statistical cone of future volatility.
Percentile-Based Regime Analysis: Ranks current volatility against historical data (e.g., 90th, 75th percentiles) to provide objective context.
Automated Regime Detection: Automatically identifies and labels the market as being in a ‘High’, ‘Low’, or ‘Normal’ volatility regime.
Expansion & Contraction Signals: Clearly indicates whether volatility is currently increasing or decreasing, signaling shifts in market energy.
Integrated ATR Comparison: Plots an ATR-equivalent volatility measure to offer a familiar point of reference against the statistical model.
Dynamic Visual Modeling: The cone visualization directly on the price chart provides an intuitive guide for future expected price ranges.
🔧Core Components
Realized Volatility Engine: Calculates historical volatility using log returns over multiple user-defined lookback periods (short, medium, long) for a comprehensive view.
Percentile Analysis Module: A custom function calculates the 10th, 25th, 50th, 75th, and 90th percentiles of volatility over a long-term lookback (e.g., 252 days).
Forward Projection Calculator: Uses the calculated volatility percentiles to mathematically derive and draw the upper and lower bounds of the future volatility cone.
Volatility Regime Classifier: A logic-based system that compares current volatility to the historical percentile bands to classify the market state.
🔥Key Features
Customizable Lookback Periods: Adjust short, medium, and long-term lookbacks to fine-tune the indicator’s sensitivity to different market cycles.
Configurable Forward Projection: Set the number of days for the forward cone projection to align with your specific trading horizon.
Interactive Display Options: Toggle visibility for percentile labels, ATR levels, and regime coloring to customize the chart display.
Data-Rich Information Table: A clean, on-screen table displays all key metrics, including current volatility, percentile rank, regime, and trend.
Built-in Alert Conditions: Set alerts for critical events like volatility crossing the 90th percentile, dropping below the 10th, or switching between expansion and contraction.
🎨Visualization
Volatility Cone: Shaded bands projected onto the future price axis, representing the probable price range at different statistical confidence levels (e.g., 75th-90th percentile).
Color-Coded Volatility Line: The primary volatility plot dynamically changes color (e.g., red for high, green for low) to reflect the current volatility regime, providing instant context.
Historical Percentile Bands: Horizontal lines plotted across the indicator pane mark the key percentile levels, showing how current volatility compares to the past.
On-Chart Labels: Clear labels automatically display the current volatility reading, its percentile rank, the detected regime, and trend (Expanding/Contracting).
📖Usage Guidelines
Setting Categories
Short-term Lookback: Default: 10, Range: 5-50. Controls the most sensitive volatility calculation.
Medium-term Lookback: Default: 21, Range: 10-100. The primary input for the current volatility reading.
Long-term Lookback: Default: 63, Range: 30-252. Provides a baseline for long-term market character.
Percentile Lookback Period: Default: 252, Range: 100-1000. Defines the period for historical ranking; 252 represents one trading year.
Forward Projection Days: Default: 21, Range: 5-63. Determines how many bars into the future the cone is projected.
✅Best Use Cases
Breakout Trading: Identify periods of deep consolidation when volatility falls to low percentile ranks (e.g., below 25th) and begins to expand, signaling a potential breakout.
Mean Reversion Strategies: Target trades when volatility reaches extreme high percentile ranks (e.g., above 90th), as these periods are often unsustainable and lead to contraction.
Options Strategy: Use the cone’s projected upper and lower bounds to help select strike prices for strategies like iron condors or straddles.
Risk Management: Widen stop-losses and reduce position sizes when the indicator signals a transition into a ‘High’ volatility regime.
⚠️Limitations
Probabilistic, Not Predictive: The cone represents a statistical probability, not a guarantee of future price action. Extreme, unpredictable news events can drive prices outside the cone.
Lagging by Nature: All calculations are based on historical price data, meaning the indicator will always react to, not pre-empt, market changes.
Non-Directional: The indicator forecasts the *magnitude* of future moves, not the *direction*. It should be paired with a directional analysis tool.
💡What Makes This Unique
Forward Projection: Its primary distinction is projecting a data-driven, statistical forecast of future volatility, which standard oscillators do not do.
Contextual Analysis: It doesn’t just provide a number; it tells you what that number means through percentile ranking and automated regime classification.
🔬How It Works
1. Data Calculation:
The indicator first calculates the logarithmic returns of the asset’s price. It then computes the annualized standard deviation of these returns over short, medium, and long-term lookback periods to generate realized volatility readings.
2. Percentile Ranking:
Using a 252-day lookback, it analyzes the history of the medium-term volatility and determines the values that correspond to the 10th, 25th, 50th, 75th, and 90th percentiles. This builds a statistical map of the asset’s volatility behavior.
3. Cone Projection:
Finally, it takes these historical percentile values and projects them forward in time, calculating the potential upper and lower price bounds based on what would happen if volatility were to run at those levels over the next 21 days.
💡Note:
The Volatility Cone Forecaster is most effective on daily and weekly charts where statistical volatility models are more reliable. For lower timeframes, consider shortening the lookback periods. Always use this indicator as part of a comprehensive trading plan that includes other forms of analysis.

SmartPlusSmartPlus
Overview
The SmartPlus indicator is a complete framework for intraday traders. It combines key market reference points (VWAP, moving averages, and the first 15-minute high/low range) with predictive levels based on historical daily moves. Together, these elements allow traders to build directional bias, spot breakouts, and manage risk throughout the session.
Key Features
1. VWAP (Volume-Weighted Average Price)
- Plots the intraday VWAP in real time.
- VWAP acts as a central “fair value” reference point for institutional order flow.
- Price trading above VWAP generally suggests bullish bias, while below VWAP leans bearish.
2. Exponential Moving Averages (EMAs)
- Two configurable EMAs are included:
- Fast EMA (default: 21 periods)
- Slow EMA (default: 34 periods)
- Each EMA is plotted with a single, user-selectable color for clarity.
- Crossovers or alignment between price, VWAP, and EMAs help define market structure.
3. Smart Bar Coloring
- Candles automatically change color when conditions align:
- Bull Zone: Price above VWAP, Fast EMA, and Slow EMA.
- Bear Zone: Price below VWAP, Fast EMA, and Slow EMA.
- Fluorescent bar coloring helps highlight momentum zones visually without additional analysis.
4. First 15-Minute High/Low/Mid (Automatic)
- Automatically detects the first 15 minutes of each new trading day (no manual input required).
- Plots horizontal lines for:
- First 15-Minute High (green)
- First 15-Minute Low (red)
- Midpoint of that range (gray)
- Once the initial 15-minute window ends, these levels remain projected throughout the session as breakout or support/resistance zones.
- Alerts trigger when price breaks above the high or below the low after the window.
5. Daily Support/Resistance Forecast
- Uses a rolling lookback of recent daily ranges (default: 126 days).
- Tracks average up moves and down moves from the daily open.
- Optionally incorporates standard deviation for wider confidence bands.
- Plots forecast levels above/below the current day’s open for reference.
Trading Logic (How to Use)
- Bullish Bias:
- Price is above VWAP, above both EMAs, and ideally above the first 15-minute high.
- This setup suggests trend continuation or breakout opportunities on the long side.
- Bearish Bias:
- Price is below VWAP, below both EMAs, and ideally below the first 15-minute low.
- This setup suggests downward pressure or breakout opportunities on the short side.
- Neutral / Caution Zone:
- Price caught between VWAP, EMAs, or inside the 15-minute range often signals indecision.
- Best to wait for confirmation or breakout before committing to trades.
Expectations After Using It
- The script provides context and structure, not trading signals.
- It highlights where price is relative to meaningful market levels so traders can act with greater confidence.
- Combining VWAP, EMAs, and the 15-minute breakout framework helps traders stay aligned with the market’s natural rhythm.
Disclaimer
This script is a tool for market analysis and educational purposes only.
It does not constitute financial advice, trading recommendations, or guaranteed profitability.
Markets are inherently risky, and past patterns do not ensure future results.
Always combine this tool with sound risk management, personal research, and professional guidance before making any trading decisions.

Smart Bar Coloring: Tight Closes & Volume BreakoutsAdvanced Bar Coloring Indicator for Price Action and Volume Analysis
This sophisticated indicator automatically colors price bars based on two key market conditions: tight closing ranges and significant volume activity, helping traders quickly identify consolidation periods and potential breakout setups.
Key Features:
Tight Close Detection:
ATR-Based Analysis: Uses 14-period ATR to define "tight" price movement
Dual-Bar Confirmation: Requires both current and previous bar to have closing ranges ≤ 20% of ATR
Consolidation Identification: Highlights periods of reduced volatility that often precede significant moves
Customizable Color: Default amber/orange highlighting for easy visual identification
Volume Breakout Detection:
Multi-Criteria Volume Analysis: Triggers when volume exceeds any of three thresholds:
150% of 20-period volume SMA
150% of recent 3-bar average volume
150% of 50-period volume SMA
Price Action Filter: Requires bullish price action (close > previous close OR close in upper 75% of range)
Smart Volume Handling: Automatically detects and works only with instruments that have volume data
Customizable Color: Default teal highlighting for volume-driven moves
Technical Analysis Applications:
Consolidation Patterns: Identify tight trading ranges before potential breakouts
Volume Confirmation: Spot high-volume moves with supportive price action
Entry Timing: Use tight closes to identify potential accumulation zones
Breakout Validation: Volume-colored bars confirm legitimate breakout attempts
Risk Management: Tight closes often indicate lower immediate volatility
How to Use:
Amber/Orange Bars: Indicate tight closing ranges - potential accumulation or consolidation
Teal Bars: Show significant volume with bullish price action - potential breakout confirmation
Normal Bars: Standard market conditions without special highlighting
Pattern Recognition: Look for clusters of tight closes followed by volume breakouts
Technical Requirements:
Works on any timeframe
Automatically adapts to instruments with or without volume data
Compatible with all chart types and drawing tools

Nifty Smart Zones & Breakout Bars(5min TF only) by Chaitu50cNifty Smart Zones & Breakout Bars is a purpose-built intraday trading tool, tested extensively on Nifty50 and recommended for Nifty50 use only.
All default settings are optimised specifically for Nifty50 on the 5-minute timeframe for maximum accuracy and clarity.
Why Last Bar of the Session Matters
The last candle of a trading session often represents the final battle between buyers and sellers for that day.
It encapsulates closing sentiment, influenced by end-of-day positioning, profit booking, and institutional activity.
The high and low of this bar frequently act as strong intraday support/resistance in the following sessions.
Price often reacts around these levels, especially when combined with volume surges.
Core Features
Session Last-Candle Zones
Plots a horizontal box at the high and low of the last candle in each session.
Boxes extend to the right to track carry-over levels into new sessions.
Uses a stateless approach — past zones reappear if relevant.
Smart Suppression System
When more than your Base Sessions (No Suppression) are shown, newer zones overlapping or within a proximity distance (in points) of older zones are hidden.
Older zones take priority, reducing chart clutter while keeping critical levels.
Breakout Bar Coloring
Highlights breakout bars in four categories:
Up Break (1-bar)
Down Break (1-bar)
Up Break (2-bar)
Down Break (2-bar)
Breakouts use a break buffer (in ticks) to filter noise.
Toggle coloring on/off instantly.
Volume Context (User Tip)
For best use, pair with volume analysis.
High-volume breakouts from last-session zones have greater conviction and can signal sustained momentum.
Usage Recommendations
Instrument: Nifty50 only (tested & optimised).
Timeframe: 5-minute chart for best results.
Approach:
Watch for price interaction with the plotted last-session zones.
Combine zone breaks with bar color signals and volume spikes for higher-probability trades.
Use suppression to focus on key, non-redundant levels.
Why This Tool is Different
Unlike standard support/resistance plotting, this indicator focuses on session-closing levels, which are more reliable than arbitrary highs/lows because they capture the final market consensus for the session.
The proximity-based suppression ensures your chart stays clean, while breakout paints give instant visual cues for momentum shifts.

Trend Breakout Description:
This Pine Script indicator identifies pivot high and pivot low points based on user-defined left and right candle legs, detecting breakouts to signal potential trend changes. It plots horizontal lines at pivot highs (lime) and pivot lows (red), marking breakout signals with labels ("Br") when the price crosses above a pivot high or below a pivot low. The indicator also changes the background color to reflect the trend (green for uptrend, red for downtrend) with adjustable transparency. The indicator primarily focuses on recognizing specific pivot patterns to define trends and generate trading signals.
How It Works
• Pivot Detection: Identifies pivot highs and lows using configurable left (Left side Pivot Candle) and right (Right side Pivot Candle) periods.
• Pivot Highs (PH): A pivot high is identified when a candle's high is greater than a specified number of preceding candles (left leg) and succeeding candles (right leg).
• Pivot Lows (PL): Similarly, a pivot low is identified when a candle's low is less than a specified number of preceding and succeeding candles.
The script then tracks the last three pivot highs and pivot lows.
Trend Detection and Breakouts
1. High Line (Resistance): When a middle pivot high (out of the three tracked) is higher than both the previous and the next pivot high, a lime green line is drawn from that pivot high. This line acts as a dynamic resistance level.
2. Low Line (Support): Conversely, when a middle pivot low is lower than both the previous and the next pivot low, a red line is drawn from that pivot low. This line acts as a dynamic support level.
________________________________________
Trading Signals : The indicator generates signals based on price crossing these dynamically drawn lines .
• Long Signal (Uptrend):
o A "Long" signal is triggered when the close price crosses above the current high line (resistance), and the indicator is not already in an uptrend.
o When a long signal occurs, the background turns green, and the high line becomes dotted and thinner. A "Br" (Breakout) label appears below the candle.
• Short Signal (Downtrend):
o A "Short" signal is triggered when the close price crosses below the current low line (support), and the indicator is not already in a downtrend.
o When a short signal occurs, the background turns red, and the low line becomes dotted and thinner. A "Br" (Breakout) label appears above the candle.
________________________________________
Customizable Settings
The indicator provides three user-adjustable inputs:
• Right Side Pivot Candle (fpivotLeg): This setting (default 10) determines the number of candles to the right that must have lower highs/higher lows for a pivot to be confirmed.
• Left Side Pivot Candle (bpivotLeg): This setting (default 15) determines the number of candles to the left that must have lower highs/higher lows for a pivot to be confirmed.
• Adjust Color Visualization (Colortrnp): This setting (default 85) controls the transparency of the background color changes, allowing you to adjust how prominently the green (uptrend) and red (downtrend) backgrounds are displayed.
________________________________________
How to Use It
This indicator can be used by traders to:
• Identify potential reversals: The formation of new pivot highs and lows can signal shifts in market direction.
• Spot breakout opportunities: Crossing above the high line or below the low line can indicate the start of a new trend or the continuation of an existing one.
• Confirm trend strength: The presence and extension of the high and low lines can provide visual cues about the prevailing trend.
• Ideal for swing traders or trend-following strategies.
• Use the breakout labels ("Br") and background color to confirm trend direction.
• Adjust pivot leg inputs to fine-tune sensitivity for different timeframes or assets.
• Customize transparency to suit chart readability.
Example:
On a breakout above a pivot high, a green "Br" label appears, the background turns green, and the pivot line becomes dotted. This signals a potential uptrend, helping traders identify entry points or trend confirmations.
Disclaimer: No indicator guarantees profits. Always use this indicator in conjunction with other analysis methods and proper risk management.

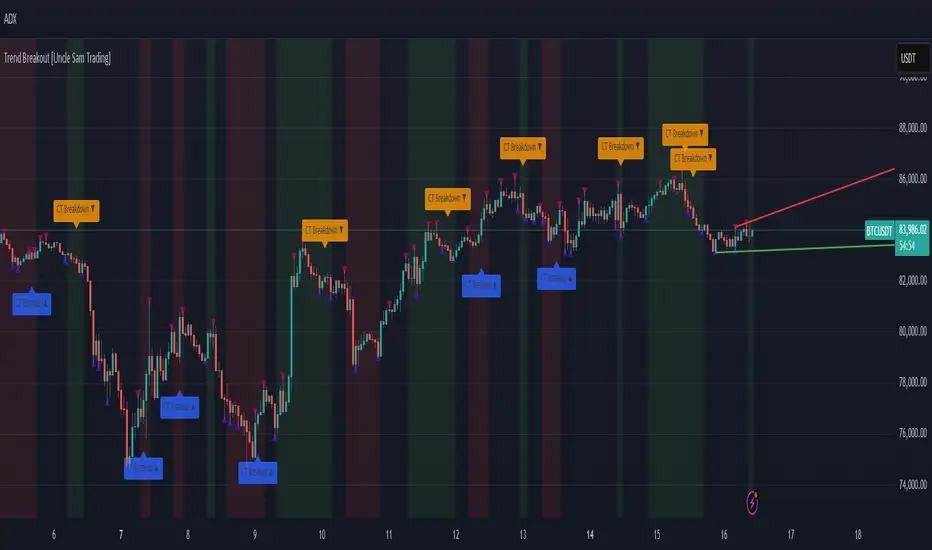
Trend Breakout [Uncle Sam Trading]Trend Breakout Indicator
Overview
The Trend Breakout Indicator is a powerful, non-repainting tool designed to help traders identify high-probability breakout and trend reversal setups on any market and timeframe. By leveraging pivot points, this indicator draws dynamic support and resistance channels, highlights counter-trend breakouts, and provides visual cues for market direction. It’s ideal for traders looking to simplify their analysis while targeting key price levels for entries and exits.
Key Features
Pivot-Based Channels: Draws a red upper channel (resistance) and a green lower channel (support) by connecting recent pivot highs and lows.
Counter-Trend Breakout Signals:
Blue “CT Breakup” signal (▲) when the price breaks above the upper channel during a downtrend, indicating a potential reversal or pullback.
Orange “CT Breakdown” signal (▼) when the price breaks below the lower channel during an uptrend, signaling a potential downmove.
Trend Visualization: Background color shifts to green for uptrends and red for downtrends, making it easy to gauge market direction.
Customizable Settings: Adjust pivot detection sensitivity with “Pivot Left Bars” (default: 5) and “Pivot Right Bars” (default: 1), and control channel extension with “Channel Extension Bars” (default: 50).
Optional Trend Signals: Enable “Show Trend Change Signals” to display trend shifts with green (uptrend) or red (downtrend) arrows.
Alert Conditions: Set alerts for counter-trend breakouts and trend changes directly on TradingView.
Example Performance (BTCUSDT, 1-Hour Chart)
On the BTCUSDT 1-hour chart:
A “CT Breakdown” signal appeared on April 6 at 8:00 AM at $82,700, followed by a drop to $74,400 within hours—a 10% move.
A “CT Breakup” signal occurred on April 9 at 1:00 AM at $76,600, leading to a rally to $86,600 in a few hours—a 9% gain.
These examples highlight the indicator’s ability to spot significant price movements, though results depend on market conditions, your trading style, and risk management.
Settings
Pivot Left Bars (default: 5): Number of bars to the left for pivot detection.
Pivot Right Bars (default: 1): Number of bars to the right for pivot confirmation (ensures non-repainting signals).
Channel Extension Bars (default: 50): How far the channels extend to the right.
Show Pivot Points (default: true): Displays small triangles at pivot highs (maroon) and lows (navy).
Show Counter-Trend Breakout Signals (default: true): Shows CT Breakup and CT Breakdown signals.
Show Trend Change Signals (default: false): Displays trend shift arrows when enabled.
How to Use
Add the indicator to your chart via TradingView’s indicator library.
Adjust the settings to match your trading style and timeframe.
Watch for “CT Breakup” and “CT Breakdown” signals to identify potential trade setups.
Use the background color (green/red) to confirm the current trend.
Set alerts for breakouts or trend changes to stay updated on key signals.
Always combine with proper risk management and your own analysis—past performance is not a guarantee of future results.
Notes
The indicator is non-repainting, meaning signals are confirmed and won’t disappear after they form.
Works on any market (crypto, forex, stocks) and timeframe, such as the BTCUSDT 1-hour chart shown.
Performance varies based on market volatility and your trading strategy.
This is a free tool created to support the TradingView community—feedback is welcome in the comments!
Disclaimer
Trading involves risk, and this indicator is not a guaranteed predictor of future price movements. Always conduct your own analysis and manage risk appropriately. The examples provided (e.g., BTCUSDT signals) are for educational purposes only and reflect past performance, which may not repeat.
TQ's Support & Resistance(My goal creating this indicator): Provide a way to categorize and label key structures on multiple different levels so I can create a plan based on those observable facts.
The Underlying Concept / What is Momentum?
Momentum indicates transaction pressure. If the algorithm detects price is going up, that would be considered positive momentum. If the algorithm detects price is going down negative momentum would be detected.
The Momentum shown is derived from a price action pattern. Unlike my previous Support & Resistance indicator that used Super Trend, this indicator uses a unique pattern I created. On the first bar bearish momentum is detected a resistance Level is made at the highest point of the previous bullish condition. On the first bar bullish momentum is detected a support Level is made at the lowest point of the previous bearish condition. This happens on 5 different Momentum Levels, (short-term to long-term). I currently use this pattern to trade so the source code is protected.
What is Severity?
Severity is How we differentiate the importance of different Highs and Lows. If Momentum is detected on a higher level the Supply or Demand Level is updated. The Color and Size representing that Level will be shown. Demand and Supply Levels made by higher levels are more SEVERE than a demand level made by a lower level.
Technical Inputs
- to ensure the correct calculation of Support and Resistance levels change BAR_INDEX. BAR_INDEX creates a buffer at the start of the chart. For example: If you set BAR_INDEX to 300. The script will wait for 300 bars to elapse on the current chart before running. This allows the script more time to gather data. Which is needed in order for our dynamic lookback length to never return an error (Dynamic lookback length can't be negative or zero). The lower the timeframe the greater the number of bars need. For Example, if I open up a 1min chart I would enter 5000 as my BAR_INDEX since that will provide enough data to ensure the correct calculation of Support and Resistance levels. If I was on a daily chart, I would enter a lower number such as 800. Don't be afraid to play around with this.
- Toggle options (Close) or (High & Low) creates Support and Resistance Levels using the Lowest close and Highest close or using the Lowest low and Highest high.
Level Inputs
- The indicator has 5 Different Levels indicating SEVEREITY of a Supply and Demand Levels. The higher the Level the more SEVERE the Level.
Display Inputs
- You have the option to customize the Length, Width, Line Style, and Colors of all 5 different
- This indicator includes a Trend Chart. To Easily verify the current trend of any displayed by this indicator toggle on Chart On/Off. You also get the option to change the Chart Position and the size of the Trend Chart
How Trend Is being Determined?
(Close > Current Supply Level) if this statement is true technically price made a HH, so the trend is bullish.
(Close < Current Demand Level) if this statement is true technically price made a LL, so the trend is bearish.
- Fully customize how you display Market Structure on different levels. Line Length, Line Width, Line Style, and Line color can all be customized.
How it can be used?
(Examples of Different ways you can use this indicator): Easily categorize the severity of each and every Supply or Demand Level in the market (The higher Level the stronger the level)
: Quickly Determine the trend of any Level.
: Get a consistent view of a market and how different Levels are behaving but just use one chart.
: Take the discretion from hand drawing support and resistance lines out of your trading.
: Find and categorize strong levels for potential breakouts.
: Trend Analysis, use Levels to create a narrative based on observable facts from these Levels.
: Different Targets to take money off the table.
: Use Severity to differentiate between different trend line setups.
: Find Great places to move your stop loss too.

Opening Range BreakoutThis is an Opening Range Breakout script. It will plot the opening range high and low (green and red lines, respectively) as determined by the user input (default is a 15 min window from market open, 9:30 - 9:45 am). The time period for the breakout is also configured by a user input (default is from 9:45 am - 2:30 pm).
Alerts are sent for breakouts either above (bullish) or below (bearish) the opening range high and low. An EMA is also used for trend confirmation before sending alerts for breakouts (to avoid false signals).
A bullish breakout is determined by all of the following being true:
- The current price being above the opening range high (green line)
- The EMA trending up (ie the current value of the EMA > prior EMA value)
- The current price is > the EMA
- The EMA is > the opening range high
A bearish breakout is determined by all of the following being true:
- The current price being below the opening range low (red line)
- The EMA trending down (ie the current value of the EMA < prior EMA value)
- The current price is < the EMA
- the EMA is < the opening range low
Enjoy this simple indicator!

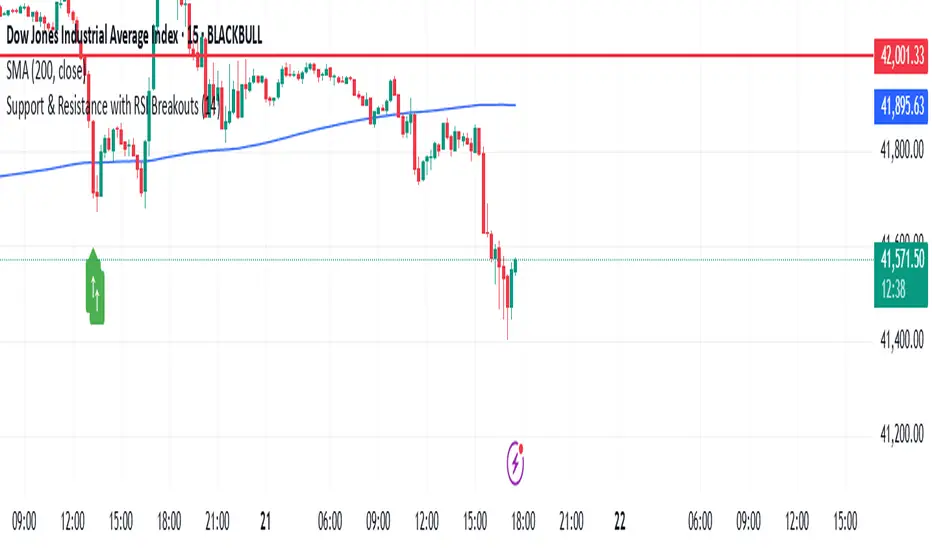
Support & Resistance with RSI BreakoutsThe script is a TradingView Pine Script (v5) indicator that identifies support and resistance levels using RSI (Relative Strength Index) breakouts. Here’s a breakdown of what it does:
Features:
RSI Calculation:
The script calculates the 14-period RSI (default) using the closing price.
The user can modify the RSI period through an input setting.
Buy and Sell Signals:
A buy signal is triggered when RSI drops below 20 (indicating oversold conditions).
A sell signal is triggered when RSI rises above 80 (indicating overbought conditions).
Visual Representation:
Buy signals are marked with a green upward arrow (↑) below the price bars.
Sell signals are marked with a red downward arrow (↓) above the price bars.
The arrows help traders easily spot potential trade opportunities.
Usage:
This script is useful for traders looking to buy at oversold conditions and sell at overbought conditions based on RSI.
It works best when combined with other indicators or price action strategies to confirm signals.
Enhanced Interval Candle with Breakout Detection and Detailed InThis indicator visualizes the last candle of a user-defined time interval (e.g., 1 hour, 4 hours, 1 day) on the current chart, providing enhanced details and breakout detection. It fetches the open, high, low, and close prices of the interval candle and draws a stylized representation of it, offset to the right of the current bar. The candle body and wicks are colored according to whether the interval candle closed bullishly (green) or bearishly (red). In addition to the candle itself, the indicator displays horizontal dotted lines representing the high, low, and midpoint of the interval candle, along with labels showing their exact values. These labels are dynamically updated as the interval candle changes. Furthermore, the script detects and visualizes breakouts of the interval candle's high or low. When the current price closes above the interval high, a green dashed line and a "Bullish Breakout" label are displayed. Conversely, when the current price closes below the interval low, a red dashed line and a "Bearish Breakout" label are shown. The breakout lines and labels are also dynamically updated. This indicator helps traders easily track the price action of a higher timeframe candle and spot potential breakouts based on that candle's range. The user can configure the time interval to suit their trading needs.

AI Volume Breakout for scalpingPurpose of the Indicator
This script is designed for trading, specifically for scalping, which involves making numerous trades within a very short time frame to take advantage of small price movements. The indicator looks for volume breakouts, which are moments when trading volume significantly increases, potentially signaling the start of a new price movement.
Key Components:
Parameters:
Volume Threshold (volumeThreshold): Determines how much volume must increase from one bar to the next for it to be considered significant. Set at 4.0, meaning volume must quadruplicate for a breakout signal.
Price Change Threshold (priceChangeThreshold): Defines the minimum price change required for a breakout signal. Here, it's 1.5% of the bar's opening price.
SMA Length (smaLength): The period for the Simple Moving Average, which helps confirm the trend direction. Here, it's set to 20.
Cooldown Period (cooldownPeriod): Prevents signals from being too close together, set to 10 bars.
ATR Period (atrPeriod): The period for calculating Average True Range (ATR), used to measure market volatility.
Volatility Threshold (volatilityThreshold): If ATR divided by the close price exceeds this, the market is considered too volatile for trading according to this strategy.
Calculations:
SMA (Simple Moving Average): Used for trend confirmation. A bullish signal is more likely if the price is above this average.
ATR (Average True Range): Measures market volatility. Lower volatility (below the threshold) is preferred for this strategy.
Signal Generation:
The indicator checks if:
Volume has increased significantly (volumeDelta > 0 and volume / volume >= volumeThreshold).
There's enough price change (math.abs(priceDelta / open) >= priceChangeThreshold).
The market isn't too volatile (lowVolatility).
The trend supports the direction of the price change (trendUp for bullish, trendDown for bearish).
If all these conditions are met, it predicts:
1 (Bullish) if conditions suggest buying.
0 (Bearish) if conditions suggest selling.
Cooldown Mechanism:
After a signal, the script waits for a number of bars (cooldownPeriod) before considering another signal to avoid over-trading.
Visual Feedback:
Labels are placed on the chart:
Green label for bullish breakouts below the low price.
Red label for bearish breakouts above the high price.
How to Use:
Entry Points: Look for the labels on your chart to decide when to enter trades.
Risk Management: Since this is for scalping, ensure each trade has tight stop-losses to manage risk due to the quick, small movements.
Market Conditions: This strategy might work best in markets with consistent volume and price changes but not extreme volatility.
Caveats:
This isn't real AI; it's a heuristic based on volume and price. Actual AI would involve machine learning algorithms trained on historical data.
Always backtest any strategy, and consider how it behaves in different market conditions, not just the ones it was designed for.
