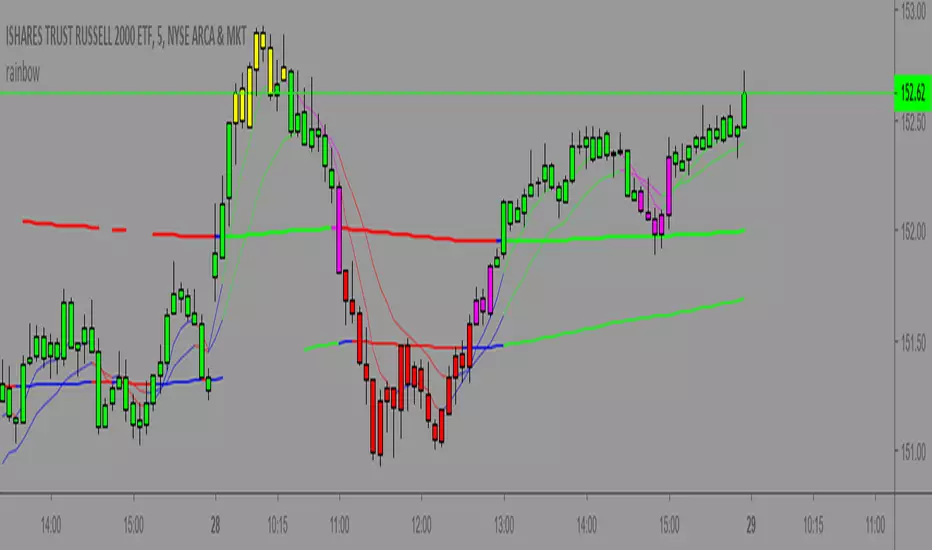
Multiple SMAs + X-Bar High/LowWhen starting my daily analysis, I typically open a daily chart and check where the price is compared to several SMAs, as well as check the high/low of today and the 10-day high/low. This indicator was designed to save chart space as well as make finding the highs and lows more efficient. Everything is adjustable, so you don't have to stick with my 10-bar rule.
ค้นหาในสคริปต์สำหรับ "bar"

W5T Bar number for Elliott Wave IsolationSpecial Bar counting tool to allow Isolation of Elliott Wave wave count. Watch the Video Tour >>HERE<<< of this full and comprehensive Elliott Wave Indicator Suite.

vline() Function for Pine Script v4.0+It's been a long time coming, but here is a versatile vline() function applicable to PSv4.0+ utilizing line.new(). I decided to finally figure this out at the request of another member recently. I have been waiting myself for months, but it's now time for an idea who's time has come to unleash upon planet Pine Script. It's a handy little function I believe will be very useful in the future. It only requires 4 parameters of BarIndex, Color, LineStyle, and LineWidth. Make sure you place it in an appropriate if() block to use it properly. As displayed above, this plots every 10 bars using a conditional statement employing the rarely used modulus operator.
Use it as you please, this is free code to implement into your new Pine projects. I don't require an credit for any one to use this function. I simply don't want any credit. I would however like to see some great ideas utilizing this when I randomly and accidentally come across them in the public library. I didn't know where to put this script, so I just tossed into the "Trend Analysis" category. I'm pondering we members need a "Miscellaneous" category some time in the future.
The comments section below is solely just for commenting and other remarks, ideas, compliments, etc... regarding only this indicator, not others. If you do have any questions or comments regarding this indicator, I will consider your inquiries, thoughts, and concepts presented below in the comments section, when time provides it. When my indicators achieve more prevalent use by TV members, I will implement more ideas when they present themselves as worthy additions. As always, "Like" it if you simply just like it with a proper thumbs up, and also return to my scripts list occasionally for additional postings. Have a profitable future everyone!

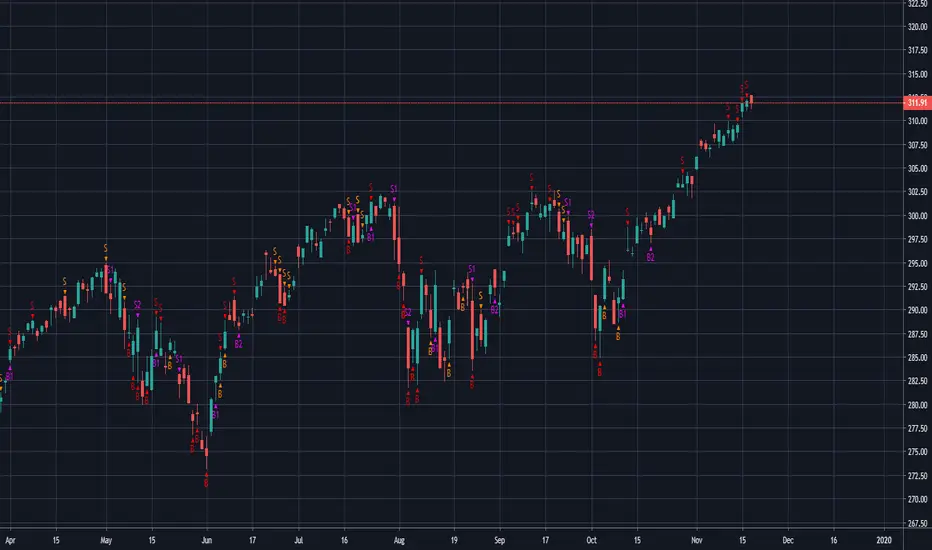
Q Trend&Bar Buy/Sell SignalsHello traders!
Q Trend&Bar Buy/Sell Signals is finally LIVE!
Purple signal (B1 B2 S1 S2) indicates a long and stable trend starts. B is buy, S is sell, *1 shows the trend is trying to turn, and *2 shows the trend confirms that turn (eg. shorts at S1 and increase your short pos at S2 or cover if you see a B1, etc).
Red signal (B S) indicates a shorter time frame trend starts (pullback, breakout failure reversal, etc).
Orange signal (B S) indicates a even shorter farme trend compares to red signals.
Overall, as ranked in trend power, purple 2 > purple 1 > red > orange.
Happy trading ;P
Q
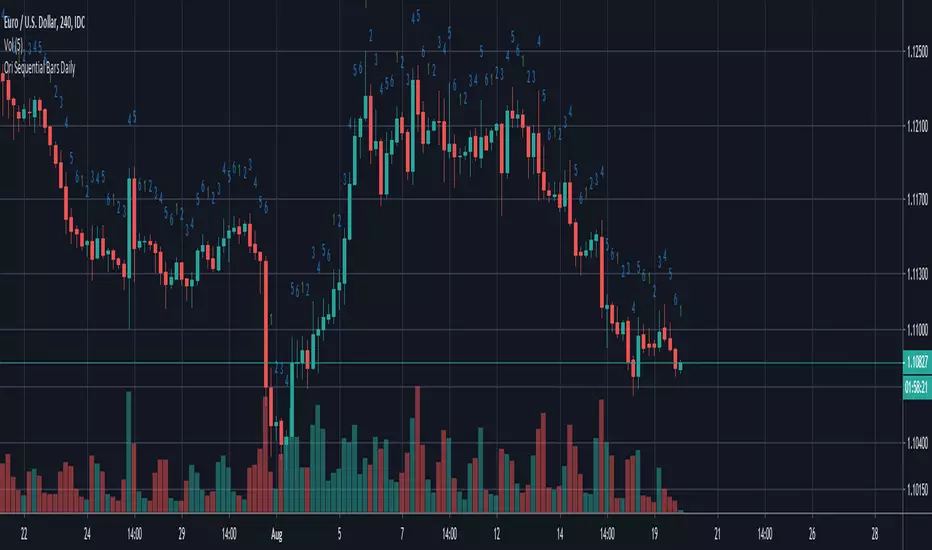
Ori Sequential BarsIndicator enumarates the bars from the start of the selected timeframe to end of the selected timeframe. Default value is Daily.


Ori Sequential Bars Daily v2Indicator enumarates the bars from the start of the day to end of the day. Some may prefer the previous on. Because of that i'm publishing this as a seperate indicator.
Current Price Bar LabelA simple Indicator to display the current price of the asset above the current bar. It shows a green label if the close is equal or greater than the open, red otherwise.


Differential Price Counter for Bullish/Bearish BarsThis script can show the cumulative differential price of both bullish/bearish bars with the 0.1pip precision for the currencies having five decimal precision. However, can be useful for all markets.


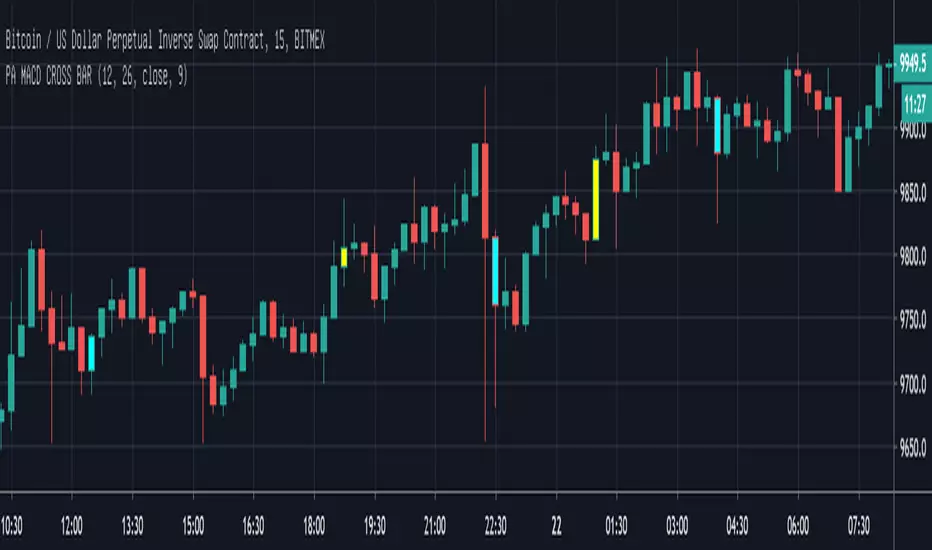
PA Researcher MACD Cross Singal [BarColor]This is PA Researcher MACD Cross Signal Indicator
Ability to Highlight Bar Color


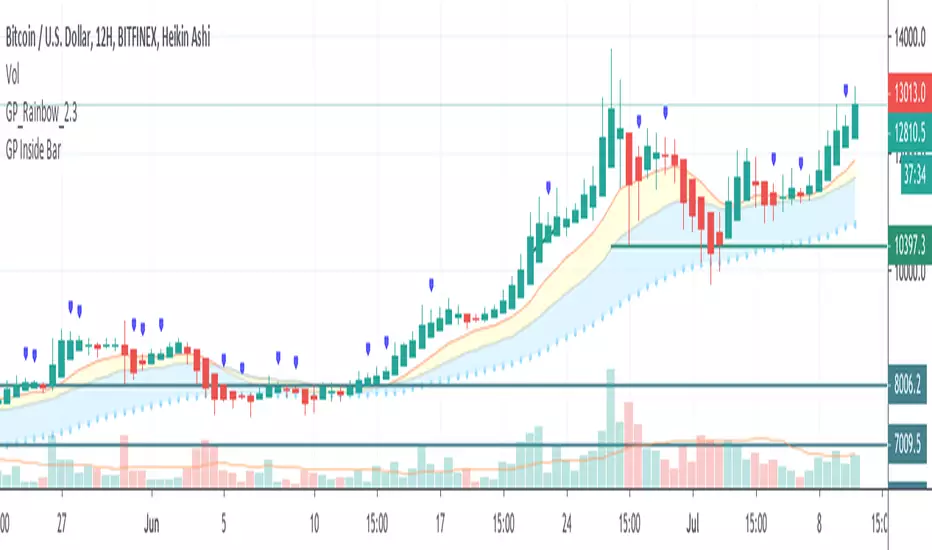
Inside BarsMark Inside Bars with a triangle above the calendar. This indicator supports having different colors and alerts for 1, 2 or 3 consecutive inside bars.


QS Jamaica SetupThis indicator plot several indicators togheter including WMA30, Supertrend ATR, pivots points and the QS Jamaica Bars


Ori Inside Bar MTF (No Repaint)It paints the insidebars MTF. It waits until bar is closed so no repaint.


ATH-&-ATL-Close-Line & Fill - 500 BarsThis Script adds White-Area between Close-Value and last ATH in 500 Bars, and Red-Area between Close-Value and last ATL in 500 Bars.