PMax Explorer STRATEGY & SCREENERProfit Maximizer - PMax Explorer STRATEGY & SCREENER screens the BUY and SELL signals (trend reversals) for 20 user defined different tickers in Tradingview charts.
Simply input the name of the ticker in Tradingview that you want to screen.
Terminology explanation:
Confirmed Reversal: PMax reversal that happened in the last bar and cannot be repainted.
Potential Reversal: PMax reversal that might happen in the current bar but can also not happen depending upon the timeframe closing price.
Downtrend: Tickers that are currently in the sell zone
Uptrend: Tickers that are currently in the buy zone
Screener has also got a built in PMax indicator which users can confirm the reversals on graphs.
Screener explores the 20 tickers in current graph's time frame and also in desired parameters of the SuperTrend indicator.
Also you can optimize the parameters manually with the built in STRATEGY version.
PMax indicator :
Profit Maximizer - PMax is a brand new indicator developed by me.
It's a combination of two trailing stop loss indicators;
One is Anıl Özekşi's MOST (Moving Stop Loss) Indicator
and the other one is well known ATR based SuperTrend
Profit Maximizer - PMax tries to solve this problem. PMax combines the powerful sides of MOST (Moving Average Trend Changer) and SuperTrend (ATR price detection) in one indicator.
Backtest and optimization results of PMax are far better when compared to its ancestors MOST and SuperTrend. It reduces the number of false signals in sideways and give more reliable trade signals.
PMax is easy to determine the trend and can be used in any type of markets and instruments. It does not repaint.
The first parameter in the PMax indicator set by the three parameters is the period/length of ATR.
The second Parameter is the Multiplier of ATR which would be useful to set the value of distance from the built in Moving Average.
I personally think the most important parameter is the Moving Average Length and type.
PMax will be much sensitive to trend movements if Moving Average Length is smaller. And vice versa, will be less sensitive when it is longer.
As the period increases it will become less sensitive to little trends and price actions.
In this way, your choice of period, will be closely related to which of the sort of trends you are interested in.
We are under the effect of the uptrend in cases where the Moving Average is above PMax;
conversely under the influence of a downward trend, when the Moving Average is below PMax.
Built in Moving Average type defaultly set as EMA but users can choose from 8 different Moving Average types like:
SMA : Simple Moving Average
EMA : Exponential Movin Average
WMA : Weighted Moving Average
TMA : Triangular Moving Average
VAR : Variable Index Dynamic Moving Average aka VIDYA
WWMA : Welles Wilder's Moving Average
ZLEMA : Zero Lag Exponential Moving Average
TSF : True Strength Force
Tip: In sideways VAR would be a good choice
You can use PMax default alarms and Buy Sell signals like:
1-
BUY when Moving Average crosses above PMax
SELL when Moving Average crosses under PMax
2-
BUY when prices jumps over PMax line.
SELL when prices go under PMax line.
ค้นหาในสคริปต์สำหรับ "bar"

Swing Index System - Heiken Ashi Pivot Breakout StrategyFor Educational Purposes. Results can differ on different markets and can fail at any time. Profit is not guaranteed.
This only works in a few markets and in certain situations. Changing the settings can give better or worse results for other markets. This is a breakout strategy that uses the heiken ashi bars to find the support and resistance levels or the swing pivots to try to objectively find a breakout. When the price breaks out of a swing pivot, breakout can be confirmed and a strategy can be made. The trade exits as soon as in profit when the heiken ashi bar changes color, when the price swings start to slow down, or when the price breaks below a swing pivot. There might be many strategies and possible ideas that can be made just from knowing where the swing pivots are alone. For this one, I decided to try to emulate Wilder's Adam Theory approach by entering only a specific criteria when it makes new highs or lows that I experimented with. The Swing Index System seems to be similar to what he describes in his book (or perhaps it is the same thing).
Some say that price is the ultimate indicator, but not many really know what that really means. This is yet another approach to try to interpret what that means. This strategy only contains a piece of the complete breakout and trend strategy approach of the Adam Theory and won't be profitable in every market under every situation. This does not include price patterns that the Swing Index System is said to be able to find such as chart patterns, wedges, tops/bottoms, etc. This only includes the small breakout portion requirement in the book. I included specific entry and exit criteria to make the strategy work well that involves nothing but the price action of the swing points only due to the lack of the other missing pieces. It does not contain the missing pieces. Despite this, it can still help find where breakouts might be in an objective matter using the Swing Index System as a standalone trading system and it doesn't involve lookbacks or anything but price alone.

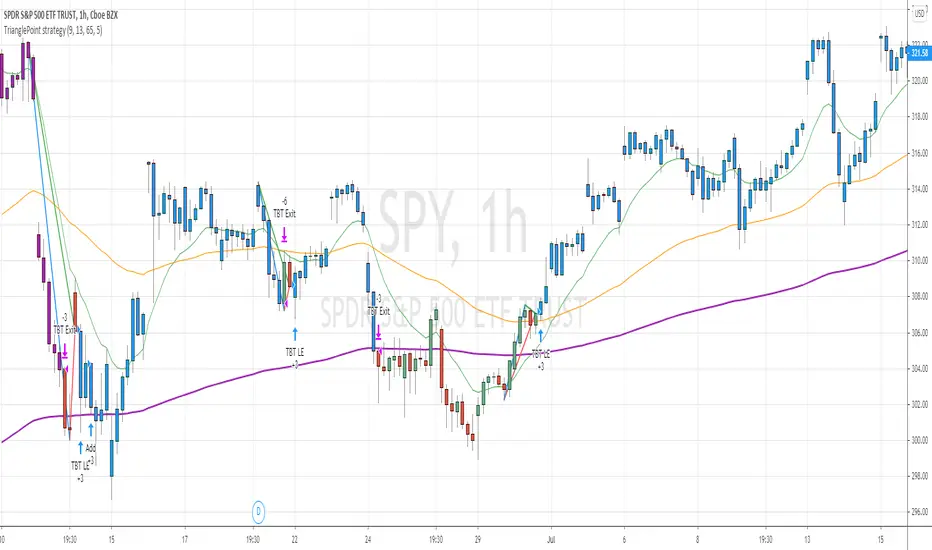
TrianglePoint strategyThis is trend following strategy ... when price is trading well above 200 ema and forms a triangle (based on number of bars defined)
BUY
====
when fast ema > 200 ema
check for triangle of last N bars (default set to 9)
EXIT
======
when fast ema crosses down middle term ema
if price reaches above 5% of buy , it changes the color to purple. You can close any time or wait for above signal.
STOP LOSS
=======
stop loss default value set to 5%
Note: No triangle shown on the chart. I will find out how to add the lines to the chart.
Warning
=========
For the use of educational purposes only
ADX strategy (considering ADX and +DI only )I have been checking the strategies on ADX indicator.
I have found that +DI crossing above ADX line under threshold 30 and exit on crossdown when ADX above 30 has better results than just following crossovers of +DI and -DI , ADX crossing above 30 .
BUY Rule
========
fast ema is above slow ema (default 13 and 55 , you can change these values in settings)
+DI cross above ADX well beloe threshold level (default 30)
Exit reule
========
when +DI cross down ADX , well above on threshold level
Stop Loss
=========
Default is set to 8%
Take a look and let me know how your symbol works with this strategy
Note : Bar color changes to yellow when the BUY condition is met.
Bar color and Background color shows to blue --- if Long position is active
fast ema and long ema doesnt print on the chart -- please add manually to the chart
Warning : for the use of educational purposes only

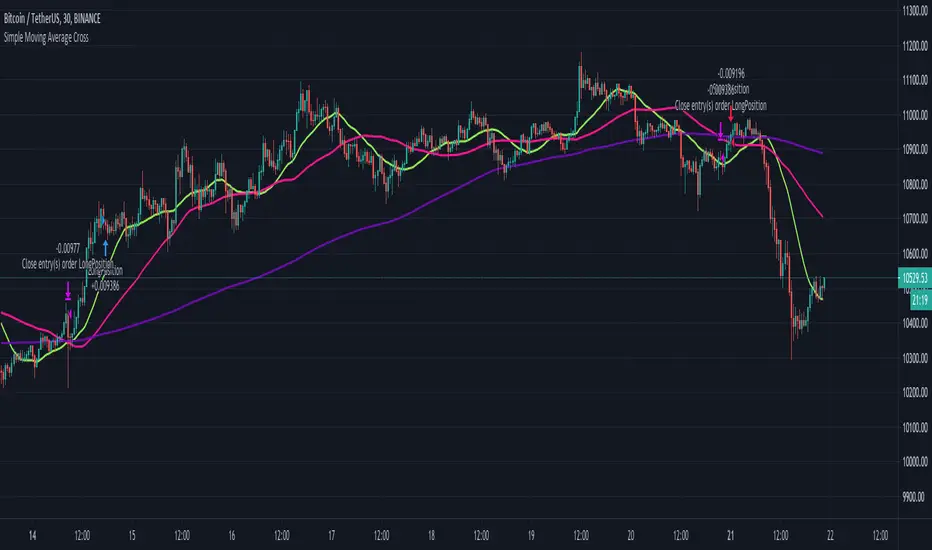
Simple Moving Average CrossThe script uses 3 simple moving averages that you can define (SMA Top, SMA Mid, SMA Long).
Once the SMA Top is above the SMA Mid and the SMA Mid is above the SMA Top a long position is entered.
Once the SMA Top is below the SMA Mid and the SMA Mid is below the SMA Top a short position is entered.
You may define how long before these positions are entered by adjusting the bars in the Inputs section.
A setting of 0 will enter a position as soon as the conditions are met,
whereas a setting of 5 will wait 5 bars after the conditions are met before entering the positions.
Tilson T3 and MavilimW Triple Combined StrategyInspired by truly greatful Kivanç Ozbilgic (www.tradingview.com).
The strategy tries to combined three different moving average strategies into one.
Strategies covered are:
1. Tillson T3 Moving Average Strategy
Developed by Tim Tillson, the T3 Moving Average is considered superior to traditional moving averages as it is smoother, more responsive and thus performs better in ranging market conditions as well. However, it bears the disadvantage of overshooting the price as it attempts to realign itself to current market conditions.
It incorporates a smoothing technique which allows it to plot curves more gradual than ordinary moving averages and with a smaller lag. Its smoothness is derived from the fact that it is a weighted sum of a single EMA, double EMA, triple EMA and so on. When a trend is formed, the price action will stay above or below the trend during most of its progression and will hardly be touched by any swings. Thus, a confirmed penetration of the T3 MA and the lack of a following reversal often indicates the end of a trend. Here is what the calculation looks like:
T3 = c1*e6 + c2*e5 + c3*e4 + c4*e3, where:
– e1 = EMA (Close, Period)
– e2 = EMA (e1, Period)
– e3 = EMA (e2, Period)
– e4 = EMA (e3, Period)
– e5 = EMA (e4, Period)
– e6 = EMA (e5, Period)
– a is the volume factor, default value is 0.7 but 0.618 can also be used
– c1 = – a^3
– c2 = 3*a^2 + 3*a^3
– c3 = – 6*a^2 – 3*a – 3*a^3
– c4 = 1 + 3*a + a^3 + 3*a^2
T3 MovingThe T3 Moving Average generally produces entry signals similar to other moving averages and thus is traded largely in the same manner.
Strategy for Tillson T3 is if the close crossovers T3 line and for at least five bars the close was under the T3
2. Tillson T3 Fibonacci Cross
Kivanc Ozbilgic added a second T3 line with a volume factor of 0.618 (Fibonacci Ratio) and length of 3 (fibonacci number) which can be added by selecting the T3 Fibonacci Strategy input box.
Strategy for Tillson T3 Fibo is when the Fibo Line crossover the T3 it gives long signal vice versa.
3. MavilimW
MavilimW is originally a support and resistance indicator based on fibonacci injected weighted moving averages.
Strategy for MavilimW is is if the close crossovers T3 line and for at least five bars the close was under the T3
Hope you enjoy

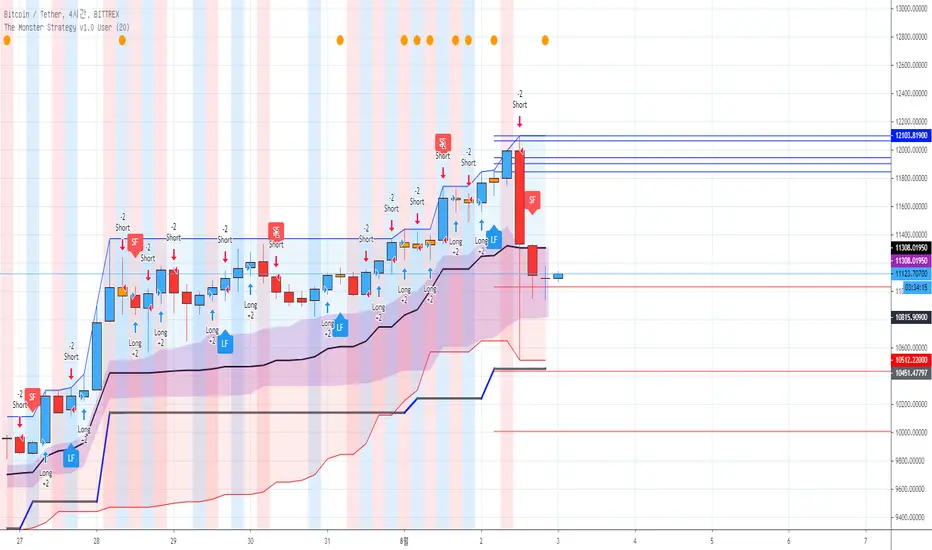
[AngelHouse] The Monster StrategyHello, I'm Angelhouse, a crypto analyst and indicator developer. :)
I would like to introduce you to the newly developed "The Monster" strategic indicators.
The indicator is an upgraded version of the existing "All Eating" strategy indicator.
- The "Monster" indicator is a strategic indicator created for crypto market transactions.
- This indicator is based on a four-hour time zone and is a strategic indicator using the intersection of the threshold.
- If a plot is crossed, a call is in progress or crossed, a sales signal is generated.
※ Explanation of the "The Monster" Strategy Indicator v1.0
1. Long & Short: You can configure your swing strategy based on the signal.
The All Eating Strategy indicator is based on a four-hour frame. Due to the logic nature, the signal does not match at a time higher than 4 hours. Therefore, we recommend that you use the indicator only in a time zone of 4 hours or less.
Also, the signal does not have 100% accuracy, so even if you configure a strategy based on the signal, it is recommended that you set the break/break line and respond.
2. Long Feel & Short Feel: The signal is also quite reliable. The strength of the signal is very reliable when a strong rise and a strong fall occur.
However, the downside is that there may be some offbeat in the transverse section. However, even if the index is offbeat, the loss is small, and if the stock price rises or falls, high expected returns can be expected.
You can use the signal alone, but if you use the Long & Short indicator, you can get better results. If the Long Feel & Short Feel signal is also generated where the Long & Short signal is generated, the probability will be higher, right?
3. Candle color: White cans are formed when cans such as dojorpoenor hammer are generated. The cans have a meaning of reversal when they occur after a strong rise or fall, and can continue the trend when they occur during an ongoing trend.
4. Single item band: The single item band consists of the strong area (blue area) and the weak area (red area) based on the reference line. Stock prices can indicate additional gains when they are in the bullish zone, and additional declines when they are in the weak zone.
Also, you can recognize the top of the strong zone as the resistance line and the bottom of the weak zone as the support line.
The cloud stand in the single band should be located in front of the band for 26 days, but it is also recognized as a role of support and resistance.
5. 1D Baseline: The line of one bar is recalled to 4 hours. blue when the reference line is positive, red when negative, and gray when horizontal, and red when the reference line is positive,
Or, in the opposite case, it's time to suspect a trend inflection.
6. Target line : When a specific period is set (default 20 days setting), the target point is provided in each of the 5 lines, from the highest point in the period to the low point of the current bar, and from the lowest point to the high point of the current bar.
※ If you want to obtain access to this indicator with a script dedicated for the first time, please contact the link shown in the signature.
EEMANI - collect money strategy 1This strategy is for stock market ONLY
Strategy: EEMANI ... Collect the money by selling Credit spreads - Tested on SPY index weekly options
This strategy is based on consecutive up and down strategy which is available in TradingView Built in indicator. list, i have added EMA filter to that.
Tested on SPY Hourly chart
============================
ENTRY:
1. when price is consecutively up 3 bars and price is close above EMA (defualt EMA is 8 )
2. consider selling PUT nearest weekly ( SPY weeklies are available for Monday, wednesday and Friday)
Example: if the signal occurs on Monday or Tuesday , Consider selling Wednesday PUT spread
3. PUT strike one leg is mentioned on the chart when signal occurs ( calculate the second value based on your comfortable spread distance, either 5 points or 10 points)
( OR You can chose PUT strikes using a bollinger band --- strike below the lower band )
EXIT:
1. You can wait until the spread expires worthless OR
2. Exit if the short leg is 0.01 OR
3. Exit when 50% of the premium is evaporated (this is to avoid any sudden down spikes )
4. Script is configured to exit after 16 Bars. (that is maximum number of Hourly bars for two days)
StopLoss:
1. when the price touches the Put short leg (as mentioned in entry signal) --- close the position
2. OR when the price touches the Put short leg --- You can defense the position by certain percentage by converting it to IronCondor ,
that means, sell the CALL credit spread ... chose the strikes above upper Bollinger Band
happy Trading
Warning: for educational purposes only

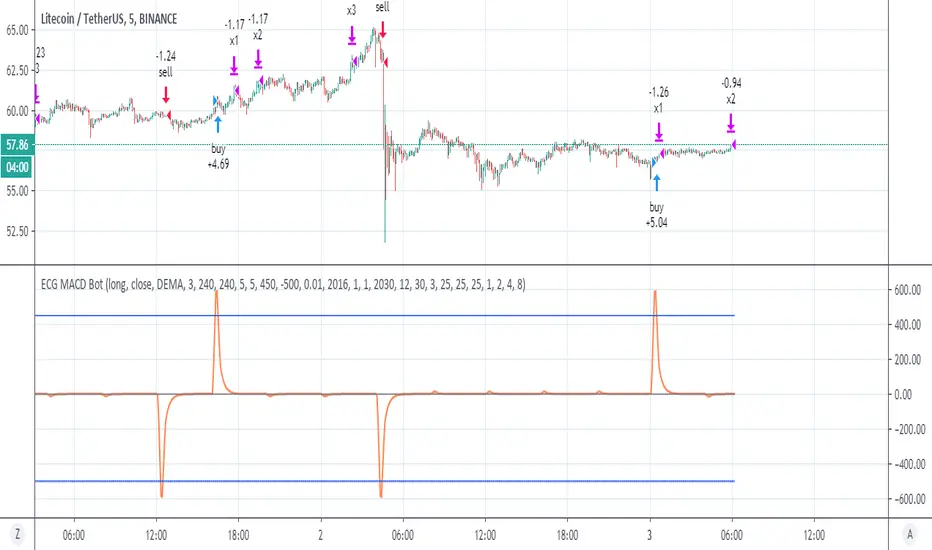
ECG MACD Botok this is hybrid of ECG bot -and MACD
in the ECG bot it combination of vwap and RSI
here I use different combination that may be even better which is a regular MACD and the rsi ECG bot .
you need to understand how this system work in order to make it best for you
first theory-
The ECG bot and this one base on simple but very strong idea which is there is differnt between repainted MTF to non repainted MTF
So if you put the same MTF 1 security (repaint ) and MTF 2 security (non repaint ) then the difference between them is the repaint distance.
so if i build model of buy force vs sell force on this diffrence.
SInce security is so dominant in the repaint model it force the signal to be at certain time . but also doing so it calculate the buy and sell force of the privoius day . which is very powerfull signal.
so puting to system of minus and plus the repaint model will produce signals. and due to security the strongest one will be when security finish it calculation at a specic time done by the MTF. so this is the "repaint signal" that make the repiant strategy to work so well.
my system is just to dump the unwanted noise and to keep the repaint ones. so by this reduce true repaint to be mimimum.
I hope you understand the idea . it not perfect but i thnk we are very close (i hope)
The MACD is your source so you can change the fast and slow to what ever you wish
the repaint system is conrol by the repaint control
if you use 60 min it need to to be 60 or more then that . if you use 30 min candle then use 30 etc
for each thing you do you must use the bar control to adjust it
as you need to adjust the upper treshold of the buy and the sell
for crypto this setting ok, you may change the lower treshold so use bar repaly to see where it was repaint and by that you can fix it
for stocks use 1 week MTF on 4 hour candle , increase repiant control to 240
for forex it same as crypto but you need to adjust to any coin that you use.
for further questions please let me know
once this project prove it idea that it safe i will make study version .
So do not put any 1 cent before you run all the test needed and live demo test to see how it work on real life
I put lower treshold on -450, on alts change it o -400
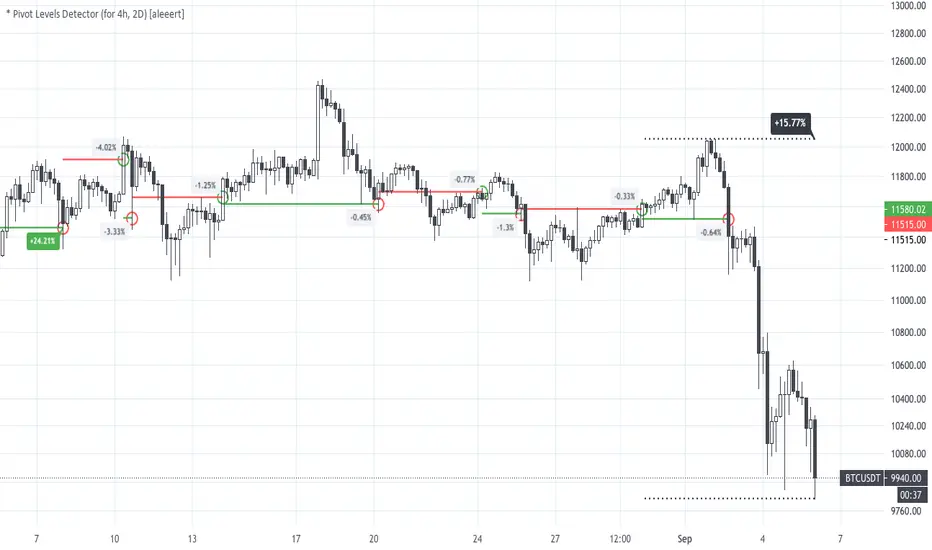
* Pivot Levels Detector (for H4, D2) [aleeert]Pivot Levels Detector is the script based on idea about breakouts of pivot levels which based on certain numbers of bars used for reaching the target and breakout the level. Working timeframes are H4 and 2D . The script works better with BTCUSD, ETHUSD, EOSBTC, AAPL, TSLA.
No repainting!
The script doesn't use any moving averages or other relative methods which cancel or change data on previous bars. Once the signal is showed it will stay forever.
NOTE: The results from Strategy Tester could slight vary from results you see on the chart. It's because of calculation method used on Strategy Tester, which uses a data from closed bars only, not by target reaching. So the results you see on the chart are more correct.
Follow me for receiving more scripts and indicators.
Regards,
aleeert
Noro's RiskTurtle StrategyThe idea of this strategy script was taken here:
(PDF-Book, English) bigpicture.typepad.com
Strategy
2 Donchian price channels are being created. Fast and slow. The number of candles for the channels is selected by the user. By default, 20 bars for fast and 50 bars for slow. Blue lines show a slow price channel . And used to enter positions. Using market stop orders. A fast price channel is needed to find out the price for stop-loss. This is the center line of the fast channel. Shown by a red line. The background shows when the positions were opened. Lime background for long positions, and red background for short positions. There is no background if there are no positions.
Risk size
Stop Placement
The Turtles placed their stops based on position risk. No trade could incur more than 2% risk.
Since 1N of price movement represented 1% of Account Equity, the maximum stop
that would allow 2% risk would be 2N of price movement. Turtle stops were set at 2N
below the entry for long positions, and 2N above the entry for short positions.
For
- XBT/USD, BTC /USD, BTC /USDT, ETH/USD, ETH/USDT, etc - need ***/(T)USD(T)
- Timeframes 1h, 2h, 3h, 4h

Noro's SimpleTurtle StrategyThis is a highly simplified version of the Turtle strategy. It is very different from the original Turtle strategy.
Lines
2 Donchian price channels are being created. Fast and slow. The number of candles for the channels is selected by the user. By default, 20 bars for fast and 50 bars for slow. Blue lines show a slow price channel. And used to enter positions. Using market stop orders. A fast price channel is needed to find out the price for stop-loss. This is the center line of the fast channel. Shown by a red line. The background shows when the positions were opened. Lime background for long positions, and red background for short positions. There is no background if there are no positions.
For
- XBT/USD, BTC/USD, BTC/USDT, ETH/USD, ETH/USDT, etc - need ***/(T)USD(T)
- Timeframes 1h, 2h, 3h, 4h

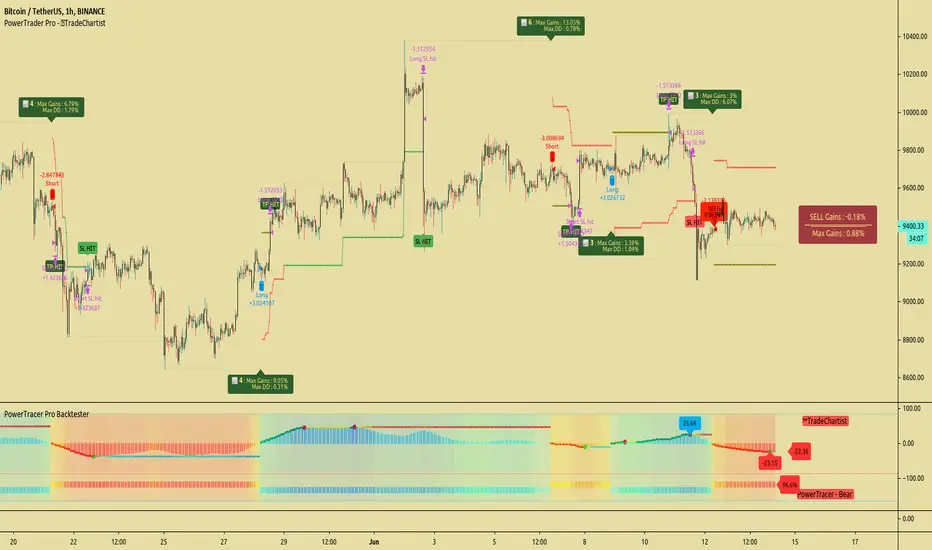
TradeChartist PowerTracer Pro Backtester™TradeChartist PowerTracer Pro Backtester is the strategy script for backtesting ™TradeChartist PowerTracer Pro for best performance settings which can then be used with ™TradeChartist PowerTrader Pro to plot Trades emulating the backtester and use Alerts (once per bar) on real time price chart.
PowerTracer Backtester includes the following options in the settings.
PowerTracer setting - Power Plot Type - (PowerTracer, Bar-wise Power Holder)
PowerTracer setting - Timeframe Multiplier
PowerTracer setting - Smoothing Factor
Backtester setting - Trade Direction - (Both Longs and Shorts, Only Longs, Only Shorts)
Backtester setting - SL Type (Fixed Stop Loss, Trailing Stop Loss)
Backtester setting - Reference for Trailing SL (Close, High/Low)
Backtester setting - Stop Loss %
Backtester setting - Take Profit %
Backtester setting - Quantity to trade at TP %
Using combinations of the settings, the user can find optimal settings for the asset to deliver lucrative entry and exit signals with high ROI and minimal Drawdown which can then be used on PowerTracer Pro and PowerTrader Pro to plot signals and create alerts to start trading in real-time.
Example charts:
GBP-USD 1hr chart - (2,1,Trailing SL, close, 1,1,25)
BTC-USDT 15m chart - (4,5, Trailing SL, high/low, 3.9,1.2,15)
SPX 1hr chart - (1,3, Trailing SL, high/low, 3, 2, 50)
This backtester needs the following scripts to generate signals and plots on main price chart and for real-time alerts
™TradeChartist PowerTracer Pro
™TradeChartist PowerTrader Pro
===================================================================================================================
This is not a free to use indicator. Get in touch with me (PM me directly if you would like trial access to test the indicator)
Premium Scripts - Trial access and Information
Trial access offered on all Premium scripts.
PM me directly to request trial access to the scripts or for more information.
===================================================================================================================
Support/ Resistance with H1 ATR - strategy mainline versionThis script using ATR (average true range) with source hl2 for create Support/ Resistance line
The color meaning:
- Green = Support line
- Red = Resistance line
Signal:
- If close price breakout Resistance line -> LONG signal will been active.
- If close price breakout Support line -> SHORT signal will been active.
Input setting:
Recommended default setting.
- Factor: amplitude for create Support/ Resistance line.
- Length: length of ATR.
- Offset: number of bar for check sideway or choppy market.
- Take profit: if you want test close position by profit.
- Stop loss: should not be missed.
- Open Position with Stop-Market type:
+ Open LONG position with high price and type Stop-Market.
+ Open SHORT position with low price and type Stop-Market.
Strategy setting:
Recommended default setting if you trade on Binance Futures or change Comission if you trade on another exchange.
Best backtest if:
- Max drawdown less than 10%.
- Min backtest time: 6 month.
- Avg profit: 10%/ month when no leverage is used.
Alert version:
1 - Select create new alert
2 - Condition:
+ eb BUY -> LONG signal
+ eb BUY close -> close LONG position
+ eb SELL -> SHORT signal
+ eb SELL close -> close SHORT position
3 - Option: recommended using only. Because the signal will be more accurate if the price close breakout successfully.
+ Always put stop loss position to avoid PUMP/ DUMP market.
// Note: alert version not free, send for me a private message on TradingView to get price and gain access.
Recommended:
- Using in M30, M45, H1 timeframe with default setting.
- Symbol: BTC
- Exchange: Binance Futures
- Order size: 10% wallet balance, maximum 25% wallet balance.
- Leverage: X2-X5, maximum X10.
---> I using 10% wallet balance and X2 only.

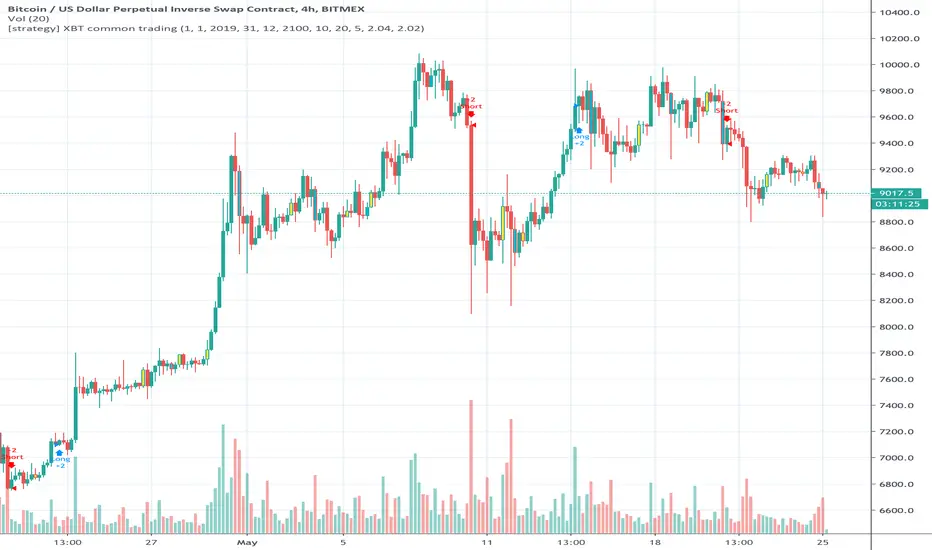
[strategy] XBT common tradingTrend following strategy for XBTUSD .
Optimized for XBTUSD 4H chart
* Description of indicator setting
Trend Channel Length: determine trend channel length (bars)
Trend Average Length: determine length of measuring average price (bars)
Trend Period: period of detecting trend changing
Strength Short: exceeding strength of trend changing (short)
Strength Long: exceeding strength of trend changing (long)
* default setting is recommended, but you can optimize or change trading pattern by changing setting values
* backtesting results do not guarantee future results.
If you want to use this strategy, contact me with my profile information below.
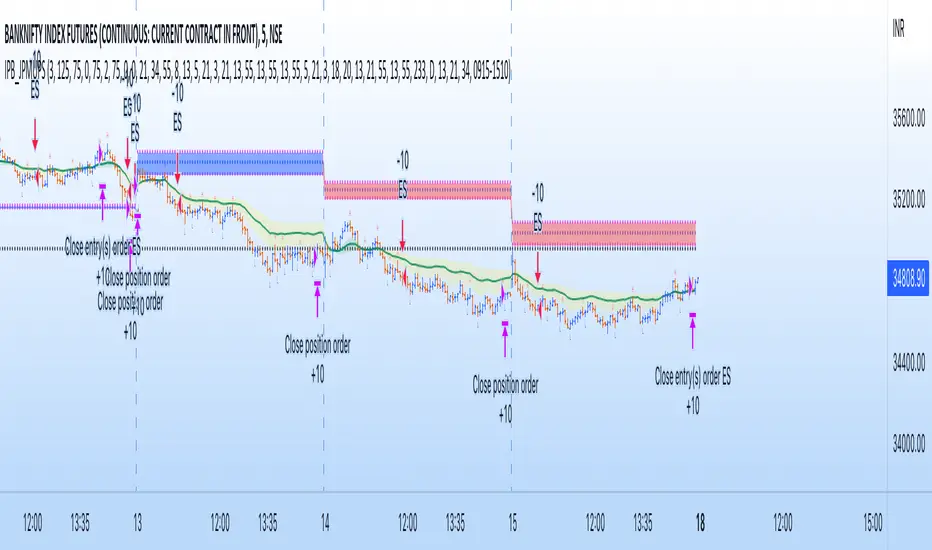
IndianPivotBossJP_MUPSThis is an advanced form of MUPS pivot intraday trading system.
Use this indicator with the following indicators :
1) IndianPivotBossPivotShift.
2) IndianPivotBossPivotRSI
3) PBOscillator
4) IndianPivotBossADMIN
When all the four indicators are sloping upwards, the long setup is triggered.
The indicators bars turns blue when each of them begins to slope upwards.
For a convincing indication, look for 3 consecutive blue bars in all of them for a long setup.
Once the setup is confirmed, all you have to do is to plan your entry.
Ensure there is no overhead resistance in the form of any pivot levels or any other key levels when you go long after the setup.
Reverse logic for short.
Combo Backtest 123 Reversal & ECO Strategy This is combo strategies for get a cumulative signal.
First strategy
This System was created from the Book "How I Tripled My Money In The
Futures Market" by Ulf Jensen, Page 183. This is reverse type of strategies.
The strategy buys at market, if close price is higher than the previous close
during 2 days and the meaning of 9-days Stochastic Slow Oscillator is lower than 50.
The strategy sells at market, if close price is lower than the previous close price
during 2 days and the meaning of 9-days Stochastic Fast Oscillator is higher than 50.
Second strategy
We call this one the ECO for short, but it will be listed on the indicator list
at W. Blau’s Ergodic Candlestick Oscillator. The ECO is a momentum indicator.
It is based on candlestick bars, and takes into account the size and direction
of the candlestick "body". We have found it to be a very good momentum indicator,
and especially smooth, because it is unaffected by gaps in price, unlike many other
momentum indicators.
We like to use this indicator as an additional trend confirmation tool, or as an
alternate trend definition tool, in place of a weekly indicator. The simplest way
of using the indicator is simply to define the trend based on which side of the "0"
line the indicator is located on. If the indicator is above "0", then the trend is up.
If the indicator is below "0" then the trend is down. You can add an additional
qualifier by noting the "slope" of the indicator, and the crossing points of the slow
and fast lines. Some like to use the slope alone to define trend direction. If the
lines are sloping upward, the trend is up. Alternately, if the lines are sloping
downward, the trend is down. In this view, the point where the lines "cross" is the
point where the trend changes.
When the ECO is below the "0" line, the trend is down, and we are qualified only to
sell on new short signals from the Hi-Lo Activator. In other words, when the ECO is
above 0, we are not allowed to take short signals, and when the ECO is below 0, we
are not allowed to take long signals.
WARNING:
- For purpose educate only
- This script to change bars colors.

PowerBot Binary Backtest FrameworkHello Traders,
This is the backtest framework for testing the Powerbot algorithm before activating alerts which can be used for precise Trading.
Powerbot can be used across any timeframe and across any expiration based on the performance
This backtest comes with some features to help traders make a decision on the following:
When using the indicator itself.
1. We use our proprietary algorithm - "Powerbot binary algorithm script", which is Public but can only be accessed based on request. If you would like to use the algorithm please ensure you have tested different assets and varying expiration for your trades through the backtest - if you don't know how to do that please contact us by sending a message.
EXPLORE YOUR OPTIONS FOR TRADING THROUGH VARIED ITERATION.
2. You can choose any expiration time by changing the expiration time period from the 'settings' button, this will display new results. example; on a 5 minutes chart timeframe, 6 bars would be 30 minutes, which means 5 minutes times 6, which is 30 and minutes because your timeframe is set to minutes. Another example is that on a 1-hour timeframe, 12 bars would be 12 hours, given 1 * 12 is 12hours, because your timeframe is set to hours.
3. You can choose the trading session you want, please note that we have included the three most active sessions - ASIAN, EU/UK, & US Session, by default, the scripts checks for performance on 24/7, which means it does not omit trades outside of the trading session. The Tradingview time is in UTC (or GMT -4). The best times to trade are during sessions most active times.
This backtesting indicator is free to add to the chart if you would like to use the algorithm during your trading session you need to contact us. After which you can use the algorithm for as long as you want.
Please note that no signal can work in all timeframe across all markets that is why backtesting to search for algorithms with at least 50% performance ratio is excellent for trading. All you need is to diversify alerts across to assets or more to rake in profits.
If you require assistance in understanding what session would work best, you can send us a message to work through the process together.
Thank you for you support. This script is free to use to see potential of the indicator itself.
We are NOT allowed to advertise any script on sale based on tradingview house rules.
Wishing you all the best.

Bull Flag v1.00Identifies the chart pattern we recognize as a Bull Flag, enters long, then exits 6 bars later. I do not claim this to be a good strategy, but a lot of people think the Bull Flag is (statistically) meaningful. This is a tool for you to test that claim. The exit after 6 bars is somewhat arbitrary, but it's basically "hold this position for a little bit to see if bull flags actually do anything."

BO - RSI - M5 BacktestingBO - RSI - M5 Backtesting -Rule of Strategy
A. Data
1. Chart M5 IDC
2. Symbol: EURJPY
B. Indicator
1. RSI
2. Length: 12 (adjustable)
3. Extreme Top: 75 (adjustable)
4. Extreme Bottom: 25 (adjustable)
C. Rule of Signal
1. Put Signal
* Rsi create a temporary peak over Extreme Top
row61: peak_rsi= rsi >rsi and rsi >rsi and rsi rsi_top
2. Call Signal
* Rsi create a temporary bottom under Extreme Bottom
row62: bott_rsi= rsi rsi and rsi

Ichimoku Kinko Hyo Cloud + QQECombination of two strategies with alerts. Those scripts are not mine, I just mixed them up for own purposes.
I recommend use long alerts of Ichimoku in 15 minutes bars and short alerts of QQE strategy in 15 minutes bars as well.
QQE strategy should be used for quick price movements and Ichimoku for litle longer ones.
Good Luck!

Stochastic Pop and Drop by Jake Bernstein v1 [Bitduke]I found a simple strategy by Jake Bernstein, modified it a little and created a strategy with Risk Management System (SL+TP); After that I test it on the different cryptocurrency pairs.
About the Indicator
Basically it's the strategy of 2 indicators: Stochastic Oscillator to define the bias and Average Directional Index to confirm it.
One again, It uses Stochastic Oscillator to define the trading bias. In particular, the trading bias was deemed bullish when the weekly 14-period Stochastic Oscillator was above some default value (in him paper - 50) and rising and vice versa.
Once the trading bias is established, Steckler used the Average Directional Index (ADX) to define a slowdown in the trend. ADX measures the strength of the trend and a move below 20 signals a weak trend.
Modifications
I didn't implement Average Directional Index (ADX) and test just different sources for data, oscillator periods and different levels in relation to the crypto market.
So, it shows good results with two tight thresholds at 55 and 45 level.
The bar chart below the defining the bullish and bearish periods (green and red) and gives a signal to enter the trade (purple bars).
Backtesting
Backtested on XBTUSD , BTCPERP (FTX) pairs. You may notice it shows good results on 3h timeframe.
Relatively low drawdown
~ 10% (from 2019 to date) FTX
~ 22% (4 years from 2016) Bitmex
I backtested on the different altcoin pairs as well, but the results were just not good.
Relatively good results were shown by some index pairs from the FTX exchange ( FTX:SHITPERP ), but I think there is a few data for backtesting to be asure in them.
Bitmex 3h (2017 - 2020) :
i.imgur.com
FTX 3h (2019 - 2020):
i.imgur.com
Possible Improvements
- Regarding trading algorithm it would be good to check with strategy with ADX somehow. Maybe for the better entries
- As for Risk Management system, it can be improved by adding trailing stop to the strategy.
Link: school.stockcharts.com

Multi RIS Length RSI Strategy calibrated to 20min timeframeI have been working on many itterations of this script, on multiple time frames, with multiple settings.
It's not exactly how I want it, but if used on the 20 min timeframe (I chose this one to publish, not because it's the most profitable, or percent profitable , but for multiple other reasons.
1) From my back testing, this seems to be the most stable (gives the greatest margin for error). By that I mean, I am not a bot, I am a human trader, so I actually have to sleep, and work, and can't always trade all the time when I when I get my signals. So I need some margin of error.
The 20min time frame gives me this, it's still decently profitable (52K), and allows me some margin of error for being human.
2) It not exactly how I want it, because you have to use it in conjunction with the strategy tester to see if it is in longs or shorts (open trades). You can't see that on the app, or even if you are logged in to TV on a browser on a smart phone. At least I cant, I can only see the strategy tester when I am logged in on my computer, which obviously I can not be all the time.
3) It's also not exactly how I want it because it doesn't tell you when it is switching from buying additional longs (or shorts), and closing them out, and reversing. You can figure this out from the strategy tester, but I would like my script to make it more clear in real time.
4) The alerts on the script only fire after the current bar is closed. So really to use this you need to be a non free member or TV, because then you can add the appropriate RSIs to your chart, and set up real time alerts on them that will fire in real time, as opposed to displaying on the chart after the bar closes (a lot can happen in 20 minutes). Which is sad, and not my intent, I want this to be useful to free members, I just don't know how to do that given they don't have custom time frames (like 20 min), and multiple real time alerts. I can't fix that, that's a limitation of TV.
