Bullish Engulfing AlertThis is a Bullish Engulfing Candle Indicator with Alerts.
This is not like any other Bullish Engulfing candle indicator present on TV. There are some special rules that are being used to identify specific engulfing candles.
Also, the user can choose if they like nice body engulfing or they want to ignore them.
The indicator have the following highlights:
1) Ability to choose the color of the engulfing candle body.
2) Ability to choose a different color for the Liq (liquidity) swap engulfing candle body.
3) With above 2 options, you can get the desired information without plotting any extra information on the chart.
4) You can put the alerts for getting notified when these patterns forms on the chart.
5) Ability to choose between getting notified or not on the chart if the engulfing candle body is less than 40% of the whole candle size. This is useful in order to identify if the engulfing is really powerful or not.
6) Ability to choose between getting notified or not on the chart if the engulfed candle body is really small. This is in particular useful for avoiding the engulfing of Doji which in turn might not be that powerful.
We will keep on making the improvements/Enhancements over the time (Check the changelog for such features)
NOTE: The indicator is of best use if you have a defined & back tested strategy which relies on this type of candlestick pattern.
ค้นหาในสคริปต์สำหรับ "alert"

Bearish Engulfing AlertThis is a Bearish Engulfing Candle Indicator with Alerts.
This is not like any other Bearish Engulfing candle indicator present on TV. There are some special rules that are being used to identify specific engulfing candles.
Also, the user can choose if they like nice body engulfing or they want to ignore them.
The indicator have the following highlights:
1) Ability to choose the color of the engulfing candle body.
2) Ability to choose a different color for the Liq (liquidity) swap engulfing candle body.
3) With above 2 options, you can get the desired information without plotting any extra information on the chart.
4) You can put the alerts for getting notified when these patterns forms on the chart.
5) Ability to choose between getting notified or not on the chart if the engulfing candle body is less than 40% of the whole candle size. This is useful in order to identify if the engulfing is really powerful or not.
6) Ability to choose between getting notified or not on the chart if the engulfed candle body is really small. This is in particular useful for avoiding the engulfing of Doji which in turn might not be that powerful.
We will keep on making the improvements/Enhancements over the time (Check the changelog for such features)
NOTE: The indicator is of best use if you have a defined & back tested strategy which relies on this type of candlestick pattern.

Movable Stop + Trail + Alerthello everybody !
.....
this indicator helps you to get a better trading setting.
it's similar to the default draw tool from the trading view but the difference is you can add Trail stop and Alert .
.....
It also helps to free accounts to set more than 1 Alarm !!!
.....
Alert setting
just remember after you see set an alert if you change stop or entry, the alert will work with previous values/settings.
so you need to recreate an alert.
also don't change alert setting
.....
indicator setting
How is it works ?
...
settings
...
everything on :
you can see the information on the table
...
short sample :
everything on
...
simple short trade setting:
.....
my goal is to upgrade this indicator with your ideas.
not financial advice !
please , share your ideas with me to improve the indicator
I would like to see what you think about this indicator <3
also if you have any ideas to create an indicator or strategy you can make contact with me .
have a great day.

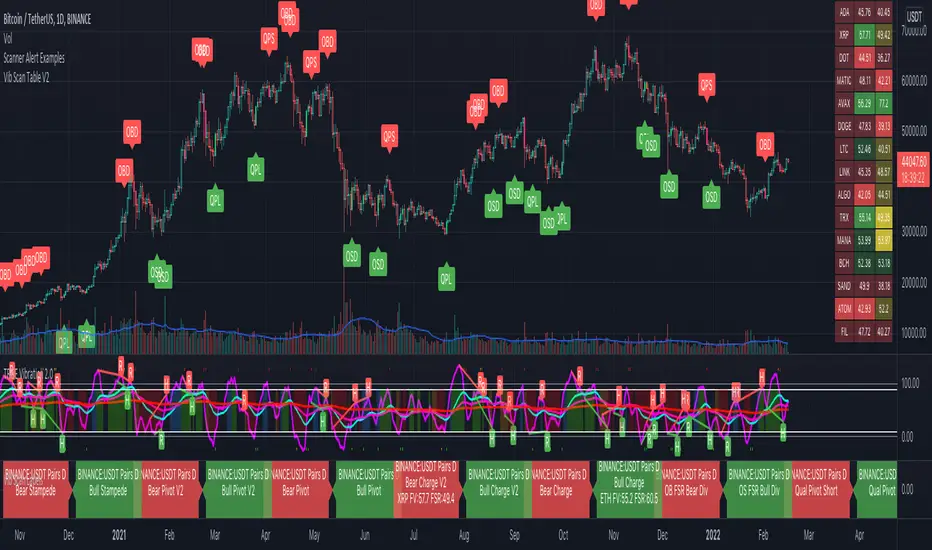
Scanner Alert ExamplesThis is a visual representation of the alerts built into the Vib Scanner Table (right side of main panel) and Vib Scanner Labels (bottom most panel) that are based on Mr. A's TrueVibration (other lower panel). Instead of a table or scanner labels, this indicator will print labels direction under/over candles identifying where the scanners will trigger alert, but this script only looks at a single asset. You can use this script to see how various settings play out across an asset's entire history and fine tune your scanner settings to your likings.
All of the alerts are coded the exact same way across all 3 of these:
Qualified pivots longs trigger with a "potential pivot long" occurs with a higher local low compared to the last time SmoothVib was under 30. Qualified shorts require the potential pivot short occur at a lower local high than the last time SmoothVib was over 70. As with the table, there is the option to choose to either require a Full Reset (SmoothVib goes all the way to the other extreme first) or just a partial reset (SmoothVib only comes out of OB/OS territory and back into it).
Overbought/Oversold FSR Divergences look for regular and hidden divergences in the FSR while it is in overbought or oversold territory.
Charge V1 Bull Alert is triggered when Full Vib is over the Full Vib Bull Threshold and FSR crosses over the Full Vib. Bear alert is Full Vib below Full Vib Bull Threshold and FSR crosses below Full Vib.
Charge V2 uses a "most recent DBI" filter and will trigger an alert any time the FSR crosses the Full Vibration and is in agreement with the most recent DBI .
Pivots V1 Bull Alert is triggered when Full Vib is over the Full Vib Bull Threshold and FSR pivots above the Full Vib. Bear Pivots are the opposite of this.
Pivots V2 look for similar FSR pivots , but with a Leading/Lagging Full Vib comparison. Bull Alerts require Leading Full to be above Lagging Full and the FSR to pivot on top of both. Bear pivots are the exact opposite.
Bull and Bear Stampede's look for FSR crossing over 120 or under -20, respectively, and indicate EXTREME momentum.
Please note: these alerts are my extensions of the TrueVibration indicator and concepts by TrueCrypto28, aka Mr. A. HUGE thank you to him for all his incredible work!
While these scanners can be used as standalone to some extent, an understanding of TrueVibration will take them to another level.
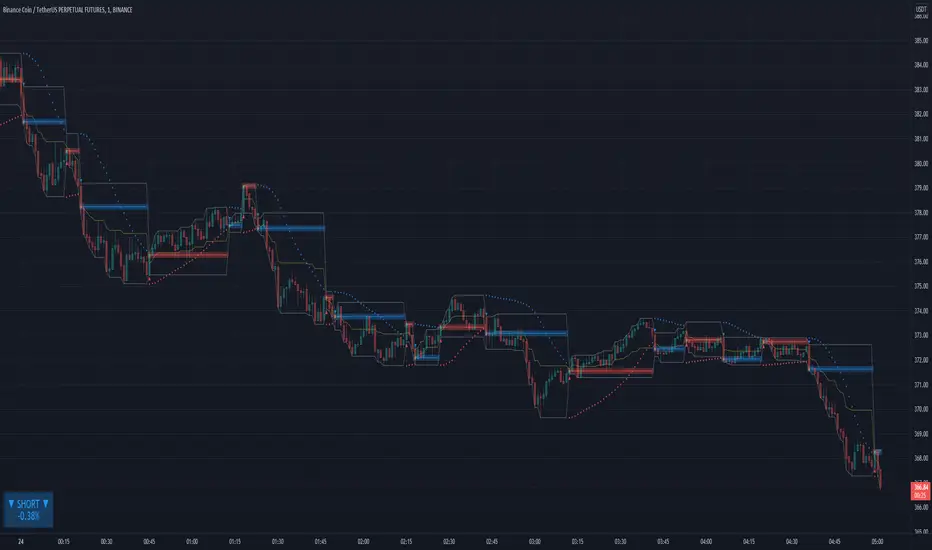
[DA]SAR HILODescription of the indicator:
The SAR indicator will indicate a trend change on the chart:
LONG: Red up arrow + GOLONG alert + red horizontal line
SHORT: Blue down arrow + GOSHORT alert + blue horizontal line
A HILO trend channel is also formed, which is reset when the trend changes.
The HILO channel will help you see the price movement in the channel.
Trend change alerts will only work at the close of the current bar.
For GOLONG/GOSHORT alerts to work, you need to select in the Tradingview menu:
Alerts => Indicator Name => Condition => Any call to the alert() function (Any alert() function call)
Price and trend direction in the table:
LONG + Red: The price is trending LONG
LONG + Yellow: The price is moving against the LONG trend
SHORT + Blue color: The price is moving along the SHORT trend
SHORT + Yellow: The price is moving against the SHORT trend
▲▼ Arrows: Rising/Falling bar
% Percentage taken from blue/red levels
I will be glad to receive your feedback on the indicator operation.
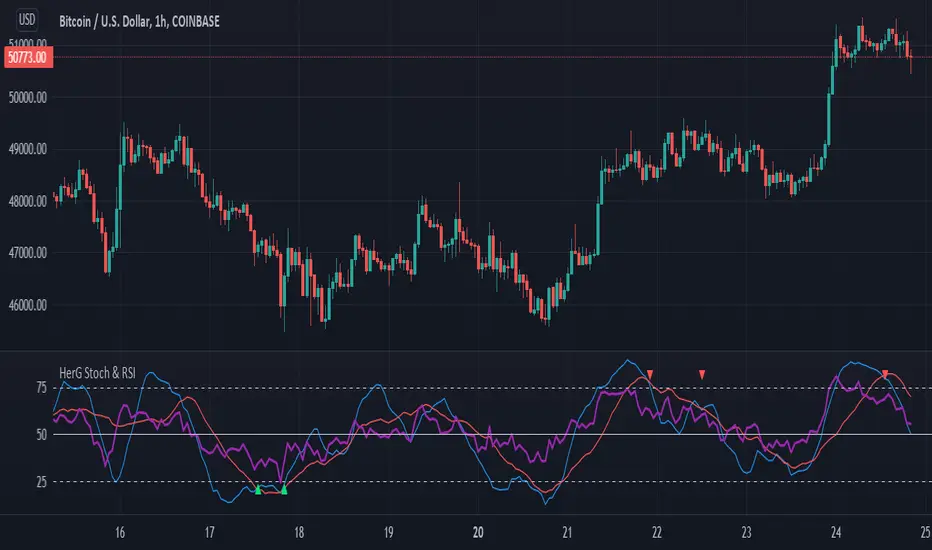
Stochastic and RSI in one indicator with customized alert.Hello Trading Viewers,
I present you Stochastic Oscillator and The Relative Strength Index Indicator inside one indicator, so that it will clear room to view charts.
When Stochastic is over-sold, the fast and slow stochastic underlap along with strong RSI (say above 45) will be a good indicator of buy at low with good risk-to-return of 2x or 3x; therefore I have set a triangle shape indicator within to help you identify or you can simply set an alert as I have coded an customized alert.
Same idea is used when Stochastic is over-bought you will receive an alert when fast & slow stochastic overlaps with RSI falling give a good sell set-up.
There is an option of selecting different timeframes which will further help make the correct decision. Say you are viewing a Daily chart but you want an indicator to present data of 4hrs timeframe, it can be done from the indicator cogwheel option. Default timeframe is "same as charts' ".
Above indicator is universal because settings such as RSI levels and no. of bars to calculate are user defined. You can use it on Crypto, Commodities, Stocks etc.
I suggest you first paper-trade with it and then use it on live account.
Happy trading.
CDC ActionZone Multi-TF,Mult-Ticker with alert() [P-O-Concept]This is proof-of-concept for using single screen displaying triggering signal of multiple stock/crypto
This source code is subject to the terms of the Mozilla Public License 2.0 at mozilla.org
1. Original CDC Action Zone v3 2020 by © piriya33
Source of original indicator :
2. Table concept/part of code is pulled from Portfolio Tracker
***************************************************************************
CDC Action Zone is based on a simple EMA crossover between EMA12 and EMA26
The zones are defined by the relative position of price in relation to the two EMA lines
Different zones can be use to activate / deactivate other trading strategies
The strategy can also be used on its own with acceptable result, buy on the first green candle
and sell on the first red candle
***************************************************************************
Hint Color Meaning :
Green = FastMA > SlowMA and Price is above FastMA
Blue = FastMA < SlowMA and Price is above both MA
LightBlue = FastMA < SlowMA and Price is between both MA
Red = FastMA < SlowMA and Price is below FastMA
Orange = FastMA > SlowMA and Price is below both MA
Yellow = FastMA > SlowMA and Price is between both MA
Blue/LightBlue/Orange/Yellow should be used with another indicator (such as divergent or so)
Cautions:
- This indicator is not meant to be used as "Signal" or "Trading System"
- This indicator provide a quick-glimpse to multiple ticker in same screen. You'll still have to see indications using original CDC Action Zone (If you're using with CDC System), or combining with another indicator (For shorter tf or scalping, or short/long cover)
- Up to 10 Tickers / Timeframe + Current ticker
Alert Creation Guideline
If this indicator will be used as alert. The timeframe for ticker should be set to "same as" the chart you're using, ie, to set alert on 4h, it should be created in 4h-timeframe (Alert is fired on bar close, using 1D-TABLE in 4H-CHART may trigger alert up to 6 times. else if using in 4H-TABLE in 1D-CHART the alert may not trigger at all)
Considering using ohlc4, hlc3, hl2 for market with no session
PS. Send me a message if you see any bug. (especially if using JSON, I have no chance to test with multiple alert at same tick.)

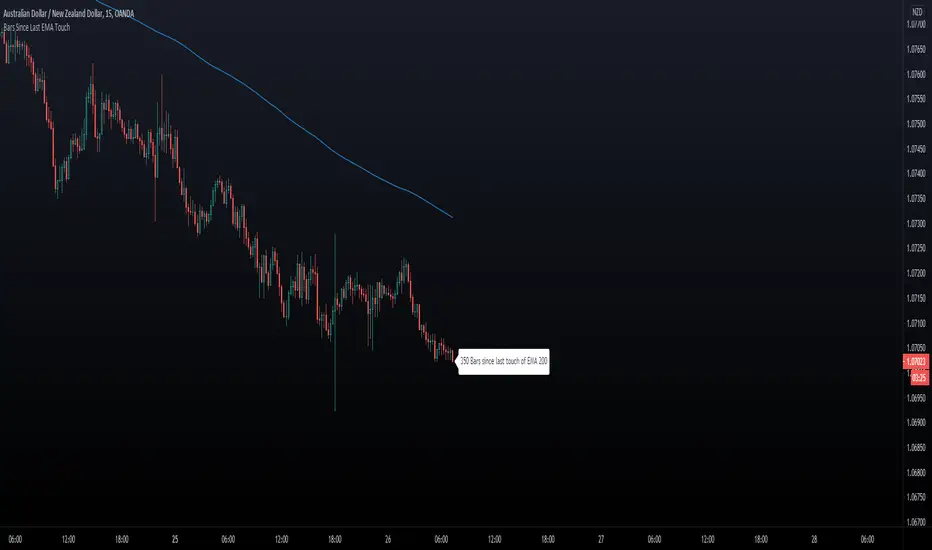
Bars Since Last EMA Touch
This indicator keeps track of how many bars since price touched any EMA last time. You can for example
set 200 EMA. Tell the script to send an alert if/when 400 bars has been reached away from the EMA 200.
- You can hide/show The EMA Line.
- You can hide/show bar Count.
- You can set X bars from EMA to get Alert.
- You can change color of The Badge and EMA line to fit your background colors.
Enjoy!
Another Indicator From The Hunter Trading Group
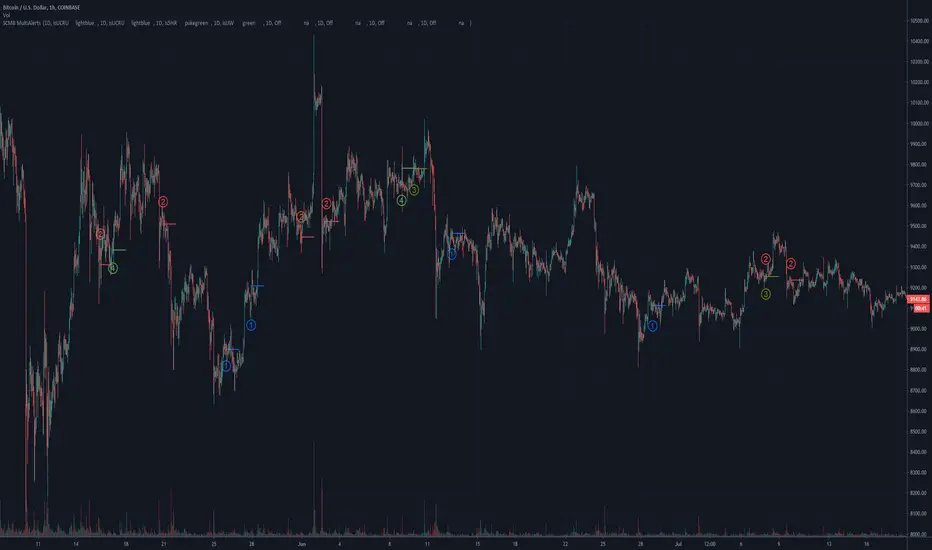
SCMB MultiAlerts - Candle Structure Alert ScriptSCMB Multialerts is a tool for candle structure alert automation.
The input screen allows you to input the timeframe, choose candle structure condition, toggle inverse condition, and toggle Heiken-Ashi for that candle structure trigger condition.
Input the timeframe with the # first and use H - Hour, D - Day, W - Week, and M - Month after the number; example - "1H" - "3D" - "4H" - "1W"
There are 8 total alert conditions that are programmable. You may use any combination of timeframes, inverse/HA, and candle-structure unique to each trigger available at the same time.
When you have set the conditions you want for alerts with the input settings, the color and the position of on-screen alerts is automatically populated.
You can then visually back-test to make sure these settings are desirable
Customize the colors individually, or choose to use "Color0" for all alert conditions by default by "user colors" toggle at the bottom of settings window, then you only need to change "Color0" for each alert condition.
Use the "Indicator Templates" to save your configuration, save several presets with settings for different situations, you can link the settings to a particular symbol as well.
Finally, use the "add alert" feature within tradingview to select the SCMB alert conditions as triggers. TV will deploy alerts with your customized message when each condition is met.
Some notes and known bugs:
Timeframe input requires capital letters for H,D,W,M.
Selecting "Close" Open" or "HL/2" from the drop down will do nothing at the moment. Future release plans to make use of these options.
If there is a feature you would like, question answered, or a bug to report, visit the TradingView SNOW_CITY public chat-room; link in my signature
Use the pastebin link below for indicator access information
MA-EMA Crossover AlertsThis is a script for getting alerts for the MA-EMA XO Strategy that I published recently.
This is probably the first version that I am putting out for this logic.
Based on feedback (and some coding suggestions and support if anyone is willing), I will try to improve this further.
So, what do we have in this script -
I have created 5 alert conditions. The 4 alerts are straight-forward : Entry / Exit alerts for Long / Short.
The fifth alert is just a single Alert which is triggered if any of the 4 alert conditions are met. Then user can check the chart to see what trade is triggered.
I am not explaining the logic of the indicator here since it is kind-of covered in the strategy.

[SignalFI] Simple MA X [3 Stage]Welcome!
This strategy recently came up as a way to stage entries when using simple moving averages for trading on high time-frames.
The goal of this script is to provide early warning for Simple Moving Average (SMA) crosses.
Three events are taken in account:
1) Close crossing above or below the "Fast" SMA
2) Close crossing above or below the "Slow" SMA
3) "Fast" SMA crossing above or below the "Slow" SMA
In this way, you will receive early warning of the main SMA crosses as price rises above or falls below each of the SMAs defined.
The script is fully alertable on each of the defined crosses:
1) Early Bull/Bear = Close crossing above or below the "Fast" SMA
2) Mild Bull/Bear = Close crossing above or below the "Slow" SMA
3) Bull/Bear MA = "Fast" SMA crossing above or below the "Slow" SMA
The idea is that you can split your order entry/exit conditions into stages, during bull markets taking a (example) 33% position when the Early Bull alert fires, 33% at Mild Bull, and the last 33% at Bull MA alerts. Reversing the process when exiting in order to reduce the lagging nature of the standard SMA cross strategy.

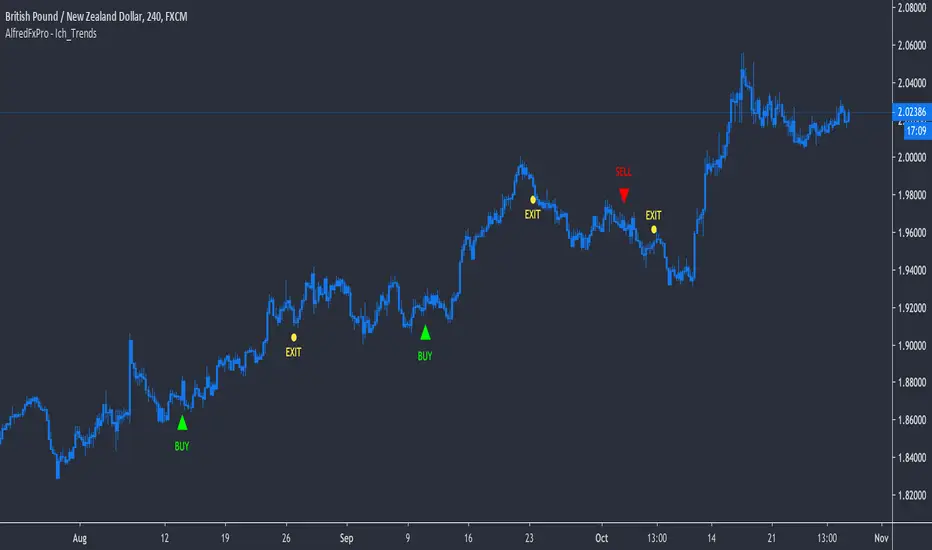
AlfredFxPro - Ichimoku_Trends_AlertsOur powerful Ichimoku Trend Following Scalping Indicator now with LIVE Alerts ( Buy, Sell, Exit Buy, Exit Sell) straight to your PC + Mobile.
*** NO REPAINT *** What you see is what you get. It will fire a signal as soon as the bar close
The (AlfredFxPro - Ich_Trends) uses one element of the famous Ichimoku and combine the signal with two custom volatility indicators to predict potential trends and determine the strength of the trend to keep you in as long as the trend is running or get you out as soon as possible with min loss.
Combine the signal with price action breakout patterns and you have a solid indicator.
It's a very powerful tool to add to your analysis, and make it your own.
**Try on Demo First**
Works best on high volatility instruments
Works on All Assets ( Forex, Crypto, Commodities , Gold , Stocks)
Suggested Timeframes (15min, 30min, 1Hr, 4Hr, D)
*************************
Send us a message for Access!
THIS INDICATOR IS PRIVATE & AVAILABLE FOR MEMBERS ONLY!
**************************
How to Set Alerts :
**Example Buy Signal Alert
-> Go to GBP/NZD 4Hr Timeframe
-> Click Add new Alert
-> Condition -> Select : AlfredFxPro - Ich_Trends
-> Select : Buy Alert
-> Option : Once Per Bar Close
-> Notify on App + POP Up
-> Message: Write: ""Buy 4Hr""
-------------------------------------------
**Example Exit Buy Signal Alert
-> Go to GBP/NZD 4Hr Timeframe
-> Click Add new Alert
-> Condition -> Select : AlfredFxPro - Ich_Trends
-> Select : Long Exit Alert
-> Option : Once Per Bar Close
-> Notify on App + POP Up
-> Message: Write : ""Exit Buy 4Hr""
-------------------------------------------
You repeat the same process for "Sell, and Exit Sell" for any pair on any timeframe you want.
-------------------------------------------
**********Important***********
1) Enter on a Buy and Exit from the same time frame don't mix signals from time frames ( Treat each time frame as an individual trade).
2) Important to set the Alert option: ""Once Per Bar Close"", otherwise you'll get wrong signals.
*************************
Send us a message for Access!
THIS INDICATOR IS PRIVATE & AVAILABLE FOR MEMBERS ONLY!
**************************
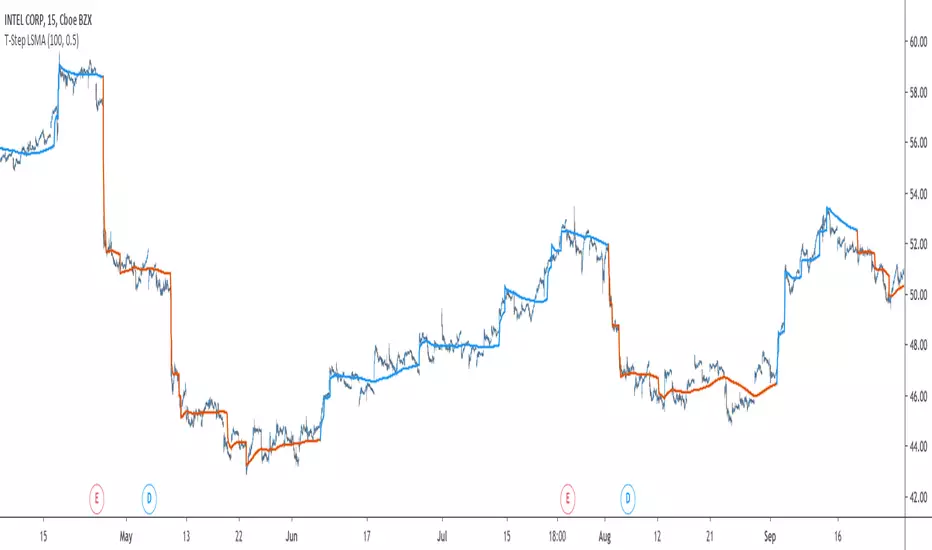
T-Step LSMAIntroduction
The trend step indicator family has produced much interest in the community, those indicators showed in certain cases robustness and reactivity. Their ease of use/interpretation is also a major advantage. Although those indicators have a relatively good fit with the input price, they can still be improved by introducing least-squares fitting on their calculations. This is why i propose a new indicator (T-Step LSMA) which aim to gather all the components of the trend-step indicator family (including the auto-line family).
The indicator will use as a threshold the mean absolute error between the input and the output (T-Channel) scaled with the efficiency ratio (Efficient Trend Step) while using least squares in order to provide a better fit with the price (Auto-Filter).
The Indicator
The interpretation of the indicator is easy, the indicator estimate an up-trending market when in blue, down-trending when in orange, the signal only depend on the trend-step part ( b in the code).
length control the period of the efficiency ratio as well as any components in the lsma calculation. The efficiency ratio allow to provide adaptivity, therefore the threshold will be lower when market is trending and higher when market is ranging.
Sc control the amount of feedback of the indicator, a value of 1 will use only the closing price as input, a value of 0.5 will use 50% of the closing price/indicator output as input, this allow to get smoother results.
It is possible to get the non-smooth version of the indicator by checking "No Smoothing".
This allow the indicator to filter more information.
Least Squares Smoothing - Benefits
One could ask why introducing least squares smoothing, there are several reasons to this choice, we have seen that trend-step indicators are boxy, they filter most of the variational information in the price, introducing least squares smoothing allow to gain back some of this variational information while providing a better fit with the price, the indicator is more noisy but also more practical in certain situations.
For example the indicator in its boxy form can't really be useful as input for other indicators, which is not the case with this version.
Relative strength index of period 14 using the proposed indicator as input.
Down-Sides
The indicator is dependent on the time frame used, larger time frames resulting in an indicator overfitting, sticking with lower time frames might be ideal. The indicator behavior might also change depending on the market in which it is applied.
Setting Up Alerts For The Indicator
Alerts conditions are already set, in order to create an alert based on the indicator follow these steps :
Go to the alert section (the alarm clock) -> create new alert -> select T-Step LSMA in condition -> Below select Up or Dn (Up for a up-trending alert and Dn for a down-trending alert)
In option select "once per bar close", change the message if you want a personalized message.
Conclusion
I don't think i'll post other indicators related to the trend-step framework for the time to comes, nonetheless the ones posted proven to have interesting results as well as many upsides. Although i don't think they would generate positive long-terms returns they could still be of use when using smarter volatility metrics as threshold. The proposed indicator conserve more information than its relatives and might find some use as input for other indicators.
Recommended Use Of The Code
Although i don't put restrictions on the code usage, i still recommend creative and pertinent changes to be made, graphical changes or any minor changes are not necessary, remember that such practice is disrespectful toward the author, you don't want to load up the tradingview servers for nothing right ?
Support Me
Making indicators sure is hard, it takes time and it can be quite lonely to, so i would love talking with you guys while making them :) There isn't better support than the one provided by your friends so drop me a message.
ANB AI Alert (my ANN)Hi guy
This is a high level trend predicting study. It is modified from the strategy by sirlof.
Feel free to use it as you like.
::USAGE only on 15 minutes
1. add the study in your chart
2. create an alert on the right
3. select ANB AI Alert (my ANN)(0,1D)
4. select the option you wish
5. select once per bar close alert
6. you can select email alert which i usually like
7. once the trade is alerted, execute your trade
TP: DYNAMIC (read more)
SL: null
Setting TP and SL: this is in consideration with the daily volatility and sessions
USDCAD TP 400 points, no stop loss.
To maximize profit, use trailing stops. most trades are 500 to 1800 points

lamBOTghini-ALERTador & SL/TP V3Es un algoritmo de combinación de EMAs.
Si utilizas “close” en las 3 EMA como fuente repintará más (aunque repintar es otra cosa pero para que se entienda) aunque gráficamente parezca la mejor opción.
Por el contrario, si utilizas “high” u “open” el repintado es inexistente pero se pierde rentabilidad.
Así que es ir probando, aunque para mi esta es la más equilibrada. Tú eliges...
Tiene una alerta doble Buy / Sell para los que no son pro y solo pueden poner una solamente.
Lleva como siempre Take profit y Stop Loss, aunque el Stop Loss mejor en el Exchange.

NGRN MACD-X & RSI v4MACD-X, RSI & Volume Indicator & Alerts Study - Version 4
Overview
This study and it's associated strategy were modeled after the famous Philakone described algorithms on his now defunct instructional video series.
This indicator allows for full customisation of parameters and interaction between three indicators that allow users to shape their trading methods to their desired goals.
This associated strategy also allows users to backtest the study alerts script and find the best settings towards that end.
MACD + RSI + VOLUME - are of the most powerful and widely usded indicators, MACD/Histogram crosses, coupled with RSI & Volume increases/decreases will detects areas of deeply oversold / overbought and buys/sells on the reversal
Features
Full customisation - All parameters are open for customising to allow the trader to build their own strategy and adapt from market to market.
Clean/Simple UI - Facilitating ease of use.
Enable Buying OR Selling, - or have them both active at the same time.
Toggle off and on ALTERNATING Buy and Sell feature (pyramiding) - to allow for consecutive DCA style buys or SCALING out of an entry (partial sell).
Customizable Stop-Loss plot - to enable users to create a STOP-LOSS alert option or other alert(s) based on the plot location. See settings screenshot.
Toggle Auto Stop-Loss sell option - to enable users choose whether or not to automatically issue a sell signal when close crosses stop loss plot, or choose to toggle off if not profitable.
Customizable Take-Profit plot - to enable users to create a TAKE-PROFIT alert option or other alert(s) based on the plot location.
Study and associated Strategy - to use the TradingView ‘Strategy Tester’ back-testing features to find the best alert settings for specific coins in bear, bull and sideways markets.
Changes Version 4
Improved STOP-LOSS plot draw (red line).
Added the option to automatically sell when stop-loss cross triggered or have the option disabled, in the event a better profit can be achieved.
Added new TAKE-PROFIT plot (aqua line) to visually guide users where to place the TAKE-PROFIT parameter as well as give users options to create alerts based on the TAKE-PROFIT plot.
Access
Full Access is 0.1 ETH , one time fee for LIFETIME access to the STUDY indicator, STRATEGY and future updates as well as support and SETTINGS for various markets on the Binance Exchange.
Settings
SCREENSHOT LINKS:
BUY SETTINGS: prntscr.com
SELL SETTINGS: prntscr.com

Commodity Channel Index Plus (CCI+)Same CCI you love, but with a candle highlighter, control over Overbought & Oversold Line placement, and Alert Conditions for Overbought & Oversold and Recoveries, built right in.
Set the Overbought/Oversold Lines anywhere you want... use them to create CCI+ Alerts.

Pharoceus PT-V2 CryptoScalper RSI+BB+SRSI+Stochastic IndicatorThis is the updated Version of the ProfitTrailerV2 RSI+BB+StochRSI+Stochastic Oscillator Signal+Alerts
Description
This is an all-in-one indicator with alerts that most people call signals and it's designed for Cryptocurrency leverage trading. This indicator features, the most popularly used indicators in technical analysis and are the basic technical analysis indicators any successful trader should master before going into more advance technical analysis tools. The Pharoceus ProfitTrailerV2 CryptoScalper RSI+BB+SRSI+Stochastic Oscillator Signal+Alerts features the Bollinger Bands, Relative Strength Index, Stochastic RSI and Stochastic Oscillator, and it was designed for use with Pharoceus ProfitTrailerV2 CryptoScalper and can also be used with all other trading bots or on its own as a powerful market leveraging and trading indicator using alerts.
The ProfitTrailerV2 RSI+BB+SRSI+Stochastic Oscillator Signal+Alerts can be customized to any trader specific trading patterns and offers the ability to choose a combination of indicators from the featured ones to use. With the Buy and Sell Signal feature, trading on any cryptocurrency exchange can be automated and with the alerts feature, the Pharoceus ProfitTrailerV2 CryptoScalper RSI+BB+SRSI+Stochastic Oscillator Signal+Alerts will automated buying and selling signals for any crypto trading bot but I'll always recommend using for making buys only when using with any bot. This indicator/script can be used with any base pair; BTC, ETH, and USD or USDT.
As mentioned above, all four indicators can be combined to find a very safe and secure buy and profitable sell signals, which maximizes your profit margins and overall earnings over time. Also, 2 or 3 could be combined as well, depending on the traders knowledge on how to use each indicator independently to find its best settings. My recommendation would be to test all independently and or together with very little capital to find what works best for you. I recommend this because the cryptocurrency market in a very volatile market and unpredictable, some combination of indicators would work for some certain coin pairs and not all, while others would work better with a different setting and a particular coin pair.
As with all script use at your own risk and only trade what you can afford to lose, while this indicator isn't designed to lose you money and I will not be held liable for any losses due to misuse. I am also not a financial advisor and the ProfitTrailerV2 RSI+BB+SRSI+Stochastic Oscillator Signal+Alerts will be made available soon as it's still undergoing rigorous testing and it's in no way and manner affiliated with any group of individuals or bot.
Trade Smart and with only what you can afford. Donations are also welcome to encourage my work, This is a totally free to use script to help traders, small time or big time that works towards making the indicator sharing world accessible to all who will not definitely be ripped-off and support a community of sharing.
discord.gg
BTC: 199qMzu4gvr3bUXWEpLG5uS6TEKKvw5pbe
ETH: 0xf8339952a224a228f2f8c58a5666a8ffleddebfb
BCH: qqmmds8u3f8m6ek387jtefg07525dvaxzqrshd86gz

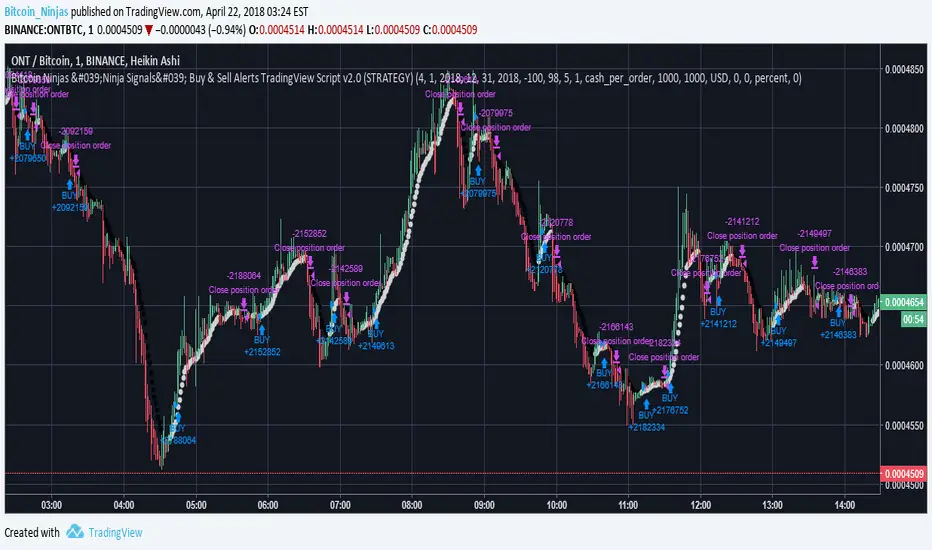
BitcoinNinjas Ninja Signals Buy/Sell Alert Trading Strategy v2.0Bitcoin Ninjas 'Ninja Signals' Buy/Sell Alerts & Backtesting TradingView Script v2.0
(for Cryptocurrencies, Forex, GunBot, ProfitTrailer, automatic trading software, and more)
'Ninja Signals' v2.0 (SCRIPT)
'Ninja Signals' v2.0 (STRATEGY)
'Ninja Signals' v1.0 (SCRIPT)
'Ninja Signals' v1.0 (STRATEGY)
-Allows users to easily set automated buy and sell alerts on TradingView for use with automatic and manual trading of cryptocurrencies, Forex securities, and more (alerts are compatible with automatic trading software such as GunBot, ProfitTrailer, and more).
-Synthesizes many powerful indicators [e.g. Relative Strength Index (RSI), stochastic RSI, Money Flow Index (MFI), Moving Average Convergence Divergence (MACD), etc.) into one super script to generate very precise buy and sell signals in almost any market condition.
-Buy arrows (blue) and sell arrows (red) can be changed or hidden for ease of viewing.
-No lag EMA trendline featuring trend-reversal color-coding (white uptrend, black downtrend).
-Adjustable ‘calibration’ setting allows users to customize the script to work for any currency or security available through TradingView, on any exchange, simply by adjusting a number.
-Complete with backtesting strategy version of script which allows users to test various buy and sell strategies based on the alerts the script generates (see info and screenshots below).
-Backtesting strategy incorporates a user-defined adjustable date range, so users can estimate the script’s performance over specific periods of time, such as the last day, week, or month.
-Backtesting strategy utilizes a minimum protective gain setting to help you never sell for a loss. Simply adjust your minimum profit (%) per trade, and the test results will update.
-Backtesting strategy allows for pyramid buying to test various average down / double up buying strategies. Simply adjust the number of pyramid buys and the quantity of each buy.
- Free 7-day trial available for TradingView users who join our free BitcoinNinjas community.
-Free 24/7 support via BitcoinNinjas Telegram GunBot support group with script purchase.
-Fully compatible with GunBot automatic trading software (TradingView plugin is required).
-Special discount available for traders who purchase GunBot automatic trading software and the GunBot TradingView plugin from BitcoinNinjas, allowing for fully automatic trading.
-Contact us via Email or Telegram for more information, to request additional / custom screenshots, or to start your free trial.
DISCLAIMER: By using this BitcoinNinjas document or ‘Ninja Signals’ planning script, you agree to the BitcoinNinjas 'Terms of Use', as presented on our website (www.BitcoinNinjas.org) and as stated here. No sharing, copying, reselling, modifying, or any other forms of use are authorized for our documents, script / strategy, and the information published with them. This informational document and planning script / strategy is strictly for individual use and educational purposes only. This is not financial or investment advice. Investments are always made at your own risk and are based on your personal judgement. BitcoinNinjas is not responsible for any losses you may incur. Please invest wisely.
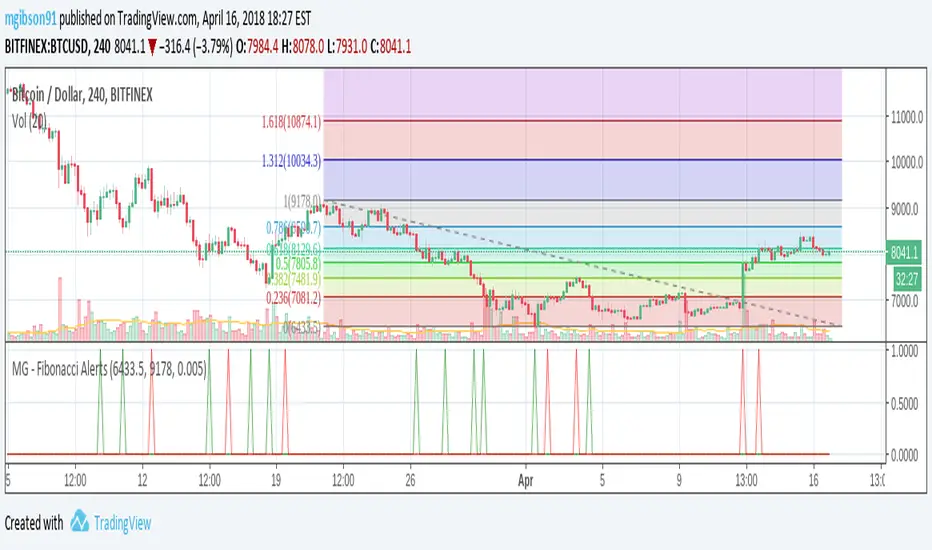
MG - Fibonacci Alerts - 1.0This script allows a user to get alerts when the price goes within a certain percentage threshold of a Fibonacci level.
If connected with AutoView, it could allow an easy way to do automated range trading between Fibonacci levels. Although I plan to do this myself, I haven't used it for this purpose yet so please be cautious and verify with live results beforehand before using it for any automation.
NOTE: The image shown of the indicator is not fully correct as the close price is used. In many cases in the example image, the candle close price DID come within the alert threshold but closed outside the threshold
Usage:
1. User performs a Fibonacci retracement / extension analysis to identify a sensible high and low point. (Currently, this script is geared towards dip pullbacks during a bull market with the ability to toggle rise pullbacks in a bear market in the pipeline)
2. User enters the high and low points into this indicator
3. User can then set alerts on the buy and sell signals which should provide alerts at excellent entry / exit points.
a. Alerts must be created on the buy and sell signal bars. E.g. Buy signal => Alert when 'Buy Signal' crosses up '0.9'
4. Set the alerts to once per bar (not per close). In this indicator, we want to catch things as soon as they happen.
NOTE: Should use in conjunction with another indicator for maximize results.
I personally use this indicator ()
TODO
- Add negative alert levels
- Allow user to specify direction of Fib retracement as the levels are different in bull and bear markets
All feedback is welcome
2 hours ago

Grahn Gyllene Kors [Alerts]Grahn Gyllene Kors is the companion study for the Grahn Gyllene Kors strategy...
This is an EMA / Trend Explorer & Strategy useful for identifying trends before EMA's cross and also identifying and experimenting with various EMA lengths and candle trends. There is also a companion Alerts study for this in which trend signals may be sent to the user via sms or email AND/OR buy and sell alerts may be sent to bots for automated trading of this strategy. Once you have optimized your settings and backtested with this strategy, apply your same settings into the Alerts study and create your alerts.
NOTICE: This script does not require access from me, simply open Indicators on chart and search for "Grahn". By accessing this script you acknowledge that you have read and understood that this is for research purposes only and I am not responsible for any financial losses you may incur by using this script!
EMA Fast and EMA Slow - may be adjusted in length and color.
Bullish F>S % - controls what percentage the EMA Fast should be above EMA Slow before considered bullish and is represented by the Green band on the chart.
Neutral % - is what percentage surrounding the EMA Slow should be considered neutral and is represented by the Yellow band on the chart.
Bearish F
