Medium Term Weighted Stochastic (STPMT) by DGTLa Stochastique Pondérée Moyen Terme (STPMT) , or Mᴇᴅɪᴜᴍ Tᴇʀᴍ Wᴇɪɢʜᴛᴇᴅ Sᴛᴏᴄʜᴀꜱᴛɪᴄꜱ created by Eric Lefort in 1999, a French trader and author of trading books
█ The STPMT indicator is a tool which concerns itself with both the direction and the timing of the market. The STPMT indicator helps the trader with:
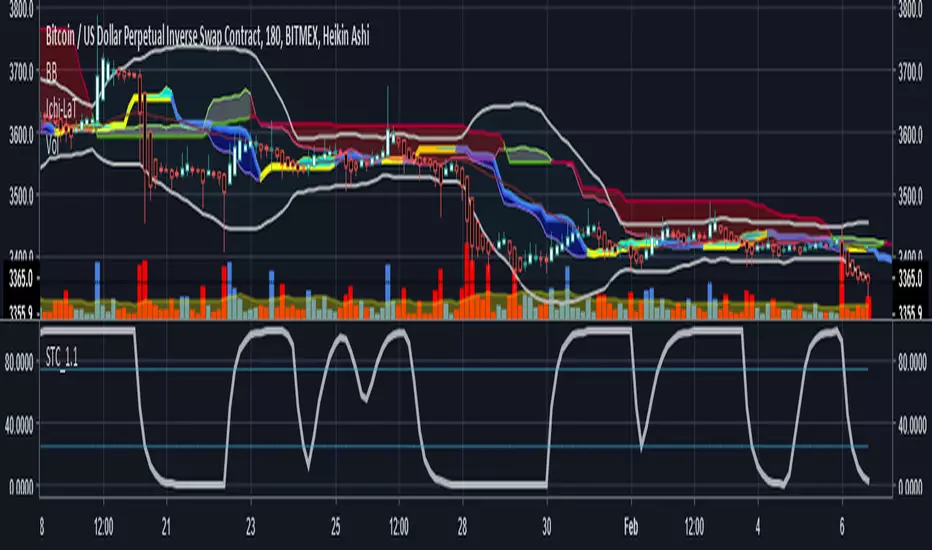
The general trend by observing the level around which the indicator oscillates
The changes of direction in the market
The timing to open or close a position by observing the oscillations and by observing the relative position of the STPMT versus its moving average
STPMT Calculation
stpmt = (4,1 * stoch(5, 3) + 2,5 * stoch(14, 3) + stoch(45, 14) + 4 * stoch(75, 20)) / 11.6
Where the first argument of the stoch function representation above is period (length) of K and second argument smoothing period of K. The result series is then plotted as red line and its moving average as blue line. By default disabled gray lines are the components of the STPMT
The oscillations of the STPMT around its moving average define the timing to open a position as crossing of STMP line and moving average line in case when both trends have same direction. The moving average determines the direction.
Long examples
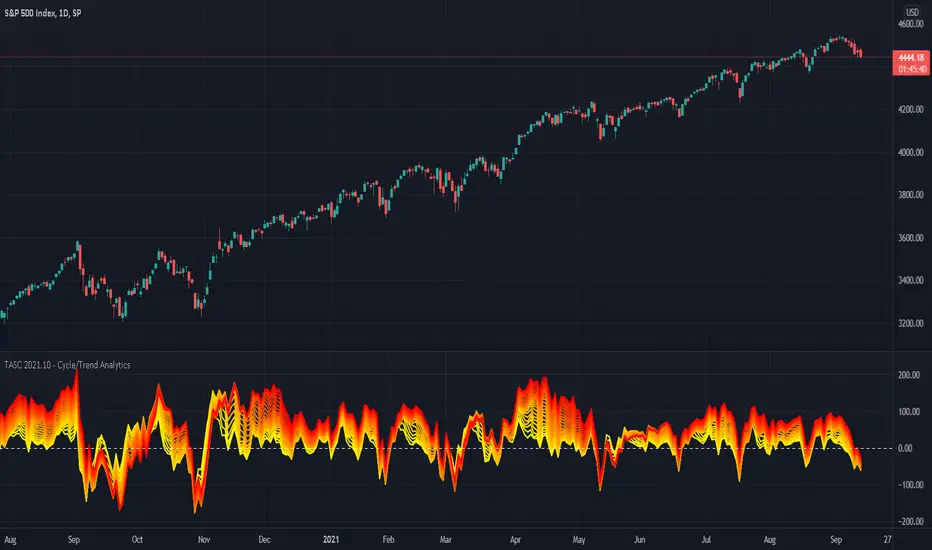
█ Tʜᴇ CYCLE Iɴᴅɪᴄᴀᴛᴏʀ is derived from the STPMT. It is
cycle = stpmt – stpmt moving average
It is indicates more clearly all buy and sell opportunities. On the other hand it does not give any information on market direction. The Cycle indicator is a great help in timing as it allows the trader to more easily see the median length of an oscillation around the average point. In this way the traders can simply use the time axis to identify both a favorable price and a favorable moment. The Cycle Indicator is presented as histogram
The Lefort indicators are not a trading strategy. They are tools for different purposes which can be combined and which can serve for trading all instruments (stocks, market indices, forex, commodities…) in a variety of time frames. Hence they can be used for both day trading and swing trading.
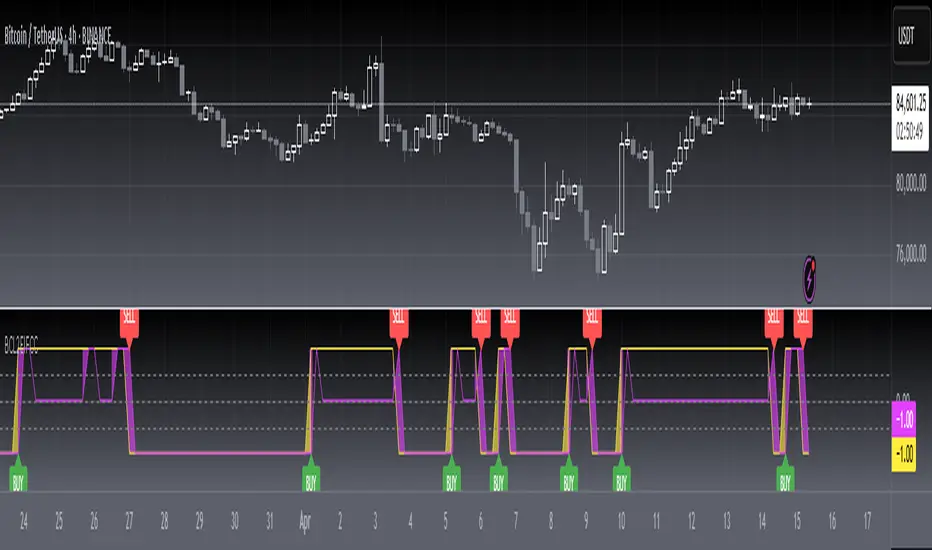
👉 For whom that would like simple version of the Cycle indicator on top of the main price chart with signals as presented below.
Please note that in the following code STMP moving average direction is not considered and will plot signals regardless of the direction of STMP moving average. It is not a non-repainting version too.
here is pine code for the overlay version
// © dgtrd
//@version=4
study("Medium Term Weighted Stochastic (STPMT) by DGT", "STPMT ʙʏ DGT ☼☾", true, format.price, 2, resolution="")
i_maLen = input(9 , "Stoch MA Length", minval=1)
i_periodK1 = input(5 , "K1" , minval=1)
i_smoothK1 = input(3 , "Smooth K1", minval=1)
i_weightK1 = input(4.1 , "Weight K1", minval=1, step=.1)
i_periodK2 = input(14 , "K2" , minval=1)
i_smoothK2 = input(3 , "Smooth K2", minval=1)
i_weightK2 = input(2.5 , "Weight K2", minval=1, step=.1)
i_periodK3 = input(45 , "K3" , minval=1)
i_smoothK3 = input(14 , "Smooth K3", minval=1)
i_weightK3 = input(1. , "Weight K3", minval=1, step=.1)
i_periodK4 = input(75 , "K4" , minval=1)
i_smoothK4 = input(20 , "Smooth K4", minval=1)
i_weightK4 = input(4. , "Weight K4", minval=1, step=.1)
i_data = input(false, "Components of the STPMT")
//------------------------------------------------------------------------------
// stochastic function
f_stoch(_periodK, _smoothK) => sma(stoch(close, high, low, _periodK), _smoothK)
//------------------------------------------------------------------------------
// calculations
// La Stochastique Pondérée Moyen Terme (STPMT) or Medium Term Weighted Stochastics calculation
stpmt = (i_weightK1 * f_stoch(i_periodK1, i_smoothK1) + i_weightK2 * f_stoch(i_periodK2, i_smoothK2) + i_weightK3 * f_stoch(i_periodK3, i_smoothK3) + i_weightK4 * f_stoch(i_periodK4, i_smoothK4)) / (i_weightK1 + i_weightK2 + i_weightK3 + i_weightK4)
stpmt_ma = sma(stpmt, i_maLen) // STPMT Moving Average
cycle = stpmt - stpmt_ma // Cycle Indicator
//------------------------------------------------------------------------------
// plotting
plotarrow(change(sign(cycle)), "STPMT Signals", color.green, color.red, 0, maxheight=41)
alertcondition(cross(cycle, 0), title="Trading Opportunity", message="STPMT Cycle : Probable Trade Opportunity\n{{exchange}}:{{ticker}}->\nPrice = {{close}},\nTime = {{time}}")
อินดิเคเตอร์ Pine Script®