World Class SMC [WinWorld]This indicator uses valid pullbacks in order to draw market structure with strict accordance to TradingHub strategy.
Features
Our indicator uses a number of price concepts, such as:
IDM
BoS & ChoCh ( also their sweeps )
Automatic resolving of ChoCh-IDM and IDM-BoS conflicts
Orderblocks (IDM, Extreme)
True Fair Value Gaps (FVG)
True PDH/PDL
SCOB pattern
One of the core features is the ability to choose a time point, from which the market structure will be drawn. This feature alone allows you to test your most desired hypotheses about the market movements within a few clicks, so no more guesses and "what if"s, because you get the opportunity to test everything yourself and right now.
Settings
Let's review the settings themselves:
Extended Structure: allows you to choose between drawing market structure for a whole timeline or from specific time point only;
Build OB by sweeps: allows you to only draw orderblocks from candle, which took liquidity from previous candle by sweep;
Structure colours & text: allows you to customise visuals representations of market structure elements on your chart;
Structure visuals: allows you to choose which elements of market structure you want / don't want to see on your chart;
Show trend: allows you to choose the way market structure trend will be displayed on your chart: divider or background colouring ;
Alerts for each and every event , whether it is a new BoS, ChoCh, orderblock and etc.
Usage Examples
IDM Orderblock ( OB-IDM )
Basic demonstration
When price reaches OB-IDM, you will be able to receive an alert. After that, check if the candle, that reached OB-IDM, closed inside or above ( bearish scenario )/ below ( bullish scenario ) OB-IDM's boundaries. If conditions above were met, go on LTF and look for an entry.
Extreme Orderblock ( OB-EXT )
Basic demonstration
Similar to OB-IDM situation: When price reaches OB-EXT, you will be able to receive an alert. After that, check if the candle, that reached OB-EXT, closed inside or above ( bearish scenario )/ below ( bullish scenario ) OB-EXT's boundaries. If conditions above were met, go on LTF and look for an entry.
Sweep PDH/PDL
Basic demonstration
* PDH — Previous Day High
* PDL — Previous Day Low
When you received PDH sweep alert and current trend is bearish, go on LTF to find entry point. ( bullish scenario: PDL sweep and current trend is bullish )
Sweep ChoCh
Basic demonstration
If you get alert of sweeped ChoCh, it usually means that price grabbed the liquidity from extremum points and is ready to continue going with the trend. Go on LTF to find an entry.
ค้นหาในสคริปต์สำหรับ "BOS"

Market Dynamics Pro [ChartPrime]ChartPrime Market Dynamics Pro is designed to cater to those traders who are more interested in market structures, price action and fundermentals. Analysing volume, key levels in the market, market phases and multi-timeframe can help a trader build a clearer and more actionable view of the market. ChartPrime performs analysis on data in a unique way therefore attempting to give insights into the market otherwise unseen.
Major Features:
Order blocks: The ChartPrime order blocks provide sleek and clear levels in the market where the price might find support and resistance. It is important to note this data isn't availible currently therefore these are derived from data outside of order books. Order blocks are segmented into 4 sections reflecting the volume at a given levels. Low, Medium, High and very high based on relevant and dynamic averages. This allows a trader to identify how significant a level is in the market in a simpler method. Bearish order blocks have a red color bias and bullish order blocks have a green color bias allowing a trader to identify what type of order block it is. The order blocks also dynamically show the remaining volume at that given level.
Pattern Detection: ChartPrime leverages unique pattern identification methods providing earlier and cleaner chart formations. Patterns are commonly used in trading to assess whether bulls or bears are performing optimally in a market or losing strength. ChartPrime identifies; Ascending wedges, descending wedges, symmetrical Triangles, H&S, iH&S, broadening wedges and double tops/bottoms. Patterns often have associated theory behind them for entries and targets that we suggest a trader covers before using this feature. ChartPrime also allow for the user to adjust where a pattern is drawn from. In pattern theory there are 2 main approaches to drawing a formation; from candle body and candle wick. ChartPrime allows for this to be adjusted by a user and also allow for alerts to be set on these patterns.
MTF SR: Taking into account multi timeframes when trading is a key idea. Having ideas of the larger market moves can provide deeper context when trading. ChartPrime Market Dynamics Pro allows for 3 varying SR plots from 3 varying user desired timeframes. These are graded via pivot analysis and grid analysis. This rank is on a 1-10 scale with 1 being the highest rank and 10 is the lowest.
Market Stucutures : These labels are commonly found and used by the Smart Money community. They denote a break of stucture and a chance of character. BOS are labelled when the price breaks a lower low or higher high (in the trending markets) and a CoC occurs when price breaks a trending market pivot. These break a market into clearer breakouts of price action and can help a trader deduce relevant moves. The indicator allows for the user to adjust the detection length of these structures.
Premium and Discount Zones: Premium and Discount zones are underpinned by a simple piece of logic. A premium zone is taken from a higher swing point and the discount from a lower swing point. Although a very generic approach this can show areas in the market that could see a reaction. An asset being in a discount zone implies the price is undervalued. An asset being in a premium zone implies the asset is overpriced or overextended. These are excellent when used in confluence with other SR methods. These naturally will have a delay as they are derived from swing points in a market but still are extremely relevant levels.
Fair Value Gaps: These are gaps in the market where price has seen a highly volatile move and they are assumed to act as magnets in the market. The price may come back and visit these 'gaps' after the move has occured. These are a common technique now used by traders and added to this toolkit for convinience.
Settings:
Order Blocks: Select the scale of the order blocks displayed
BoS/CoC: Toggle these on/off and adjust the lookback on these market structures
Premium/Discount Zones: Toggle on/off and adjust lookback
Enable FVG: Toggle on/off FVGs
Swing Levels: Enable basic swing levels in market
MTF Support/Resistance: Enable and select the relevant timeframe to obtain MTF SR levels on your chart. Up to 3 timeframes at a time.
Predictive Ranges: Toggle on/off
Trend Lines Detection: Toggle on/off trendlines
Wedge Detection: Adjust how patterns are detected; whether from wick or candle body
Toggles provided for relevant patterns.
Example usecases:
ChartPrime order blocks give a deeper insight into market support and resistance levels. Looking for order blocks labelled with High can indicate this level being a significant support or resistance in the market. Adding in further confluences here can assist further in deciding where the price may see a reaction. Take the screenshot below:
Adding in confluences from other timeframes can also help give a broader view. Using the multi time frame graded frame support and resistance levels we can use these to further assist us in finding significant levels in the market.
ChartPrime also provides breaker blocks. These are still significant levels in the market despite being "broken" prior. These too can be used in a classical manor and act as relevant areas in the market. These are particularly effective when used in confluence with Premium and discount zones. We can see in the example below price sees a strong reaction and bounces at these levels.
Market Dynamics Pro provides a comprehensive toolkit of unique features and mixes in the classical concepts allowing for a cleaner charting experience.
All content and indicators provided by ChartPrime are purely for informational & educational purposes only. Past performance does not guarantee future results.
สคริปต์แบบชำระเงิน

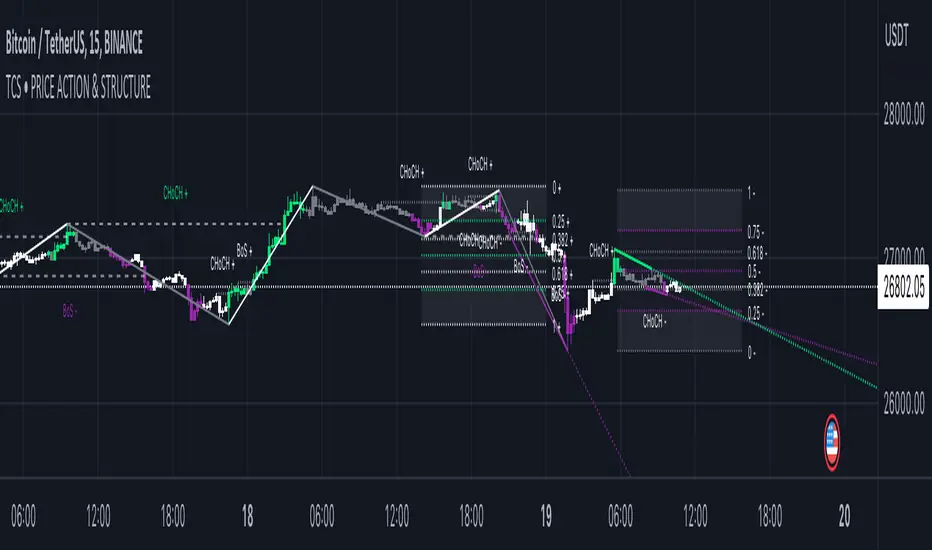
Price Action and market structure [Tcs] | PAThis indicator shows in real time the clearest and most complete vision of the price market structure, without considering volumes.
It has been developed mainly to identify price retracements in order to find the best entries in the market, but it include also other features which can be helpful for traders.
The indicator detects and highlight on the chart the market movement in multiple ways, including swing high, swing lows, the break of structure (BoS), change of character (CoCh), possible retracement movement, trend-lines generated through pivots, fibonacci and quarters theory levels based on previous pivot and daily, weekly and monthly highs and lows.
It can be set up on two different pivots look-back, one faster and one slower, to simplify the development of strategies for traders.
A longer look-back can detect a "slower" and less noisy structure, which can be more useful to detect massive retracements, while a shorter look-back can be useful to detect faster market moves, perfect for scalpers and to develop small price movement strategies.
Indicator features:
- Trend detection highlighted with colors - candles are colored in four different colors, and it's possible to choose if detect the fast and slow trend:
• Bullish move after structure break – green
• Bullish retracements – gray
• Bearish move after structure break – purple
• Bearish retracements – white
In this way traders can have a realtime vision of when the market is retracing in order to find better entries than entry immediately on a break of structure. It can be integrated with order blocks, ema or others indicators which can be helpful as support or resistance.
- Pivots and structure labels - in order to identify immediately if the trend is bullish, bearish or is changing direction:
• BoS + and BoS - are the bullish and bearish break of structure, respectively, and are colored to indicate a slower look-back, in gray to indicate a faster pivot look-back
• CoCh + and CoCh - are the bullish and bearish change of characters, respectively, and are colored to indicate a slower look-back.
• HH, HL, LL, and LH indicate the pivots of the trend. Al the pivots appear just when the pivots, based on fast or slow pivot look-back are confirmed
- Zigzag - The zigzag line helps to remove market noise and read the market structure in a simpler way.
• It's possible to select the zigzag line based on the slow or fast trend.
• Fast pivot look-back
•Slow pivot look-back
- Quarters theory and Fibonacci retracement:
• It creates a retracement that can be based on the fast or slow trend and small or big market move.
• The retracement is both bullish and bearish and includes the major Fibonacci levels and the most valuable areas from the quarters theory of market retracement.
• This helps to detect good entry points.
- Support and resistance, Daily, weekly, and monthly high, lows - just to heave a more clear view of important levels:
• It plots the highest and lowest pivot points based on the selected look-back.
• It plots the highs and lows of the day, week, and month.
- Trendlines:
• It plots the trend-lines based on past pivots.
• Here as well, it is possible to choose between fast and slow trend pivot look-back.
It's important to highlight that the indicator remarks on all facets of pure price action, not the smart money concept or liquidity areas.
Please note that this indicator is for educational purposes only and should not be used for trading without further testing and analysis.
ICT Donchian Smart Money Structure (Expo)█ Concept Overview
The Inner Circle Trader (ICT) methodology is focused on understanding the actions and implications of the so-called "smart money" - large institutions and professional traders who often influence market movements. Key to this is the concept of market structure and how it can provide insights into potential price moves.
Over time, however, there has been a notable shift in how some traders interpret and apply this methodology. Initially, it was designed with a focus on the fractal nature of markets. Fractals are recurring patterns in price action that are self-similar across different time scales, providing a nuanced and dynamic understanding of market structure.
However, as the ICT methodology has grown in popularity, there has been a drift away from this fractal-based perspective. Instead, many traders have started to focus more on pivot points as their primary tool for understanding market structure.
Pivot points provide static levels of potential support and resistance. While they can be useful in some contexts, relying heavily on them could provide a skewed perspective of market structure. They offer a static, backward-looking view that may not accurately reflect real-time changes in market sentiment or the dynamic nature of markets.
This shift from a fractal-based perspective to a pivot point perspective has significant implications. It can lead traders to misinterpret market structure and potentially make incorrect trading decisions.
To highlight this issue, you've developed a Donchian Structure indicator that mirrors the use of pivot points. The Donchian Channels are formed by the highest high and the lowest low over a certain period, providing another representation of potential market extremes. The fact that the Donchian Structure indicator produces the same results as pivot points underscores the inherent limitations of relying too heavily on these tools.
While the Donchian Structure indicator or pivot points can be useful tools, they should not replace the original, fractal-based perspective of the ICT methodology. These tools can provide a broad overview of market structure but may not capture the intricate dynamics and real-time changes that a fractal-based approach can offer.
It's essential for traders to understand these differences and to apply these tools correctly within the broader context of the ICT methodology and the Smart Money Concept Structure. A well-rounded approach that incorporates fractals, along with other tools and forms of analysis, is likely to provide a more accurate and comprehensive understanding of market structure.
█ Smart Money Concept - Misunderstandings
The Smart Money Concept is a popular concept among traders, and it's based on the idea that the "smart money" - typically large institutional investors, market makers, and professional traders - have superior knowledge or information, and their actions can provide valuable insight for other traders.
One of the biggest misunderstandings with this concept is the belief that tracking smart money activity can guarantee profitable trading.
█ Here are a few common misconceptions:
Following Smart Money Equals Guaranteed Success: Many traders believe that if they can follow the smart money, they will be successful. However, tracking the activity of large institutional investors and other professionals isn't easy, as they use complex strategies, have access to information not available to the public, and often intentionally hide their moves to prevent others from detecting their strategies.
Instantaneous Reaction and Results: Another misconception is that market movements will reflect smart money actions immediately. However, large institutions often slowly accumulate or distribute positions over time to avoid moving the market drastically. As a result, their actions might not produce an immediate noticeable effect on the market.
Smart Money Always Wins: It's not accurate to assume that smart money always makes the right decisions. Even the most experienced institutional investors and professional traders make mistakes, misjudge market conditions, or are affected by unpredictable events.
Smart Money Activity is Transparent: Understanding what constitutes smart money activity can be quite challenging. There are many indicators and metrics that traders use to try and track smart money, such as the COT (Commitments of Traders) reports, Level II market data, block trades, etc. However, these can be difficult to interpret correctly and are often misleading.
Assuming Uniformity Among Smart Money: 'Smart Money' is not a monolithic entity. Different institutional investors and professional traders have different strategies, risk tolerances, and investment horizons. What might be a good trade for a long-term institutional investor might not be a good trade for a short-term professional trader, and vice versa.
█ Market Structure
The Smart Money Concept Structure deals with the interpretation of price action that forms the market structure, focusing on understanding key shifts or changes in the market that may indicate where 'smart money' (large institutional investors and professional traders) might be moving in the market.
█ Three common concepts in this regard are Change of Character (CHoCH), and Shift in Market Structure (SMS), Break of Structure (BMS/BoS).
Change of Character (CHoCH): This refers to a noticeable change in the behavior of price movement, which could suggest that a shift in the market might be about to occur. This might be signaled by a sudden increase in volatility, a break of a trendline, or a change in volume, among other things.
Shift in Market Structure (SMS): This is when the overall structure of the market changes, suggesting a potential new trend. It usually involves a sequence of lower highs and lower lows for a downtrend, or higher highs and higher lows for an uptrend.
Break of Structure (BMS/BoS): This is when a previously defined trend or pattern in the price structure is broken, which may suggest a trend continuation.
A key component of this approach is the use of fractals, which are repeating patterns in price action that can give insights into potential market reversals. They appear at all scales of a price chart, reflecting the self-similar nature of markets.
█ Market Structure - Misunderstandings
One of the biggest misunderstandings about the ICT approach is the over-reliance or incorrect application of pivot points. Pivot points are a popular tool among traders due to their simplicity and easy-to-understand nature. However, when it comes to the Smart Money Concept and trying to follow the steps of professional traders or large institutions, relying heavily on pivot points can create misconceptions and lead to confusion. Here's why:
Delayed and Static Information: Pivot points are inherently backward-looking because they're calculated based on the previous period's data. As such, they may not reflect real-time market dynamics or sudden changes in market sentiment. Furthermore, they present a static view of market structure, delineating pre-defined levels of support and resistance. This static nature can be misleading because markets are fundamentally dynamic and constantly changing due to countless variables.
Inadequate Representation of Market Complexity: Markets are influenced by a myriad of factors, including economic indicators, geopolitical events, institutional actions, and market sentiment, among others. Relying on pivot points alone for reading market structure oversimplifies this complexity and can lead to a myopic understanding of market dynamics.
False Signals and Misinterpretations: Pivot points can often give false signals, especially in volatile markets. Prices might react to these levels temporarily but then continue in the original direction, leading to potential misinterpretation of market structure and sentiment. Also, a trader might wrongly perceive a break of a pivot point as a significant market event, when in fact, it could be due to random price fluctuations or temporary volatility.
Over-simplification: Viewing market structure only through the lens of pivot points simplifies the market to static levels of support and resistance, which can lead to misinterpretation of market dynamics. For instance, a trader might view a break of a pivot point as a definite sign of a trend, when it could just be a temporary price spike.
Ignoring the Fractal Nature of Markets: In the context of the Smart Money Concept Structure, understanding the fractal nature of markets is crucial. Fractals are self-similar patterns that repeat at all scales and provide a more dynamic and nuanced understanding of market structure. They can help traders identify shifts in market sentiment or direction in real-time, providing more relevant and timely information compared to pivot points.
The key takeaway here is not that pivot points should be entirely avoided or that they're useless. They can provide valuable insights and serve as a useful tool in a trader's toolbox when used correctly. However, they should not be the sole or primary method for understanding the market structure, especially in the context of the Smart Money Concept Structure.
█ Fractals
Instead, traders should aim for a comprehensive understanding of markets that incorporates a range of tools and concepts, including but not limited to fractals, order flow, volume analysis, fundamental analysis, and, yes, even pivot points. Fractals offer a more dynamic and nuanced view of the market. They reflect the recursive nature of markets and can provide valuable insights into potential market reversals. Because they appear at all scales of a price chart, they can provide a more holistic and real-time understanding of market structure.
In contrast, the Smart Money Concept Structure, focusing on fractals and comprehensive market analysis, aims to capture a more holistic and real-time view of the market. Fractals, being self-similar patterns that repeat at different scales, offer a dynamic understanding of market structure. As a result, they can help to identify shifts in market sentiment or direction as they happen, providing a more detailed and timely perspective.
Furthermore, a comprehensive market analysis would consider a broader set of factors, including order flow, volume analysis, and fundamental analysis, which could provide additional insights into 'smart money' actions.
█ Donchian Structure
Donchian Channels are a type of indicator used in technical analysis to identify potential price breakouts and trends, and they may also serve as a tool for understanding market structure. The channels are formed by taking the highest high and the lowest low over a certain number of periods, creating an envelope of price action.
Donchian Channels (or pivot points) can be useful tools for providing a general view of market structure, and they may not capture the intricate dynamics associated with the Smart Money Concept Structure. A more nuanced approach, centered on real-time fractals and a comprehensive analysis of various market factors, offers a more accurate understanding of 'smart money' actions and market structure.
█ Here is why Donchian Structure may be misleading:
Lack of Nuance: Donchian Channels, like pivot points, provide a simplified view of market structure. They don't take into account the nuanced behaviors of price action or the complex dynamics between buyers and sellers that can be critical in the Smart Money Concept Structure.
Limited Insights into 'Smart Money' Actions: While Donchian Channels can highlight potential breakout points and trends, they don't necessarily provide insights into the actions of 'smart money'. These large institutional traders often use sophisticated strategies that can't be easily inferred from price action alone.
█ Indicator Overview
We have built this Donchian Structure indicator to show that it returns the same results as using pivot points. The Donchian Structure indicator can be a useful tool for market analysis. However, it should not be seen as a direct replacement or equivalent to the original Smart Money concept, nor should any indicator based on pivot points. The indicator highlights the importance of understanding what kind of trading tools we use and how they can affect our decisions.
The Donchian Structure Indicator displays CHoCH, SMS, BoS/BMS, as well as premium and discount areas. This indicator plots everything in real-time and allows for easy backtesting on any market and timeframe. A unique candle coloring has been added to make it more engaging and visually appealing when identifying new trading setups and strategies. This candle coloring is "leading," meaning it can signal a structural change before it actually happens, giving traders ample time to plan their next trade accordingly.
█ How to use
The indicator is great for traders who want to simplify their view on the market structure and easily backtest Smart Money Concept Strategies. The added candle coloring function serves as a heads-up for structure change or can be used as trend confirmation. This new candle coloring feature can generate many new Smart Money Concepts strategies.
█ Features
Market Structure
The market structure is based on the Donchian channel, to which we have added what we call 'Structure Response'. This addition makes the indicator more useful, especially in trending markets. The core concept involves traders buying at a discount and selling or shorting at a premium, depending on the order flow. Structure response enables traders to determine the order flow more clearly. Consequently, more trading opportunities will appear in trending markets.
Structure Candles
Structure Candles highlight the current order flow and are significantly more responsive to structural changes. They can provide traders with a heads-up before a break in structure occurs
-----------------
Disclaimer
The information contained in my Scripts/Indicators/Ideas/Algos/Systems does not constitute financial advice or a solicitation to buy or sell any securities of any type. I will not accept liability for any loss or damage, including without limitation any loss of profit, which may arise directly or indirectly from the use of or reliance on such information.
All investments involve risk, and the past performance of a security, industry, sector, market, financial product, trading strategy, backtest, or individual's trading does not guarantee future results or returns. Investors are fully responsible for any investment decisions they make. Such decisions should be based solely on an evaluation of their financial circumstances, investment objectives, risk tolerance, and liquidity needs.
My Scripts/Indicators/Ideas/Algos/Systems are only for educational purposes!

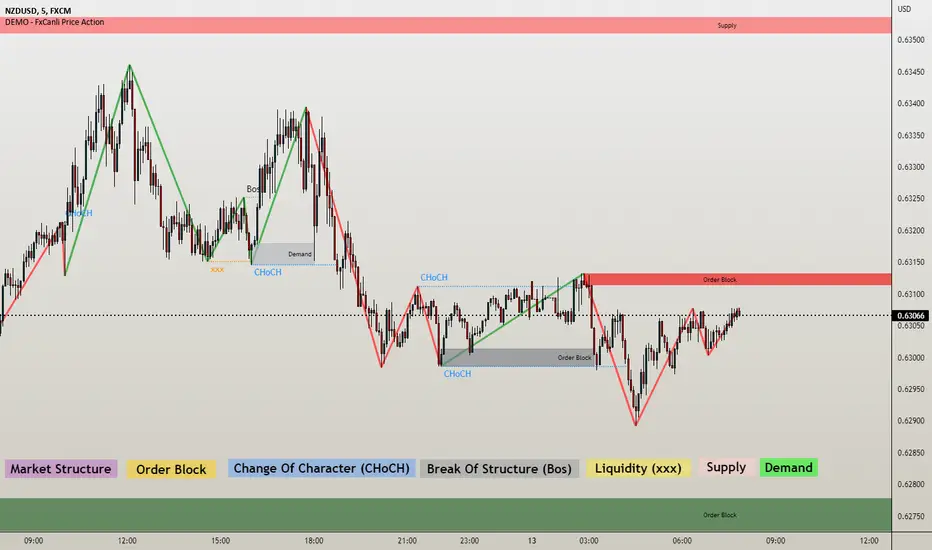
DEMO - FxCanli Price ActionEN - FxCanli TradingView Price Action indicator can draw and alert at everything about PRICE ACTION.
DEMO VERSION of FXCANLI PRICE ACTION Indicator work with any NZD or any DOGE symbols
TR - FxCanli TradingView Price Action indikatörü grafiklerinizde PRICE ACTION ile ilgili tüm çizimleri yapar ve alarm verir.
FXCANLI PRICE ACTION indikatörünün DEMO VERSİYONUNU herhangi bir NZD veya DOGE sembolü ile kullanabilirsiniz.
EN - For Example | TR - Örnek
NZD|...
NZD|USD
NZD|CAD
NZD|CHF
NZD|JPY
DOGE|...
DOGE|USD
DOGE|USDT
DOGE|USDTPERP
DOGE|BTC
EN - FxCanli TradingView Price Action indicator can draw and alert at;
Break of Structure (BOS),
Change of Character (CHoCH),
Liquidity,
Order Block,
Supply & Deman
TR - FxCanli TradingView Price Action indikatörü grafiklerinizde;
Break of Structure (BOS)
Change of Characte (CHoCH)
Liquidity
Order Block
Arz & Talep bölgelerini otomatik olarak çizer ve alarm verir.
Market Structure;
EN - You can easly follow market structure, Up Trend with green waves, Down trend with Red waves
TR - Market yapısını kolayca takip edebilirsiniz. Yukarı trendi yeşil dalgalar ile, Aşağı trendi kırmızı dalgalar ile.
Change of Character (CHoCH)
*************************************
EN - Shows trend reversals
TR - Trend dönüşümlerini gösterir
Break of Structure (BOS)
******************************
EN - Shows trend continuations
TR - Devam eden trendleri gösterir
Liquidity
***********
EN - Shows Liquidity levels
TR - Likidite seviyelerini gösterir
Order Block and Supply&Demend
***************
EN - Shows Order Block and Supply&Demend levels which is a technical analysis technique that tracks the accumulation of orders (when bullish ) and distribution of orders (when bearish ) of banks and institutional traders.
TR - Bankaların ve kurumsalların emir birikimini (yükseliş olduğunda) ve emir dağılımını (düşüş olduğunda) Order Block ve Arz & Talep olarak gösterir.
Miyagi BacktesterMiyagi: The attempt at mastering something for the best results.
Miyagi indicators combine multiple trigger conditions and place them in one toolbox for traders to easily use, produce alerts, backtest, reduce risk and increase profitability.
The Miyagi Backtester is a standalone backtester which is to be applied to the chart after the Miyagi indicator to be backtested.
The backtester can only backtest one script at a time, and is meant to backtest ONCE PER BAR CLOSE entries.
It is currently not possible to backtest ONCE PER BAR entries.
The backtester will allow users to all Miyagi Indicators using DCA strategies to show returns over a selectable time period.
The backtester allows leverage, and as such users should be aware of the Maximum Amount for Bot Usage and Leverage Required Calculations.
The DCA Selector switch will allow users to backtest with, or without DCA.
Static DCA is used within the backtester and allows users to see DCA Statistics on closed trades.
How to use the Miyagi Backtester
Step 1: Apply the Miyagi Indicator of Choice to backtest (4in1/10in1/Strend).
DATE AND TIME RANGE:
-Date and time range to backtest.
TRADE:
-Entry source to backtest. Please select the "Outbound Entry Signal Sender"
-Trade Direction to backtest. This can be helpful to backtest according to your strategy (long or short).
-Take Profit % to backtest. This is the percent take profit to backtest. Slippage can be accounted for on the "Properties" tab.
-Stoploss % to backtest. This is the percent stoploss to backtest.
DCA:
DCA Checkbox: Enable the DCA Checkbox to backtest with DCA. Disable it to backtest without DCA.
Leverage: Input the Leverage you will trade with.
Base Order Size (% Equity): This is the Base order (BO) size to backtest in % of equity.
Safety Order Size (% Equity): This is the Safety order (SO) size to backtest in % of equity.
Number of DCA Orders: This is the maximum amount of DCA orders to place, or total DCA orders.
Price Deviation (% from initial order): This is the percent at which the first safety is placed.
Safety Order Step Scale: This is the scale at which is applied to the deviation for the step calculation to determine next SO placement.
Safety Order Volume Scale: This is the scale at which is applied to the safety orders for the volume calculation to determine SO Volume.
Real world DCA Example:
The process is as follows.
Base Order: This is your initial order size, $100 used for Base Order
Safety Order: This is your first safety order size, which is placed at the deviation. $100 Safety Order, it is good to keep the same size as your BO for your scaling to be effective.
Price deviation: This is the deviation at which your first Safety order is placed. 0.3-0.75% used by most of our members.
Safety Order Volume Scale: This is the scale at which is applied to the safety orders for the volume calculation. Scale of 2 used, which means that SO2 = (SO1) * 2, or $200. This scaling is typical for all following orders and as such SO3 = (SO2) *2, or $400.
Safety Order Step Scale: This is the scale at which is applied to the deviation for the step calculation. This is similar to the volume scale however the last order percentage is added.
Scale of 2 used, which means that SO2 % = ((Deviation) * 2) + (SO1%). (0.5% *2) + (0.5) = 1.5%.
This scaling is typical for all following orders except that the prior deviation is used and as such SO3 = ((Prior%) * 2) + (Deviation). (1.5% * 2) +(0.5%) or 3.5%.
Total SO Number: The calculations will continue going until the last SO. It is helpful to understand the amount of SO’s and scaling determines how efficient your DCA is.
Backtester Outputs include:
Net Profit to display net profit
Daily Net Profit to estimate
Percent Profitable which shows ratio of winning trades to losing trades.
Total Trades
Winning Trades
Losing Trades (only applicable if stoploss is used)
Buy & Hold Return (of the backtested asset) to compare if the strategy used beats buy & hold return.
Avg Trade Time is very helpful to see average trade time.
Max Trade Time is very helpful to see the maximum trade time.
Total Backtested Time will return total backtested time.
Initial Capital which is taken from the Properties tab.
Max amount for Bot Usage which can be helpful to see bot usage.
Leverage Required will show you the leverage required to sustain the DCA configuration.
Total SO Deviation will allow users to see the drop coverage their DCA provides.
Max Spent which is a % of total account spent on one trade.
Max Drawdown which displays the maximum drawdown of any trade.
Max % distance from entry shows the maximum distance price went away from entry prior to the trade closing.
Max SO Used which shows the maximum number of SO's used on a single trade
Avg SO Used which shows the average number of SO's used in all closed trades.
Deals closing with BO Only calculation will show how many trades are closed without DCA.
Deals closing with 1-7 SOs calculation will show how many trades are closed with DCA, and allow for fine-tuning.
Happy Trading!
This script will be effective to backtest and produce the best settings for each timeframe and pair across all STP Scripts.
This will take a lot of the manual work out of backtesting for our users while improving profit potential.
Happy Trading!

FXC Order Block Finder █ OVERVIEW
The FXC Order Bock Finder finds and draws institutional order blocks according to the Smart Money Concept. Order blocks are zones where institutions have most likely left some orders that need to be filled at a later point in time. In These order blocks or POIs can be used to either place limit orders or to look for instant entries as price comes to retest the zone. It works on all time frames but higher time frames tend to be more precise.
█ HOW DOES IT WORK?
The indicator waits for a break of structure (BOS) and then prints a zone if there's an engulfing pattern and an open imbalance. Basically it draws zones where a fake move followed by aggressive buying or selling happened and Imbalances were left open.
█ WHAT MAKES IT UNIQUE?
Apart from the fact that I haven’t found any indicator that is able to properly draw order blocks most indicators do re-paint which doesn’t make any sense in the case of the Smart Money Concept.
Furthermore does this indicator have settings that let’s you adjust how the order blocks are drawn. From wick to end of the imbalance or candle close to imbalance. Also you can set how many candles it takes into consideration for the imbalance in case the imbalance starts after the engulfing pattern has formed. And you can set how many candles have to checked to determine a BOS or an internal BOS by using fractal breaks.
█ HOW TO USE IT?
Either place sell limits at the lower end of the order block with SL slightly above the OB and buy limits at the upper end of the OB with SL slightly below the OB. Target a fixed Risk Reward Ratio or trade it to the next order block. By using multi time frame analysis you can determine the overall direction of the market and prevent low probability trades. Also worth mentioning is that order blocks that have been created during high volume sessions tend to result in way better trades than with order blocks that have been printed during the Asia session.
█ ADDITIONAL INFO
As soon as price retested an order block the order block is mitigated and therefore not valid anymore. Also order blocks that are too far back in time are less probable to deliver good trades. In general the win rate tends not to be too high using this method but more often than not there's a reaction as price taps into an order block and trades with high RRR are quite often. As always in trading, proper money management and risk management is key.
█ DISCLAIMER
This is not financial advice. The Indicator spots these zones according to the smart money concept . However there's absolutely no guarantee that a nice order blocks results in a good trade.
█ Examples

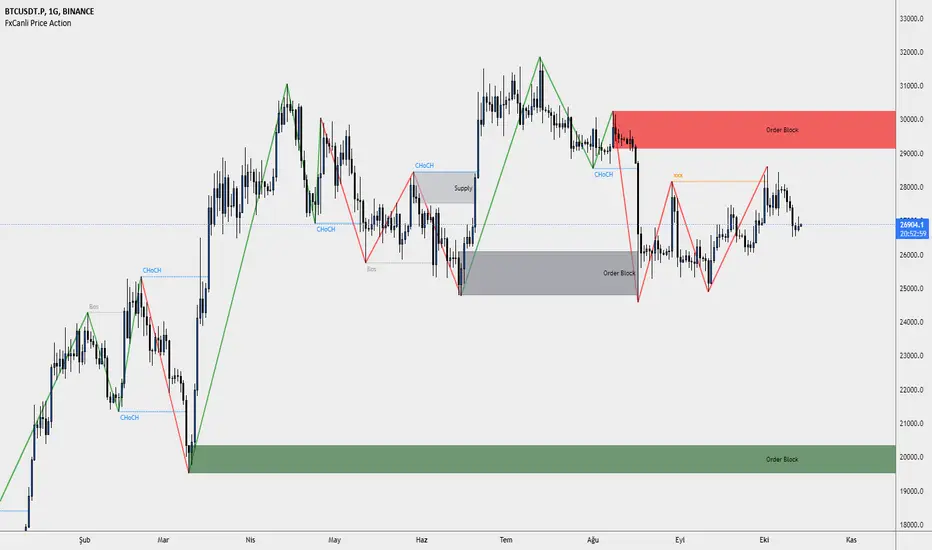
FxCanli Price ActionEN - FxCanli TradingView Price Action indicator can draw and alert at;
Break of Structure (BOS),
Change of Character (CHoCH),
Liquidity,
Order Block,
Power Zone.
TR - FxCanli TradingView Price Action indikatörü grafiklerinizde;
Break of Structure (BOS)
Change of Characte (CHoCH)
Liquidity
Order Block
Power Zone seviyelerini otomatik olarak çizer ve alarm verir.
FEATURES & EXAMPLES / ÖZELLİKLER & ÖRNEKLER
**************************************************************
Market Structure;
EN - You can easly follow market structure, Up Trend with green waves, Down trend with Red waves
TR - Market yapısını kolayca takip edebilirsiniz. Yukarı trendi yeşil dalgalar ile, Aşağı trendi kırmızı dalgalar ile.
Change of Character (CHoCH)
*************************************
EN - Shows trend reversals
TR - Trend dönüşümlerini gösterir
Break of Structure (BOS)
******************************
EN - Shows trend continuations
TR - Devam eden trendleri gösterir
Liquidity
***********
EN - Shows Liquidity levels
TR - Likidite seviyelerini gösterir
Order Block
***************
EN - Shows Order Block levels which is a technical analysis technique that tracks the accumulation of orders (when bullish) and distribution of orders (when bearish) of banks and institutional traders.
TR - Bankaların ve kurumsalların emir birikimini (yükseliş olduğunda) ve emir dağılımını (düşüş olduğunda) Order Block olarak gösterir.
Jimmy's Dikfat DaytraderThis Day Trading Indicator applies the use of multiple techniques designed to maximize profits and trade success probability while utilizing proprietary mathematical techniques to calculate specific high probability Pivot Points, Break of Structure, Supply and Demand, previous days High and Low, Liquidity Hunts, Dynamic Trend Lines and Fibonacci Discount Zones. The combination of these techniques combined with unique mathematical calculation & variance allow the user to make an informed analysis to take high probability trades by exposing Market Maker discount zones and highlight smart money purchasing.
Pivot Points: A traditional pivot point is described as an individual candle high that is higher than the previous two candles to the left and forward two candles to the right. Likewise a pivot is also an individual candle low that is lower than the previous two candles to the left and forward two candles to the right. In this indicator standard pivots are highlighted as yellow and white candles. Yellow candles are High or Top Pivots; White Candles are Low or Bottom Pivots. The number of pivots checked for either left or right or both can be changed in the settings. Increasing this value will add more pivot points to the chart, decreasing this value will add less. It is recommended to change values left and right with the same number.
Note: In this study, all traditional pivots will be highlighted by yellow or white for the advanced user, but not all pivot markers will highlight all pivots for the purposes of identifying a high probability trade.
Break of Structure: Break of structure occurs when current price drops below or likewise rises above a pivot point. For the purposes of this study, a break of structure tag will appear over a previous pivot tag ONLY when there is a candle close below or above the previous pivot for the purposes of identifying liquidity hunts and high probability trades. As you will note in the example chart, break of structure is used to determine not only trend but high probability trade areas by identifying market structure. Unbroken pivot highs or lows can be used to take trades, with a stop below the low (or above the high) of the unbroken pivot candle. BOS (Break of Structure) Tags will effectively show where market participants do not want to take a trade and be chopped up in a market that is trending only 30% of the time. BOS also gives future indication of where the Market Makers are taking price action. Breaks of structure in a particular direction typically indicate a continuation of price action in that direction. Trade opportunities occur after the pullback in the opposite direction of break of structure. This highlights areas traders can take on the pullback, in the direction of structure breaks, typically on unbroken pivots.
Note: In this study, not all BOS (Break of Structure) markers will highlight all breaks of structure for the purposes of identifying a high probability trade. Some very few examples of structure is not marked as broken to assist in identifying Liquidity Hunts.
Liquidity Hunt: A Liquidity Hunt is where price action moves in the opposite direction of an intended move (typically with high magnitude and velocity) to gather "Liquidity" and trigger stops created by traders caught in the break of structure zone. Any unbroken pivot is a relevant area of Liquidity. Some of the High probability areas of Liquidity will be found at Equal (or near equal) Lows or Equal High pivots. Current areas of Liquidity are marked on the chart as an Aqua (Light Blue) Background line that extends right infinitely. Once Liquidity has been taken at one of these lines, the Line will "Break" And stop displaying forward. The number of pivots calculated specifically for break of structure and Liquidity Hunts can be changed under the Liquidity Hunt setting. Much like with pivots, it is recommended to change these numbers with the same value for best results.
Due to the complexity of the math, Some liquidity pivots will only confirm and display a pivot tag after twice the candles defined have been found to the left and right under liquidity hunt settings, and some will display after the exact number specified in settings. As noted previous some will not display at all due to the high probability nature of this indicator and having been found as a "cluster" in the Supply and Demand Boxes.
Supply and Demand Boxes: Supply and Demand boxes will be created when a specific number of pivots are found in succession or in a "cluster" and a box will be drawn from the current grouping of pivots, first pivot high to the nearest pivot low in the cluster. This unique style of supply and demand box drawing has been proven to be an effective identifier of buying and selling in the price action, or likewise support or resistance upon return to these boxes. The boxes were specifically designed to identify high probability areas of Supply and Demand and are more likely to be areas of high probability buying and selling. Supply is when price action moves into or creates an area where sellers are waiting. Demand is when price action moves into or creates an area where Buyers are waiting. When price action creates a box, the box will remain Neutral with a white color while Price action remains within the box. This box will turn Red or into a Supply Box, when price action drops below the box boundaries. The box will likewise turn Green or into a Demand Box, when price action rises above the box boundaries. Any return to a colored box from the direction it was created could be anticipated as a retracement to continue in the direction of price action indicated by the box.
In the settings boxes can be extended to the current bar right to show previous areas of supply and demand, or can be left "Truncated" or in box form as a highlighter for cluster analysis.
Previous Days High and Low: The previous days High and low will be displayed on the current day as a magenta line. Some traders use these lines to anticipate price action on the day compared to where price action is moving relative to the previous day. Historical Magenta lines are also the marked on a specific day, for the previous days High and low. Historical Lines can be turned off by reducing Opacity of the setting to Zero, leaving only the previous days high and low on the current day.
Dynamic Trend Lines: Trend Lines will be created automatically that will connect unbroken pivots and extend right, highlighting the current trend. (Coming Soon™️)
Fibonacci Discount Zone: The Fibonacci Discount Zone can be found by measuring an unbroken pivot High or Low, that breaks structure left to create a new High or Low. When structure is broken and price begins a retracement before moving back in the direction of the broken structure, the retracement is typically back into the "Discount Zone" between the 618 and 786 Fibonacci zone. This zone will be automatically plotted as a light grey box in the background of the chart. (Coming Soon™️)

TopTenAlgo 2. HFT AlgoEN: High Frequency Trade Algo TVQ is an advanced algorithmic system developed using Volume Weighted / Exponential Moving Averages, vWap and Ichimoku . Said indicators are re-blended with the Volume Weighted Average ( vWap ) algorithm used by Merryl Lynch or Yapıkredi algorithms. It does not act like the classic Ichimoku or Moving Averages. TVQ was used instead of RSI . High Frequency Trade Algo's incorporate a 3-sided trading strategy that detects Risk Areas and allows you to stay Flat if necessary (red and white circles above the bars) or generates appropriate signals in the buy and sell regions, that measures the risk. In the triangle or flat / horizontal corrections you need to stay flat, it warns you beforehand that you are in the risky area, while the trend will occur, it warns you with a buy or sell signal.
This algorithm is prepared with @Top10Algo ... Optimization Risky and Wait Zone
TR: High Frequency Trade Algo TVQ, Hacim Ağırlıklı/Exponential Hareketli Ortalamalar, vWap ve Ichimoku kullanarak geliştirilen gelişmiş bir algoritmik sistemdir. Bahsi geçen göstergeler Merryl Lynch yada Yapıkredi algoritmalarının kullandığı Volume Weighted Average ( vWap ) algoritması ile yeniden harmanlanmıştır. Klasik Ichimoku yada Hareketli Ortalamalar gibi hareket etmez. RSI yerine TVQ kullanılmıştır. High Frequency Trade Algo’ lar Riskli Bölgeleri tespit edip gerekirse Flat kalmanızı sağlayan(barların üstündeki kırmızı ve beyaz daireler) yada alım ve satım bölgelerinde uygun sinyaller üreten yani riski ölçen 3 taraflı bir trading stratejisini içinde barındırır. Flat kalmanız gereken üçgen yada yassı/yatay düzeltmelerde sizi riskli bölgede olduğunuz konusunda önceden uyarırken, trend oluşacağı zamanda al yada sat sinyali ile önceden uyarır.
Bu algoritma @Top10Algo ile beraber hazırlanmıştır...Riskli ve Bekleme yapılan Flat bölgelerle ile ilgili iyileştirmeler yapıldı...

Super MyMA PrismThis script implements the Binary Trade Logic (BTL) algorithm to calculate two distinct scores that range from 0 to 7. One score is calculated assigning a power of 2 weight to the positive sign of 3 Phi^3 distant Moving Average (MA) slopes. The other score is calculated assigning a power of 2 weight to the sign of the difference between the price and the value of 3 Phi^3 distant Moving Average (MA).
For the first score, hereafter called as the angle score (AS), the largest MA slope positive sign receives weight 4, the middle length MA slope positive sign receives weight 2 and the shortest MA slope positive sign receives weight 1. The positive sign of an MA is defined as 1 if the slope of the MA is positive and 0, otherwise. Therefore, for MAs 305, 72 and 17, if slope(MA305) > 0, slope(MA72) < 0 and slope(MA17) > 0, then score will be 4*1 + 2*0 + 1*1 = 5. Up to my knowledge, this score was first proposed by Bo Williams and named by him as Prisma.
For the second score, hereafter called as the value score (VS), if the price > largest MA, it receives weight 4. If the price > the middle length MA, it receives weight 2 and if the price > the the shortest MA, it receives weight 1. Therefore, for MAs 305, 72 and 17, if price < MA305, price > MA72 and price > MA17, then score will be 4*0 + 2*1 + 1*1 = 3. Up to my knowledge, this score was first proposed by Bo Williams and named by him as Prisma.
Both AS and VS are calculated for Phi^3 lengths (610, 144, 34) and for Phi^3/2 lengths (305, 72, 17). The scores of the same kind calculated for each set of length are combined multiplying the Phi^3 length score by 10 and adding with with the Phi^3/2 score, therefore providing a 2 digit score ranging from 0 to 77. For instance, if we have AS(610, 144, 34) = 7 and AS(305, 72, 17) = 5, we have AS=75. At the same time, if we have VS(610, 144, 34) = 6 and VS(305, 72, 17) = 4, we have VS=64.
The used Moving Averages can be chosen between EMA and MyMA. MyMA is a Moving Average that tries to mimic Bo William's MIMA. Due to the close resemblance between MyMA and MIMA, I do not feel comfortable to open this script source code. In order to learn how this script operates with EMAs, please refer to my Super EMA Prism indicator that has its source code open.
VS score is plotted by default in black, but it can be on white for dark themes. AS is plotted with the color of the longest MA used.
Chart background is colored according to the range of values for AS and VS, checked in the following order:
if AS >= 13 and VS <= 13 then back color = red
if AS >= 13 or VS <= 13 then back color = orange
if AS >= 64 and VS >= 64 then back color = green
if AS >= 64 or VS >= 64 then back color = blue
otherwise back color = none (white o black)

SM Screener — Alert Engine (Tiered)🔥 Momentum Radar — Powered by My Premium All-In-One Signal Engine
This isn’t just another screener.
This is the official early-warning radar that plugs directly into my Premium All-In-One Buy/Sell Signal Tool.
The Premium version is where the real executions happen — the legitimate Buy and Sell signals, trend flips, squeeze confirmations, BOS/CHOCH tracking, and high-accuracy momentum logic.
But this?
This is the scanner that tells you where to look BEFORE the big move happens.
If the Premium tool is the weapon…
this screener is the radar locking onto targets.
🚀 What It Actually Does
It monitors every ticker on your chart and fires alerts the moment a symbol starts showing:
✔ Early momentum ignition
✔ Rising relative volume
✔ Trend pressure shifting
✔ Volatility expansion
✔ Early squeeze build-up
✔ Clustered signal behavior
✔ High-tier conviction score
These alerts tell you exactly which tickers to pull up in your Premium tool so you can inspect the chart deeper with full confirmation.
If you're serious about catching explosive moves, this combo is unreal.
💥 Designed for Traders Who Want the Monster Moves
This system is built for the same plays that create legends — the massive momentum runners and wild squeezes like the $4 → $400+ SMX eruption.
The goal is simple:
**Find the move early.
Confirm it with the Premium tool.
Then ride it with confidence.**
⚡ Alert Engine That Feels Like Insider Info
Every alert is laser-targeted:
🔥 Early Interest — tells you something is heating up
🔥 Entry Signal — means the ticker is firing on all cylinders
🔥 Volume bursts
🔥 Momentum flips
🔥 High conviction score
🔥 Trend strength alignment
You get notified instantly so you never miss the tickers entering “potential explosion mode.”
Perfect for:
→ Custom automation
→ Watchlist building
📈 A Complete Momentum Ecosystem
This isn’t a standalone indicator — it’s part of a full ecosystem:
1️⃣ The Premium All-In-One Tool (master)
→ Generates true Buy/Sell signals
→ Full trend model
→ Squeeze engine
→ Premium/discount logic
→ Volume & volatility confirmation
→ BOS/CHOCH structure tracking
2️⃣ THIS Screener Engine (scanner)
→ Alerts you which tickers deserve attention
→ Filters out noise
→ Points you to the potential runners
→ Helps you never miss the early setups
Together, they’re unreal.
⭐ Follow for More
This is only one piece of a growing suite of professional-grade tools I’m publishing.
If you want:
🔥 More scanners
🔥 Predictive momentum engines
🔥 AI-grade alert logic
🔥 My official Premium trading toolkit
Hit Follow — new releases drop frequently.
Trade smart.
Trade fast.
And catch the ones everyone else regrets missing.

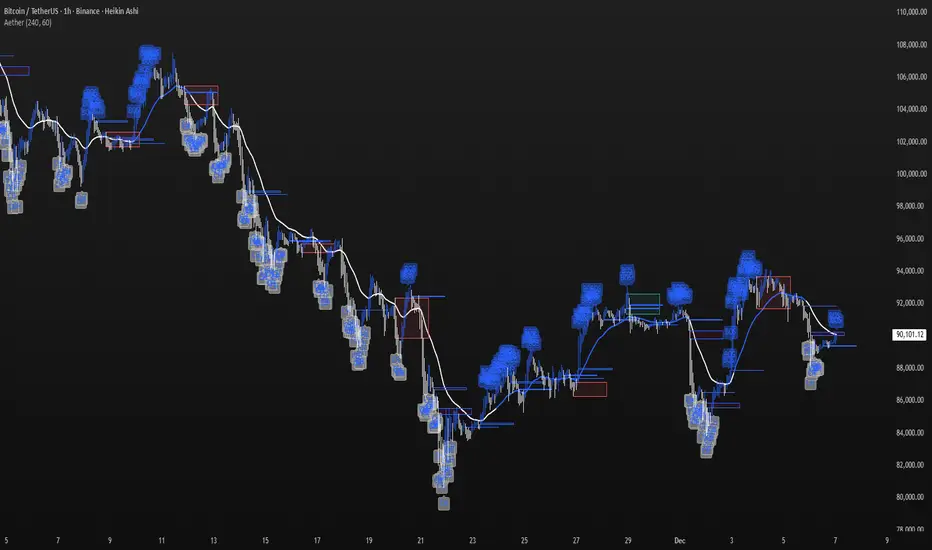
Aether Market MapAether Market Map A multi-component structure-based tool that aids chart analysis by visually displaying various market structure elements.
It combines order blocks, fair value gaps, liquidity segments, trend-shifting signals, and more to help users interpret the pricing structure more clearly.
This script does not provide specific trading strategies or investment advice and is a reference tool for chart analysis.
🔍 Key Features
1. Order Blocks (OB)
Displays the potential inflection sections in box form according to the specified conditions.
This feature helps to visually grasp the price segments that market participants have repeatedly responded to.
2. Fair Value Gaps (FVG)
It detects the area where the imbalance between the candles has occurred and displays it in a box form.
The area represents the section where there has been a fast movement or abnormal flow of prices.
3. Liquidity Levels
Shapes the points where liquidity was gathered through a short-term high-point and low-point pivot structure.
You can see the structural levels at which prices can react repeatedly.
4. BOS / CHOCH (Structural Change Detection)
Label changes in market structure based on recent high/low breakthroughs.
This is not just trend tracking, it helps us to visually grasp the changes in the structure itself.
📈 Analysis of multi-time frame trends
We compute the comprehensive trend state by leveraging the moving average slope of the swing and macro higher order time frames.
These values are reflected in chart background and EMA color changes to intuitively display the overall market mood.
Positive Environment (Regime > 0) → Green Family
Negative Environment (Regime < 0) → Red Series
This is a simple visualization of the flow of the market to the user, not a specific trading direction.
🔧 Signal Engine (Confluence-Based Visual Tool)
The script does not provide a transaction signal and does not induce a particular trading decision.
The Signal feature is a visual notification element that appears on the chart when a number of conditions overlap.
a change in the ratio of trading volume
Structural activities in recent analysis sections
Trending Environment
short-term momentum change
This feature is a reference visual element for interpreting market data from multiple perspectives.
🎛 Setting Items
Show Order Blocks — Visualize Order Blocks
Show Fair Value Gaps — Show FVG Detection
Show Liquidity Levels — Show pivot-based liquidity areas
Show BOS/CHoCH — Show Structural Switching Points
Show Trade Signals — Display visual signal notifications
HTF Settings — Enter parent timeframe analysis values
💡 Precautions for Use
This script is a market structure visualization tool and does not guarantee specific trading strategies, forecasts, or returns.
Components are calculated based on historical data and may not fully reflect real-time market changes.
All features are intended for research and chart analysis assistance purposes.
📌 Official Disclaimer
This script does not provide investment, finance, or trading advice.
All trading judgments made by the user and their consequences are the user's own responsibility.
This tool only provides a reference visualization function to assist with analysis.
SMC Indicator by BadshahIntroduction
Unlock the hidden narrative of price action with this focused Smart Money Concepts (SMC) toolkit. Designed for precision and clarity, this indicator strips away chart noise to reveal the "skeleton" of the market. Whether you are tracking trend continuations or hunting for valid reversals, this tool automates the technical heavy lifting, allowing you to focus purely on execution.
How It Works
This script analyzes price action in real-time to map out two critical components of institutional trading:
1. Market Structure Architecture The indicator uses a rolling pivot algorithm to identify significant Highs and Lows based on your preferred sensitivity.
BOS (Break of Structure): Marks the confirmation of trend momentum. A solid line is drawn when price successfully closes beyond a structural pivot in the direction of the trend (e.g., breaking a high in an uptrend).
ChoCh (Change of Character): signals a potential shift in market sentiment. A dashed line appears when price violates a key swing point opposite to the prevailing trend, often the first sign of a reversal.
2. Liquidity Inefficiencies (FVG) The script scans every candle formation to detect Fair Value Gaps (Imbalances)—zones where aggressive buying or selling occurred without reciprocal trading.
Bullish Gaps: Highlighted when a candle's low fails to overlap with the high of the candle two periods prior.
Bearish Gaps: Highlighted when a candle's high fails to overlap with the low of the candle two periods prior.
These boxes extend forward, serving as high-probability "magnets" for price to revisit and rebalance.
Settings & Customization
Swing Length: Adjust the lookback period to tune the indicator for Scalping (lower values) or Swing Trading (higher values).
Visual Control: Toggle specific features (BOS, ChoCh, FVG) on or off and fully customize colors to blend with your chart theme.
Disclaimer
This indicator is strictly for analytical and educational purposes. It visualizes historical and real-time data but does not guarantee future market movements. Always manage your risk responsibly.
Smart Money Concepts by Rakesh Sharma🎯 SMART MONEY CONCEPTS - TRADE WITH INSTITUTIONS
Reveal where banks, hedge funds, and institutional traders enter the market. Trade alongside smart money, not against them!
✨ FEATURES:
- Order Blocks (OB) - Institutional buying/selling zones
- Fair Value Gaps (FVG) - Market inefficiencies to exploit
- Break of Structure (BOS) - Trend continuation signals
- Change of Character (ChoCh) - Early reversal detection
- Liquidity Sweeps - Stop hunt identification
- Premium/Discount Zones - Buy cheap, sell expensive
- Live Dashboard - Real-time market structure
🎯 HOW TO USE:
✓ BUY in Discount Zone at Bullish Order Blocks
✓ SELL in Premium Zone at Bearish Order Blocks
✓ Wait for ChoCh or BOS confirmation
✓ Follow institutional footprints for high-probability setups
📊 PERFECT FOR:
All markets - Nifty, Bank Nifty, Stocks, Forex, Crypto
All timeframes - 5m (scalping), 15m (intraday), Daily (swing)
⚡ TRADING EDGE:
Stop trading like retail. Start trading like institutions. See where smart money accumulates and distributes. Catch reversals early with ChoCh signals.
Created by: Rakesh Sharma | Version 1.0

IchimoGiu FX Pro IchimoGiu FX Pro — Advanced Trend & Structure Confirmation System
IchimoGiu FX Pro is an invite-only indicator designed to identify high-probability trend continuation setups using a dual-stage logic that combines market structure breaks with a custom Ichimoku-based confirmation engine.
Unlike standard Ichimoku or classic breakout indicators, IchimoGiu creates a unique interaction between structure shifts and equilibrium zones, allowing early detection of valid momentum phases while filtering out weak or false breakouts.
🔍 Core Functionalities
1️⃣ Pre-Breakout Detection (Structure Engine)
The indicator tracks relevant swing highs and lows and identifies when price approaches a potential BOS (Break of Structure).
This creates a Pre-Signal label, allowing traders to anticipate momentum shifts and prepare zones.
2️⃣ Confirmation Signal (IchimoGiu Filter)
Once structure is actually broken, the system applies a custom Ichimoku logic:
Tenkan/Kijun dynamic alignment
Cloud directional bias
Price location vs. equilibrium
Optional Chikou confirmation layer
Reset conditions to avoid false trends
Only when all internal conditions align is a confirmed BUY or SELL signal generated.
This makes IchimoGiu a precision tool for continuation trades, not a simple trend-following mashup.
⭐ What Makes IchimoGiu Original
IchimoGiu is not a merge of existing indicators.
It uses:
a proprietary pivot engine designed specifically for BOS/CHOCH,
re-engineered Ichimoku components optimized for confirmation speed,
an original pre-signal → confirmation structure logic,
unique reset and filtering conditions.
These concepts cannot be reproduced through classic Ichimoku or standard TradingView indicators.
📈 Best Practices
Recommended markets: XAUUSD, Nasdaq, US30, GBPUSD, EURUSD
Recommended timeframes: M15 → H1
Use the Pre-Signal to define interest zones
Enter only on confirmed labels for maximum reliability
🔒 Access
This is an invite-only script.
To request access, please send me a private TradingView message or contact me on Telegram.

LiqVision Institutional Suite v6.2 – Hybrid ModeLiqVision Institutional Suite v6.2 — Hybrid Mode (Lightning Edition)
Een ultra-geoptimaliseerde Smart Money-indicator gebaseerd op institutionele principes: Liquidity, Market Structure, Order Blocks, FVG’s en Model 1/2 setups.
Dit script combineert meerdere professionele SMC-concepten in één engine:
🔷 Functionaliteiten
1. Liquidity Engine
Automatische detectie van EQH, EQL en Liquidity Sweeps
Dynamische lijnprojectie met smart cleanup
Slimme sweep-detectie voor high-probability entries
2. Market Structure Engine
BOS & CHOCH detectie
Trend continuatie- en reversalsignalen
Swing-based pivot logic
3. Order Block Engine
Automatische OB-detectie met displacement filtering
Bullish & Bearish macro Order Blocks
HTF glow overlay (nieuw in v6.2)
4. FVG Engine
Major Fair Value Gap detection
Up/Down imbalance visual engine
HTF-based color restoration (v6.2 fix)
5. Model 1 & Model 2 Signal Engine
Trend continuation entries (Model 1)
Reversal setups gebaseerd op HTF liquidity & displacement (Model 2)
Auto-tapping logic geïntegreerd met OB/FVG
6. Hybrid Mode Rendering
Slimme shading afhankelijk van timeframe:
LTF → Hide OB/FVG
MTF → White overlays
HTF → Premium glow visuals
🔷 Alerts
Volledige alert-ondersteuning voor:
Model 1 Buy/Sell
Model 2 Buy/Sell
Liquidity Sweep
BOS Up/Down
CHOCH Up/Down
OB Tap
FVG Tap
Any alert() function call
Geschikt voor Telegram, Discord, bots en externe signal pipelines.
🔷 Gebruik
Voeg de indicator toe
Kies timeframe (1m–4h aanbevolen)
Activeer alerts via “Any alert() function call”
Volg Model 1/2 entries voor optimaal resultaat
⚡ DISCLAIMER
Dit script is uitsluitend bedoeld voor educatieve doeleinden. Geen financieel advies. Resultaten uit het verleden geven geen garantie voor de toekomst.

Triple Screen System [FlexibleMAs MACD-RSI-ADX]#### Triple Screen System (TSS-FMR)
The TSS-FMR script is a specialized, multi-timeframe confirmation tool built for Swing, Positional Traders, and Longer Term Investors. It is engineered to filter out low-conviction noise by implementing an advanced interpretation of the Elder's Triple Screen strategy, relying on proprietary momentum, volatility, and volume analysis to isolate high-probability setups.
---
#### 🧠 Core Methodology & Logic
The TSS-FMR synthesizes three distinct layers of confirmation to generate signals:
1. Macro Trend & Volatility: Determines the primary trend and overall market condition using configurable EMA+RSI metrics , the script uses Average Directional Index (ADX) as an internal component to filter out non-trending, consolidating market conditions.
2. Momentum Synchronization: A proprietary filter requiring MACD,MAs and RSI to be synchronized * within a specified bar window (`MACD/RSI Sync Window`) ensures that entries align with current short-term momentum shifts.
3. Volume & Price Action: Final entry is triggered only when the higher timeframes align and the entry timeframe (Daily or 4H) confirms the move, optionally requiring * Candle Confirmation * and filtering out low-quality trades using the * Volume Filter *
The key is the separation of input thresholds and lengths for Weekly and Daily lookbacks, allowing for precise tuning unavailable in standard public libraries.
---
#### 🎯 Understanding Signal Strength & Conviction
Signals are categorized using a proprietary Strength scale (from Overbought/Oversold to 6) to help traders gauge the potential size and probability of the momentum move, This scale is dynamically influenced by the ADX volatility readings.
#### 🔍 Integrating External Visual Tools (Addressing Rule: Vendor/Chart)
The TSS-FMR generates signals based solely on its internal logic and inputs .*
We recommend overlaying the TSS-FMR signals with external tools (such as the Lux Algo SmartMoneyConcepts indicator or similar public S/R tools) for visual confirmation only :
* Signals (2, 3, 4) + CHOCH/BOS: * A signal with lower internal strength (2-4) gains stronger conviction if it aligns precisely with a CHOCH or BOS event visually identified by the external tool. This confirms that the market structure is validating the script's momentum reading.
Zone Confirmation: When signals land precisely within visually defined Liquidity or Accumulation/Distribution Zones (provided by external visual tools), it adds significant conviction to the TSS-FMR's output.
The *Overbought/Oversold regions* are decided based on the script's internal strength calculation and prevailing price action.
#### Summary:
--- This script is for Swing, Positional Traders and Longer Term Investors
--- It will only work with Monthly,Weekly, Daily and 4H chart to help you make confirmation based positions.
--- Sell Signals are Overbought Exits and Short sell signals, Plan according to Weekly Signals and Daily signals
--- Use the Momentum Table/matrix at the right top of the chart when TSS indicator is active.
--- Use Volume Filter enable to remove chaos of signals
--- Keep *Lux Algo -SmartMoneyConcepts* indicator active for visual of zones
--- Adjust Volume Filter in Settings to avoid crowding of signals
--- Adjust Input signal length to select number of history bars
--- Watch-out for Weekly 100ema Line and
--- Watch-out for Sell Signals, in discount region they are marked as Buy oversold or moderate, vise versa Sell Overbought signals are added to the charts.
--- To earn money, we need to look out for early signals, fake breakouts, breakdowns and what we want the table/matrix turning all green or red in Momentum trades.
---
#### House Rule Compliance Statement
This script description is provided strictly for technical clarity. It is free from all promotional content, external links, contact information, social media references, and solicitations, as per TradingView's General House Rule #2. The justification for its closed-source nature is based on its proprietary signal synchronization logic and flexible, multi-timeframe implementation.

Smart Money Concepts [Modern Neon V2]This is a visually overhauled version of the popular Smart Money Concepts (SMC) indicator, designed specifically for traders who prefer Dark Mode, High Contrast, and Maximum Visibility.
While the underlying logic preserves the robust structure detection of the original LuxAlgo script, the visual presentation has been completely modernized. The default "dull" colors have been replaced with a vibrant Cyberpunk Neon palette, and text labels have been significantly upscaled to ensure market structure is readable at a glance, even on high-resolution monitors.
🎨 Visual & Style Enhancements:
Neon Palette:
Bullish: Electric Cyan (#00F5FF)
Bearish: Neon Hot Pink (#FF007F)
Neutral/Levels: Bright Gold (#FFD700)
High Visibility Text: Market Structure labels (BOS, CHoCH, HH/LL) have been upgraded from "Tiny" to Normal size. Key Swing Points (Strong High/Low) are set to Large.
Modern "Solid" Blocks: Order Blocks and FVGs feature reduced transparency (60%) for a bolder, solid look that doesn't get washed out on dark backgrounds.
Decluttered: Removed unnecessary "Small" elements and dotted lines to focus on price action.
🛠 Key Features:
Real-Time Structure: Automatic detection of Internal and Swing structure (BOS & CHoCH) with trend coloring.
Order Blocks: Highlights Bullish and Bearish Order Blocks with new mitigation logic.
Fair Value Gaps (FVG): Auto-threshold detection for high-probability gaps.
Premium & Discount Zones: Automatically plots equilibrium zones for better entry targeting.
Multi-Timeframe Levels: Display Daily, Weekly, and Monthly highs/lows.
Trend Dashboard: (If you added the dashboard code) A clean panel displaying the current Internal and Swing trend bias.
CREDITS & LICENSE: This script is a modification of the "Smart Money Concepts " indicator.
Original Author: © LuxAlgo
License: Attribution-NonCommercial-ShareAlike 4.0 International (CC BY-NC-SA 4.0)
creativecommons.org

Smart Money ProSmart Money Pro V 8.1 is an advanced trading indicator that tracks institutional "smart money" movements using multiple Smart Money Concepts (SMC) techniques:
Market Structure: Identifies Change of Character (CHoCH), Break of Structure (BOS), and Internal/External Market Structure (IDM)
Order Blocks: Detects demand/supply zones including EXT OB, IDM OB, SCOB, and mitigation/breaker blocks
Order Flow: Tracks major and minor order flows with mitigation levels
Fair Value Gaps (FVG): Highlights price inefficiencies and imbalance zones
Liquidity Levels: Maps liquidity sweeps and key pivot levels
Price Structure: Shows OTE (Optimal Trade Entry) zones, PDH/PDL (Previous Day High/Low), equilibrium levels, and swing sweeps
Candle Patterns: Detects Inside and Outside bars
The indicator helps traders identify institutional entry/exit points, liquidity grabs, and high-probability trading zones.
Smart Money Pro V 8.1 هو مؤشر متقدم لتتبع تحركات المؤسسات المالية "الأموال الذكية" باستخدام مفاهيم Smart Money Concepts (SMC):
هيكل السوق: يحدد تغيير الاتجاه (CHoCH)، كسر الهيكل (BOS)، والهيكل الداخلي/الخارجي (IDM)
مناطق الطلب والعرض: يكتشف Order Blocks بأنواعها (EXT OB, IDM OB, SCOB) ومناطق الاختراق والتخفيف
تدفق الأوامر: يتتبع التدفقات الرئيسية والثانوية مع مستويات التخفيف
فجوات القيمة العادلة (FVG): يبرز مناطق عدم الكفاءة السعرية وعدم التوازن
مستويات السيولة: يرسم مصائد السيولة والنقاط المحورية الرئيسية
هيكل السعر: يعرض مناطق OTE (نقاط الدخول المثلى)، أعلى/أدنى سعر سابق (PDH/PDL)، مستويات التوازن، وكسر القمم/القيعان
أنماط الشموع: يكتشف شموع Inside و Outside Bar

Aggressive VS Passive Orders Depletion @MaxMaserati 3.0Aggressive VS Passive Orders Depletion Indicator
Overview
This institutional-grade order flow analysis tool identifies and tracks limit order accumulation zones where significant buy and sell orders are placed in the market. It combines Highest Volume Candle Profile analysis with Market Structure detection to reveal where institutional traders have positioned their orders, and monitors in real-time whether these orders are being absorbed (depleted) or defended.
Core Concept: Order Block Detection & Depletion
This tool tracks the actual limit orders at key price levels and shows you:
Where institutional orders are placed (Buy Order Blocks vs Sell Order Blocks)
How strong these order zones are (original volume strength as %)
Real-time order flow activity (aggressive buyers vs aggressive sellers)
Depletion status (are the orders being consumed or defended?)
How It Works: Dual-Engine System
Engine 1: Volume Profile Analysis - Point of Control (POC) Detection
Divides price range into 25 horizontal levels (configurable)
Analyzes the last 120 bars (configurable lookback)
Distributes volume across price levels based on where each bar traded
Identifies the Point of Control (POC) - the price level with highest traded volume
Determines market bias: Bullish if price above POC, Bearish if below
Purpose: Shows where the majority of volume has been traded, indicating institutional accumulation zones and fair value areas.
Engine 2: Market Structure Analysis (PHL - Pivot High/Low)
Uses fractal pivot detection (configurable strength)
Identifies swing highs and lows that create market structure
Tracks Break of Structure (BOS) - price breaks recent swing in trend direction
Tracks Market Structure Shift (MSS) - price breaks swing points against trend
Maintains a trailing price at the most recent significant swing point
Purpose: Identifies where smart money is likely defending key structural levels with limit orders.
Key Innovation #1: Dynamic Confluence Zone Detection
When the Volume Profile POC and Market Structure trail price align within a configurable sensitivity threshold (default 1.0%), the indicator creates an Order Block Zone.
The Algorithm:
Monitors both engines continuously
Creates zones ONLY when POC is within X% of the structural swing point
Both engines must agree on the significance of the price level
Optional volume confirmation filter
This dual-confirmation approach filters out weak levels and highlights only the highest-probability zones where institutional orders are likely clustered.
Zone Types:
🟢 Buy Order Blocks (Support) - Created when confluence occurs with price above the zone. Represents accumulated buy limit orders waiting to support price.
🔴 Sell Order Blocks (Resistance) - Created when confluence occurs with price below the zone. Represents accumulated sell limit orders waiting to resist price.
Key Innovation #2: Real-Time Aggressive VS Passive Order Flow Analysis
The indicator performs sophisticated order flow decomposition on each candle that interacts with a zone, separating market activity into distinct categories:
Order Flow Categories:
1. Aggressive Orders - Market orders that consume liquidity
Aggressive Buy Volume: Market buys hitting sell limits (taking offers)
Aggressive Sell Volume: Market sells hitting buy limits (hitting bids)
Marked with (AGG) label when detected
Indicates urgent traders willing to pay the spread
2. Passive Orders - Limit orders adding liquidity
Passive Buy Volume: New buy limits being placed (making bids)
Passive Sell Volume: New sell limits being placed (making offers)
Shows patient traders providing liquidity
3. New Order Flow - Fresh buying/selling pressure
New Buyers: Total new buying activity (aggressive + passive)
New Sellers: Total new selling activity (aggressive + passive)
Net pressure indicator for zone health
Key Innovation #3: Advanced Order Flow Decomposition Algorithm
The indicator uses a proprietary candle analysis formula to separate aggressive from passive orders based on two key metrics:
Key Metrics:
Body Strength = |Close - Open| / (High - Low)
Close Position = (Close - Low) / (High - Low)
Bullish Candle Analysis:
Strong Aggressive Buying (Close Position ≥ 0.8 AND Body Strength ≥ 0.7):
90% aggressive buying, 10% passive selling, 90% new buyers
Moderate Aggressive Buying (Close Position ≥ 0.6 AND Body Strength ≥ 0.5):
70% aggressive buying, 20% passive selling, 80% new buyers, 20% new sellers
Weak Bullish (Close Position ≥ 0.5):
0-30% aggressive buying, 20-30% passive selling, 60% new buyers, 40% new sellers
Very Weak Bullish (Close Position < 0.5):
0% aggressive buying, 40% passive selling, 40% new buyers, 60% new sellers
Bearish Candle Analysis:
Strong Aggressive Selling (Close Position ≤ 0.2 AND Body Strength ≥ 0.7):
90% aggressive selling, 10% passive buying, 90% new sellers
Moderate Aggressive Selling (Close Position ≤ 0.4 AND Body Strength ≥ 0.5):
70% aggressive selling, 20% passive buying, 80% new sellers, 20% new buyers
Weak Bearish (Close Position ≤ 0.5):
0-30% aggressive selling, 20-30% passive buying, 60% new sellers, 40% new buyers
Very Weak Bearish (Close Position > 0.5):
0% aggressive selling, 40% passive buying, 40% new sellers, 60% new buyers
What This Reveals:
High close position + strong body = Aggressive buying overwhelming sellers
Low close position + strong body = Aggressive selling overwhelming buyers
Mid-range close = Battle between buyers and sellers
Small body = Passive orders dominating (limit orders being placed, not filled)
Key Innovation #4: Dynamic Depletion System with Intelligent Thresholds
The indicator adapts depletion thresholds based on zone strength:
High Liquidity Zones (>300% volume strength):
Depletion at 40% consumption - Massive clusters considered broken early because partial depletion indicates institutional withdrawal
Medium Liquidity Zones (150-300% volume strength):
Depletion at 60% consumption - Standard institutional behavior, majority must be consumed
Normal Liquidity Zones (75-150% volume strength):
Depletion at 80% consumption - Retail and smaller institutional zones need near-complete absorption
Low Liquidity Zones (<75% volume strength):
Depletion at 100% consumption - Weak zones must be fully absorbed before marked depleted
Why This Matters:
Strong zones failing early = powerful reversal signal (institutions gave up)
Weak zones holding = hidden strength (more orders being added)
Adaptive logic prevents false signals from fixed thresholds
Depletion Formula:
For Buy Order Zones:
Zone Liquidity % = (Original Buy Volume / Average Volume) × 100
Consumed % = (Sell Volume Absorbed / Average Volume) × 100
If Consumed Volume > Dynamic Threshold → Zone DEPLETED
For Sell Order Zones:
Zone Liquidity % = (Original Sell Volume / Average Volume) × 100
Consumed % = (Buy Volume Absorbed / Average Volume) × 100
If Consumed Volume > Dynamic Threshold → Zone DEPLETED
Key Innovation #5: Absorption Detection & Battle Analysis
The indicator identifies when one side is overwhelming the other using a configurable Absorption Threshold (default 1.5x = 50% more volume).
Battle States for Buy Order Blocks:
New Buyers Dominating (New Buyers > New Sellers × 1.5):
Label: ↑ New Buyers: +X% - Buy orders successfully defended
Sellers Attacking (New Sellers > New Buyers × 1.5):
Label: ↓ Sellers Attack: +X% (AGG) - Sell orders overwhelming the zone
Active Battle (Both active, <1.5x ratio):
Label: Battle: B+X% vs S+Y% - Active two-way order flow
Quiet Zone (Minimal activity):
Label: ↔ Quiet: X% - Zone untested or ignored
Battle States for Sell Order Blocks:
New Sellers Dominating (New Sellers > New Buyers × 1.5):
Label: ↓ New Sellers: +X% - Sell orders successfully defended
Buyers Absorbing (New Buyers > New Sellers × 1.5):
Label: ↑ Buyers Absorb: +X% (AGG) - Buy orders overwhelming the zone
Active Battle (Both active, <1.5x ratio):
Label: Battle: S+X% vs B+Y% - Active two-way order flow
Quiet Zone (Minimal activity):
Label: ↔ Quiet: X% - Zone untested or ignored
The (AGG) Marker:
Appears when aggressive market orders are detected (high body strength + extreme close position). Indicates institutional-sized urgency—someone is willing to pay market price NOW. Often precedes breakouts or strong continuations.
Label System Explained
No Label = Untested Zone
When a zone is first created, you see ONLY the colored box with NO label. This means:
Price has NOT yet reached this order block
The limit orders are still pending/resting
The zone is a future area of interest
Labels only appear after first price contact
Label Format (After First Touch):
Line 1: ● XX% Order Type
Line 2: Flow Analysis
Example Labels:
Buy Order Blocks:
● 150% Buy Orders + ↑ New Buyers: +85%
● 150% Buy Orders + ↑ New Buyers: +120% (AGG)
● 150% Buy Orders + Battle: B+45% vs S+38%
● 150% Buy Orders + ↓ Sellers Attack: +95% (AGG)
● 150% Buy Orders + ↓ Sellers Attack: +95% (AGG)
● 150% Buy Orders
Sell Order Blocks:
● 200% Sell Orders + ↓ New Sellers: +110%
● 200% Sell Orders + ↓ New Sellers: +140% (AGG)
● 200% Sell Orders + Battle: S+62% vs B+41%
● 200% Sell Orders + ↑ Buyers Absorb: +88% (AGG)
● 200% Sell Orders + ↑ Buyers Absorb: +88% (AGG)
● 200% Sell Orders
Status Indicators:
- Price penetrated through the zone
- Orders fully consumed, zone exhausted
Gray color - Zone no longer active
Directional Arrows:
↑ - Upward pressure (buyers stronger)
↓ - Downward pressure (sellers stronger)
↔ - Balanced/quiet (low activity)
↗ / ↘ - Mixed battle with bias
Point of Control (POC) Sub-Level Analysis
Each order block contains advanced volume distribution tracking:
Multi-Level Analysis (default 5 levels): Zones subdivided into horizontal price levels
Volume Distribution: Every candle's volume distributed across sub-levels based on price overlap
Buy/Sell Separation: Each level tracks buy vs sell volume independently
Dynamic POC Line: Marks the price level with highest traded volume within the zone
Real-Time Updates: POC adjusts as new volume enters, showing where "fairest price" is migrating
Style Options: Solid, Dashed, or Dotted lines (configurable width 1-5)
POC Trading Significance:
Represents the most accepted price within the order block
Often the best entry price for limit orders (highest liquidity)
POC migration shows whether zone is being "worked higher" or "worked lower"
Breaking through POC often signals zone failure
Key Settings
Volume Profile:
Lookback Period: 120 bars (historical period for POC)
Price Rows: 25 levels (granularity of volume distribution)
Volume Confirmation: Require structure breaks to align with volume bias
Market Structure:
Pivot Strength: 1 (swing detection sensitivity)
Show Trail: Optional trailing price visualization
Confluence Detection:
Sensitivity: 1.0% (distance threshold for POC/Structure alignment)
Lower = Stricter confluence, fewer zones
Higher = More zones detected
Order Flow Analysis:
Show Real-Time Order Flow: Live buyer/seller activity
Show Aggressive Markers: (AGG) labels for market orders
Show Directional Arrows: Price direction indicators (↑↓↔↗↘)
Absorption Threshold: 1.5x (when one side overwhelms the other)
1.5 = 50% more volume needed
2.0 = 100% more (stricter)
1.2 = 20% more (more sensitive)
Visual Options:
Hide Depleted Zones: Auto-remove exhausted blocks
Smart Bar Coloring: Color candles based on signal alignment
Zone Colors: Customize buy/sell colors
Label Text Size: Tiny, Small, Normal, Large
POC Settings:
Show POC Lines: Toggle Point of Control display
POC Analysis Levels: 3-10 levels
Line Width: 1-5 pixels
Line Style: Solid, Dashed, or Dotted
Trading Applications
1. Institutional Order Detection - Identify where large players positioned limit orders using Volume Profile POC + Market Structure confluence
2. Support/Resistance Validation - Dual confirmation filters weak levels, highlights high-probability reversal areas
3. Order Flow Imbalance Trading - Trade in direction of aggressive flow using (AGG) markers, fade zones showing absorption
4. Breakout/Breakdown Confirmation - and statuses validate moves through key levels
5. Liquidity Hunting - Track stop-loss clusters, anticipate stop runs based on depletion patterns
6. Entry Refinement - Use POC lines for precise limit placement at "fairest price" within zones
Combined Signal System
HVN Volume Profile × Market Structure Signals:
STRONG BUY: Both engines bullish + structure break up + volume confirmation
BUY: Bullish bias with partial confirmation
WEAK BUY: Early bullish signals
STRONG SELL: Both engines bearish + structure break down + volume confirmation
SELL: Bearish bias with partial confirmation
WEAK SELL: Early bearish signals
Alert Conditions:
Strong Buy/Sell signals (with volume confirmation)
Confluence zone activation (new order block created)
Order block depletion (zone exhausted)
What Makes This Indicator Unique
Industry-Standard Foundation:
Volume Profile POC detection + Market Structure analysis (swing pivots, BOS/MSS) + Point of Control tracking
Unique Innovations:
Dynamic Confluence Algorithm + Aggressive vs Passive Order Flow Decomposition + Adaptive Depletion Thresholds + Real-Time Absorption Detection + Battle Analysis with (AGG) markers + Complete Unified Methodology
Technical Excellence:
Resource-optimized (max 50 zones), comprehensive safety checks, multi-tier labeling, flexible customization
Best Practices
Wait for first touch - No label = untested zone
Watch (AGG) markers - Institutional urgency signal
Trust adaptive depletion - Strong zones failing early = major reversal
Use POC for entries - Best price within zone
Combine higher timeframes - Daily/4H zones strongest
Respect zones - Failed support becomes resistance
Follow battle labels - Contested areas show stop clusters
Adjust sensitivity - Tight ranges = lower %, trending = higher %
Performance Notes
Maximum Active Zones: 50 (automatic cleanup)
Maximum Lines: 400 (POC managed dynamically)
Lookback Cap: 1000 bars for optimization
Updates: All calculations on bar close for confirmed signals

Best Entry Swing MASTER v3 PUBLIC (S.S)Strategy Description (English)
Best Entry Swing MASTER v3 – Quality Mode
The Best Entry Swing MASTER v3 is a structured swing trading and trend-following strategy designed to identify high-probability long and short entries during directional markets.
It combines three core setup types commonly used by momentum and breakout traders:
Breakout (BO)
Pullback Reversal (PB)
Volatility Contraction Pattern (VCP)
The strategy applies multiple layers of confirmation, including multi-EMA trend structure, volatility contraction, volume filters, and an optional market regime filter.
It is suitable for swing trading on higher timeframes (4H, Daily), as well as medium-term trend continuation setups.
Core Concepts
1. Trend Structure
A trend is considered valid when:
Uptrend: Price > EMA20 > EMA50 > EMA100
Downtrend: Price < EMA20 < EMA50 < EMA100
In addition, a simple but effective trend-strength metric is calculated using the percentage spread between EMA20 and EMA100.
This helps avoid signals during sideways or low-volatility environments.
2. Market Regime Filter
The market environment is determined using a higher timeframe benchmark (default: SPY on Daily).
Only long trades are allowed in bullish market conditions
Only short trades in bearish conditions
This significantly reduces false signals in counter-trend conditions.
Entry Logic
Breakout (BO)
A long breakout triggers when:
Price closes above the highest high of the lookback period
Volume exceeds its 20-period average
Trend and market regime confirm
(Optional A+ mode): true volatility contraction is required
Similar logic applies for short breakdowns.
Pullback (PB)
A pullback entry triggers after:
At least two corrective candles
A strong reversal candle (close above previous high for long)
Volume confirmation
Price interacts with EMA20
This structure models classical trend-reentry conditions.
Volatility Contraction Pattern (VCP)
A VCP entry triggers when:
True range contracts over multiple bars
Price holds near the breakout zone
Volume contracts
Trend and market regime are aligned
This setup aims to capture explosive continuation moves.
Quality Modes
The strategy offers two modes:
Balanced Mode
Moderate signal frequency
Broader trend-strength allowance
Suitable for more active traders
A+ Only Mode
Strict confirmation requirements
Only high-quality setups with multiple confluences
Designed to avoid low-probability trades entirely
Risk Management
Risk is managed using an ATR-based stop and target:
Long SL = Close − ATR × 1.5
Long TP = Close + ATR × 3
(Equivalent logic for short positions)
This provides a balanced reward-to-risk profile and avoids overly tight stops.
Early Entry Signals (Optional)
The script offers optional “Early Entry” markers that highlight when a setup is forming but not yet confirmed.
These are not entry signals and are disabled by default for public use.
Intended Use
This strategy is designed for:
Swing trading
Momentum continuation
Trend-following
Multi-day to multi-week trades
It performs best on:
4H
Daily
High-liquidity equities, indices, and futures
Disclaimer
This script is intended for educational and research purposes.
Past performance does not guarantee future results.
Always backtest thoroughly and use appropriate risk management.

Aamir Sniper Pro – Ultimate Trend & Zone SystemAamir Sniper Pro is a comprehensive, all-in-one trading system designed for traders who demand precision without the noise. This script combines a powerful multi-factor consensus engine with dynamic market structure analysis to provide high-probability entry signals.
Unlike cluttered indicators, this system follows a "Clean Chart" philosophy. It removes unnecessary visual distractions (like candle patterns or complex shapes) and focuses strictly on what matters: Trend, Momentum, Volume, and Key Levels.
Key Features:
Sniper Consensus Engine:
The core of the system is a sophisticated algorithm that aggregates data from multiple trend, momentum, and volatility sources.
It calculates a "Consensus Score" (0-100%) to determine the strength of the market direction.
Signals: Provides clear BUY and SELL signals based on this consensus, filtered to reduce false positives in choppy markets.
Dynamic Support & Resistance Zones:
Automatically identifies and plots high-importance Supply and Demand zones.
These zones update dynamically based on pivot strength, helping you visualize where price is likely to bounce or break out.
Wall Detection: The system alerts you when price is actively rejecting a zone (Double Rejection logic).
Institutional Volume Analysis (PVSRA):
Integrated Whale Volume Detection. The candle colors change dynamically to highlight "Climax" or "Rising" volume.
Helps you spot institutional activity and confirm if a move is backed by real money.
Advanced Momentum Filtering (WAE & QQE):
Includes a built-in filter based on Waddah Attar Explosion (WAE) and QQE Mod logic.
Ensures that signals are only taken when there is sufficient market power and volatility, keeping you out of "dead" or ranging markets.
Smart Money Concepts (SMC) & Structure:
Order Blocks & FVGs: Automatically highlights active Order Blocks and Fair Value Gaps (FVG) to use as targets or entry zones.
Liquidity Sweeps: Identifies Buy-Side (BSL) and Sell-Side (SSL) liquidity levels.
BOS (Break of Structure): Confirms trend continuation.
Real-Time Data Dashboard:
A compact, non-intrusive dashboard displays the current Trend Direction, Confidence Score, Volume Status, and structural warnings (like Traps or Walls) at a glance.
How to Use:
Step 1: Wait for a Buy or Sell Signal label.
Step 2: Check the Dashboard Confidence Score (Higher is better).
Step 3: Confirm with Volume (Look for colored candles indicating Whale activity).
Step 4: Ensure price is not hitting a major Opposite Wall/Zone (e.g., Don't buy directly into a Resistance Zone).
Step 5: Use the suggested TP/SL Lines for trade management.
Note: This indicator is designed to be a complete trading assistant. It works on all timeframes but is optimized for scalping and intraday swings.
Settings:
Entry Mode: Choose between "Instant" (Aggressive) or "Retest" (Safe/Sniper) entries.
Filters: Toggle WAE or BOS requirements on/off based on your trading style.
Visuals: Fully customizable colors and dashboard positioning.
Disclaimer: Use this tool to assist your analysis. Always manage your risk responsibly.
