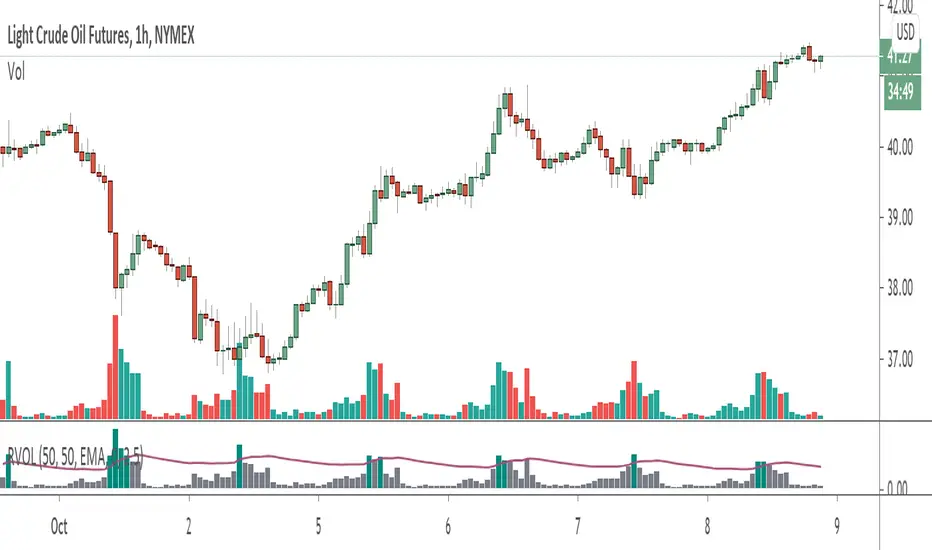
Volume+ (RVOL By Time of Day)This script is an enhanced volume indicator.
It calculates relative volume (RVOL) based on the average volume at that time of day (rather than using a moving average).
For example, using this indicator you can see today’s volume during the first 5-minute candle of the market open compared to the previous day’s volume at the market open. Or you can see today’s volume at the market close during the last 15-minute candle compared to the average of the past 20 days of volume at the market close.
Due to the different quantity of candlesticks in a session between Stocks and Forex/Crypto, I separated those markets into separate settings, making this an all-in-one volume indicator that works on all markets.
Settings:
Stocks
If you set the lookback period to 1 on the 5-minute chart and look at the 9:30am candle for a stock, then the current volume bar will show you what today’s volume is compared to yesterday’s 9:30am 5-minute candle.
If you set the lookback period to 15, then the current volume bar will show you what today’s volume is compared to the average of the last 15 days of 9:30am 5-minute candles.
Max Lookback: 64 Sessions
Stocks
This setting is for traders who want to use this indicator on a timeframe lower than the 5-minute chart.
Due to limitations in how many historical bars PineScript can reference, referencing 1-minute and 3-minute bars requires a lot more historical data so I separated the two to allow the 5-minute+ timeframes to have a longer lookback period.
Max Lookback: 12 Sessions
Forex/Crypto
When you set the script to Forex/Crypto, it does the same thing for stocks but calculates based on a 24-hour period.
So if you set the lookback period to 1 on the 1-hour chart and look at the 11:00am candle for a currency pair, then the current volume bar will show you what today’s volume is compared to yesterday’s 11:00am 1-hour candle.
If you set the lookback period to 10, then the current volume bar will show you what today’s volume is compared to the average of the last 10 days of 11:00am 1-hour candles.
Max Lookback: 17 Sessions
What Doesn’t It Work On?
Because I had to manually calculate how many volume candles to look back per timeframe to get the previous session’s candle, I had to hard-code the math in this script.
That means that this indicator will only work on 1m, 3m, 5m, 15m, 30m, 45m, 1h, 2h, 3h, 4h, Daily and Weekly timeframes. If you try to use it on any other timeframe it will revert to a regular volume indicator.
Why Is It Useful?
Similar to volume profile by price, this gives you a volume profile by time in a way that the default volume indicator does not.
For example, you can use this to determine when a stock has a particularly strong opening drive, or when a currency pair has a weak fake-out leading up to the London open, or for general confirmation on trading signals with time-specific volume information to work with.
Colors
The purple line and the faint gray bar is the RVOL value.
The blue number is the percentage of the current volume bar relative to RVOL.
There are four different bar color settings:
Heatmap – Changes color to be brighter based on higher RVOL
Price – Changes color based on price action (like the default TradingView volume indicator)
Traffic – Changes color based on RVOL percentages (for fast visual cues)
Trigger – Changes color only when the specified alert conditions are met
Heatmap:
Traffic:
Trigger:
Price:
Heatmap:
Turns very bright green at 2.0 RVOL
Turns light green at 1.0 RVOL
Turns normal green at 0.75 RVOL
Turns medium green at 0.5 RVOL
Turns very dark green at 0.25 RVOL
Is gray otherwise.
Price:
Turns red if the price action candle closed bearish.
Turns green if the price action candle closed bullish.
Traffic:
Turns red if RVOL is between 1.0 and 1.5.
Turns orange if RVOL is between 1.5 and 2.0.
Turns dark green if RVOL is between 2.0 and 3.0.
Turns bright green if RVOL is above 3.0.
Is gray otherwise.
Trigger:
Turns teal if any of the given alert conditions in the user settings are met.
Alerts
Alerts are optional. You have to set them like any other indicator, by creating a new alert and selecting this indicator.
If you leave the "Alert At RVOL %" setting at 0, then alerts will only be triggered if the current candle exceeds the 1.0 (100%) RVOL level.
If you change the "Alert At RVOL %" setting then alerts will be triggered if the RVOL percentage (blue number) exceeds your given value. The blue number is a percentage of the average, so if it’s at 0.5, then it’s 50% of the average.
Notes
- This indicator only works with regular time bars. It will not work with range, tick, renko etc.
- This script has lookback limitations due to restrictions on how many historical bars PineScript can reference. The lookback limit varies based on the market type you choose. The more bars required for calculation the lower the lookback limit.
- If you use it on the Daily timeframe the lookback period will count as 1 week. If you use it on the Weekly timeframe the lookback period will count as 1 month. So a Lookback of 3 on the Daily would be 3 weeks of averages, a Lookback of 5 on the Weekly would be 5 months of averages (for that Day of Week or Week number).
- Big thanks to @tb12345 for the idea and for helping to field-testing the indicator!
Relative

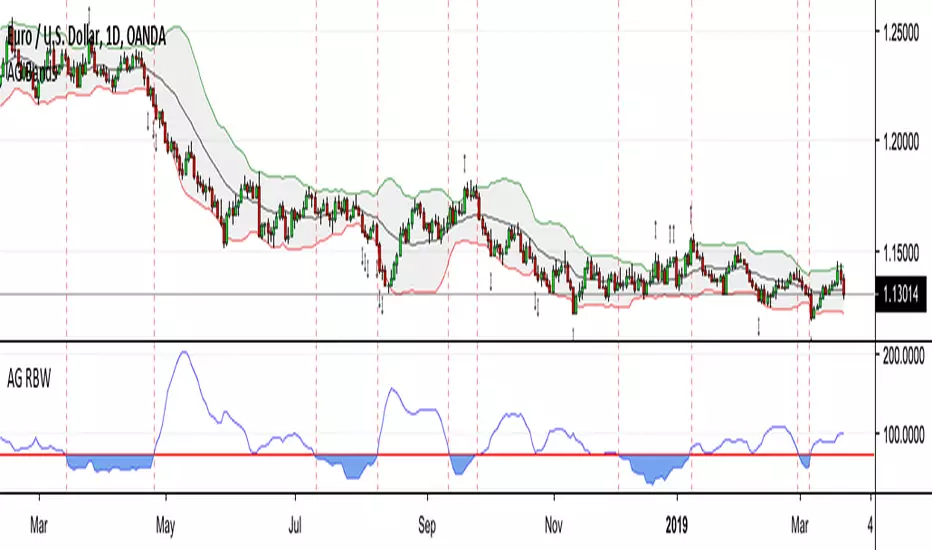
AG Relative BandWidthThis is an indicator that we've been using for a while, very useful for identifying when the market is in a low volatility state. We use the bandwidth of the Bollinger Bands as a proxy for this, but we do something different - we ask the question of "relative to what?".
Whereas typical Bollinger BandWidth indicators give values only applicable for that particular asset, the normalised nature of our Relative BandWidth indicator means that it works and be inferred the same across all assets and timeframes. A really handy tool!
"After periods of low volatility come periods of high volatility" is a well-known theory, and this indicator helps to quickly and easily identify when markets are in low volatility states. Another name for the information our indicator shows is known as the "Bollinger squeeze". Trading breakouts of this squeeze in Bands can be a profitable strategy, given one can filter the false breakouts adequately.
I have shown examples of when the indicator was showing low volatility, take note of what the price action and the width of the Bollinger Bands are doing.
Every parameter is editable, so feel free to play around with the settings. The default settings are what we have used for a long time and have worked well.
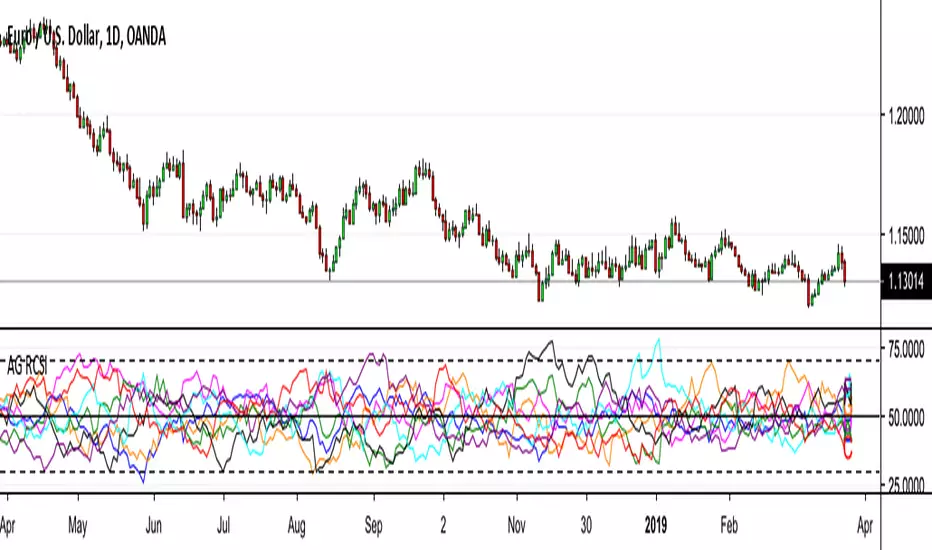
AG Relative Currency Strength IndicatorThis is an indicator that we've been using for a while to pinpoint currencies that are strong/weak. By knowing which currencies are strong and weak, you can focus your attention on the currency pairs that are actually moving, or plan ahead when researching trades.
This indicator gives the Relative Currency Strength, on any timeframe, for every major currency: USD, EUR, GBP, JPY, CHF, CAD, AUD, and NZD.
The indicator includes labels if you need them (you can toggle on/off - default=off), but you will quickly get used to which colour line represents which currency.
You can also choose to show/hide any currency, for isolation or clarity, e.g. only showing USD, EUR and JPY if that's all you're interested in.
Note: due to how much data is being pulled in and processed, this indicator does take a while to load.
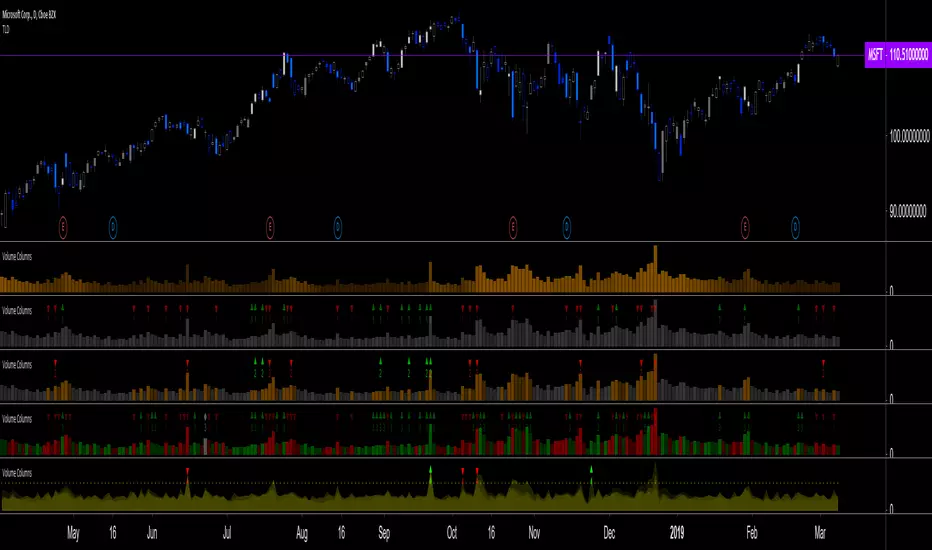
Volume Columns w. Alerts (V) [LucF]These are volume columns on steroids, for serious volume users. You can use the indicator to show volume columns or relative volume. You can define alerts using numerous conditions in both column and relative modes simultaneously. Multiple coloring schemes allow you to reveal volume columns in a much more useful light than the two-color standard.
Features
Seven Color Schemes
Plain gray.
Different color for columns above average MA.
Standard green and red.
Color gradient using the relative position of MA (default mode).
The first 3 schemes allow for highlighting increasing volume columns.
A gray column in an otherwise colored scheme indicates no change in price.
Two Modes
Column Mode: In this mode you can show the volume MA and mask the columns under it. The standard is an EMA because I think it better suits volume’s quick changes, but you can change it to the usual simple MA, as well as define its length.
Relative Volume: Calculations have been kept rudimentary. Current volume is simply compared to the previous bar’s volume. In order to compensate for this, a multiple area mode also compares current volume to 5, 15, 50 and 200 periods MAs. You can choose to view only the main relative volume value. Relative volume is capped in order to prevent the loss of detail caused by wild increases. The default cap is 10, but you can define your own. Spikes that are capped show a dot at their top. A separate threshold (its default value is the standard 2) is included for relative volume; it is used to generate relative volume markers.
Four Markers
Bumps (marker 1): A bump occurs when an increasing volume column is above its MA and the candle’s close is above/below the previous close.
Double Bumps (marker 2): A double bump occurs when 2 bumps are present in the last 3 bars.
Volume Over MA (marker 3): Triggers whenever volume is above MA. This is the noisiest of the markers.
Relative Volume (marker 4): This event occurs when relative volume crosses the pre-defined threshold.
You can choose to only show long or short markers.
Two Backgrounds
You can choose to highlight the background on bumps and double bumps.
Alerts
You can define alerts on any combination of markers you configure. After defining the markers you want the alert to trigger on, make sure you are on the interval you want the alert to be monitoring at, then create the alert, select V, use the default “Configured Markers” alert condition and choose your triggering window (usually “Once Per Bar Close”). Once the alert is created, you can change the indicator's inputs with no effect on the alert.
No worthwhile price movement exists without volume. It thus makes sense to define alerts on volume if you want to monitor markets. I use the markers to define two types of alerts. For general market scanning, I use markers 2 and 4 on high time frames. When I have identified a good opportunity for entry and am waiting for confirmation, I will often setup a custom alert for that market at a shorter time interval using markers 1 and 4.
Notes
Until we have access to delta volume information on TradingView, this indicator tries to get the most out of volume columns without using security calls at inside intervals to get more resolution on volume, because it slows things down considerably.
The chart shows different combinations of color schemes and markers, along with my TLD indicator on the chart.
Volume+ (RVOL/Alerts)This indicator colors the volume bars based on any of the three follow criteria:
- Volume Amount
- RVOL (Relative Volume)
- Lookback (Highest Over Period)
You can use one, two or all three of these settings at the same time.
You can also set alerts with this indicator. The script will trigger an alert whenever any of the three specified flags are triggered.
RVOL is calculated as: Volume divided by Moving Average value. You can change the moving average period (and type) in the settings.
Dorsey InertiaThis indicator was originally developed by Donald Dorsey (Stocks & Commodities, V.13:9 (September, 1995): "Refining the Relative Volatility Index").
Inertia is based on Relative Volatility Index (RVI) smoothed using linear regression.
In physics, inertia is the tendency of an object to resist to acceleration. Dorsey chose this name because he believes that trend and inertia are related and that it takes more effort and energy to reverse the direction of a stock or market than to keep it in the same direction. He argues that the volatility is the simplest and most accurate measure of inertia.
When the indicator is below 50, it signals bearish market sentiment and when the indicator is above 50 it signals a bullish trend.
Good luck!

Weekly & Daily Percantage Price OscillatorMy first script.
By Vitali Apirine. Technical Analysis of Stocks & Commodities ( February 2018, Vol.36 Issue 2). Thank you.

Mansfield Relative Strength indicatorUse this indicator to compare how security is performing in compare with preferred index (SPX by default).
> 0 outperforming
< 0 underperforming
Works best for weekly, but can be applied to monthly and daily charts. It will be rather useless to use it in smaller timeframes
Apply it to SPX, industry index, sector index or other security in similar sector

RSI Divergence Smoothed with Signal Line and Power ZonesThis Indicator plots Regular and Hidden Divergences lines for an RSI smoothed by an EMA and for its Signal Line
The RSI can be set to change colour with direction or can be set as single colour
Colour Changing RSI helps when trading Multiple Timeframes as you can look for confluence in the direction of RSI
The divergence script is thanks to @RicardoSantos, I've just adjusted it to suite my indicator
Remember that divergences work best when traded with the trend or very late in a trend when going against the trend
I have also added a Colour Changing Signal Line & Hima Reddy's Power Zones so now you can also
Take full advantage of trading; signal line crosses, 50 crosses and Power Zone RSI support and resistance

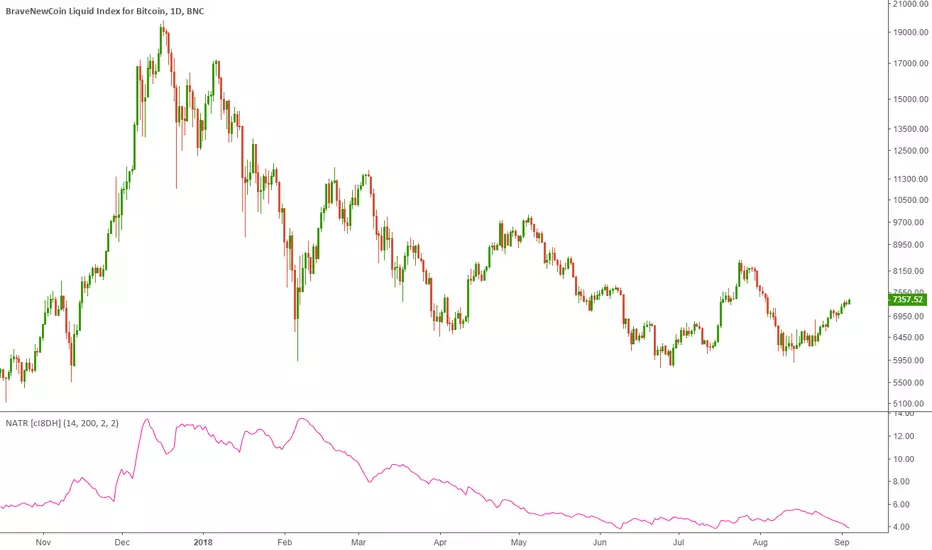
Normalized Average True Range (NATR) (Volatility) [cI8DH]As you can see in the chart below, regular ATR is not useful for long term analysis. Normalizing it, fixes the issue. This indicator can be used to measure absolute volatility. It has a built-in stochastic as well for relative volatility. ATR counts high and low in the equation unlike Bolinger Band Width.
Stochastic:
Relative Strength Index Multi Time frame RSII am always checking RSI on 1hr, 4Hr and Day RSI.
Having to switch is annoying so wrote this little script to show RSI on upto 5 time frames.
The green bold line is the current time frame, and you can change the other 4 to what you prefer.
If one time frame is over sold or overbought you can change the back to indicated a buy or sell etc.
Anyway thought I would share it.
If you like it, please click the like button.

FofT - 1h, 4h, and Daily RSI in any time intervalView multiple-timeframe RSIs in a single interval. All RSI lines stay the same no matter your preference to trade in 15m, 1h, 3h…. etc.
Default RSI length is 7 (can be changed in the format settings)
All RSIs are smoothed out in default (can be changed in the format settings)
Line colors
5m RSI - white (disabled in default)
15m RSI - Lime (disabled in default)
1h RSI - Yellow
4h RSI - Red
D RSI - Blue
Overbought and Oversold threshold colors
>70 (grey) - overbought
>80 (orange) - highly overbought
>90 (pink) - extremely overbought
=50 (black dotted lines) - equilibrium
<30 (grey) - oversold
<20 (orange) - highly oversold
<10 (pink) - extremely oversold
How to add to chart
* Click on "Add to Favorite scripts" in the bottom right
* While in chart view click on "/" button on your keyboard or click on the Indicators button on the top tool bar
* Go to Favorites Tab and click on this indicator
Other interval RSIs will be added based on request. Feel free to leave any questions or requests in the comment section below.
If you find this script useful, please like and share.

Volume/Rsi Overbought/oversoldI present you my last indicator. A volume indicator that indicates overbought and oversold based on the rsi, I chose the rsi because the most used surment, this indicator allows you to identify the overbought and oversold areas of the rsi with the colors blue (oversold) and orange (overbought ) on the volume indicator! Hoping that you are useful
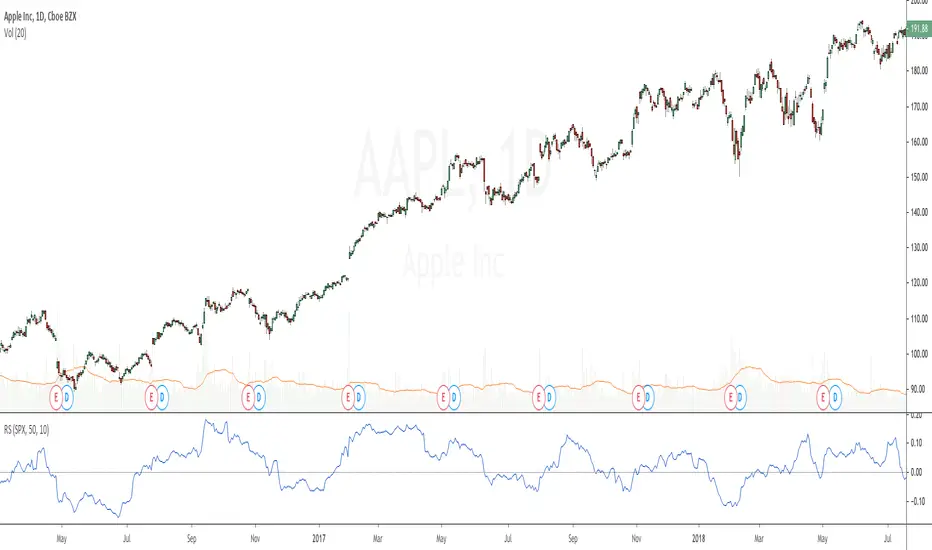
Relative StrengthRelative strength is a ratio between two assets, most often a stock and a market average (index). This implementation uses the method described here and the second method described here to calculate its value: "To calculate the relative strength of a particular stock, divide the percentage change over some time period by the percentage change of a particular index over the same time period". This indicator oscillates around zero. If the value is greater than zero, the investment has been relatively strong during the selected period; if the value is less than zero, the investment has been relatively weak. The period and the comparative symbol can be set in the settings for the indicator (the defaults are 50 and SPX), there you can also find an option to turn on a moving average.
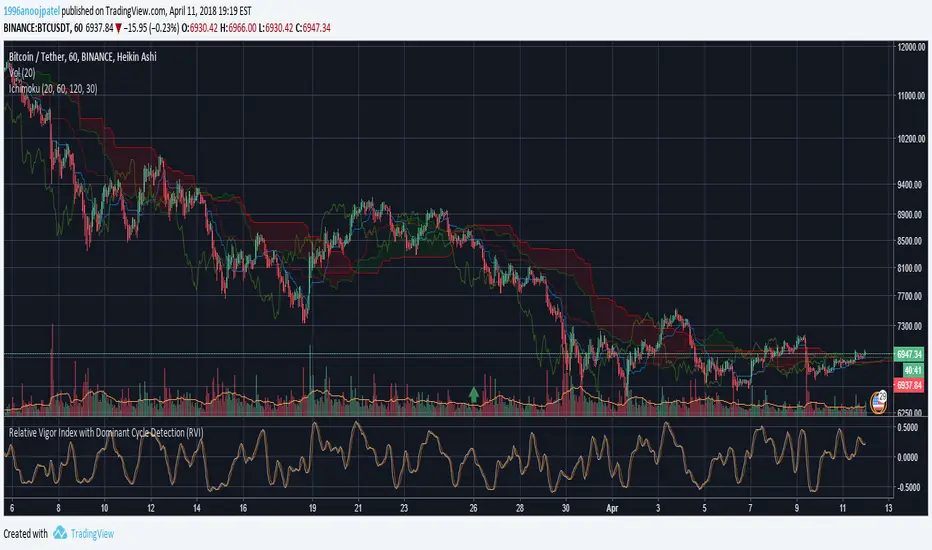
Relative Vigor Index with Dominant Cycle Detection (RVI)Relative Vigor Index with Dominant Cycle Detection. As Ehler's mentioned, fixed length look back is inherently flawed when it is possible to extract a length from a dominant price cycle. may be less effective if signal to noise ratio is greater than 2, but that usually would not happen at >5m candles, and honestly shouldn't be looking at RV(igor)I when price is moving sideways.
Read just like an RVGI, but adjusted to the current time frame. To reduce noise, changing to heiken ashi will help with signals as well. Let me know if there are improvements!
Made for JD, the OG.
Rapid RSIRapid RSI indicator script. This indicator was originally developed by Ian Copsey (Stocks & Commodities V. 24:10 (16-23): Forex Focus).
Relative Momentum IndexRelative Momentum Index indicator script. This indicator was originally developed by Roger Altman (Stocks & Commodities V. 11:2 (57-60)).
RMI with momentum period of 1 will be equal to an RSI when they have the same period and source price.

Normalized Relative Vigor IndexThis is the Relative Vigor Index indicator just multiplied by 100 to have non-zero integer part

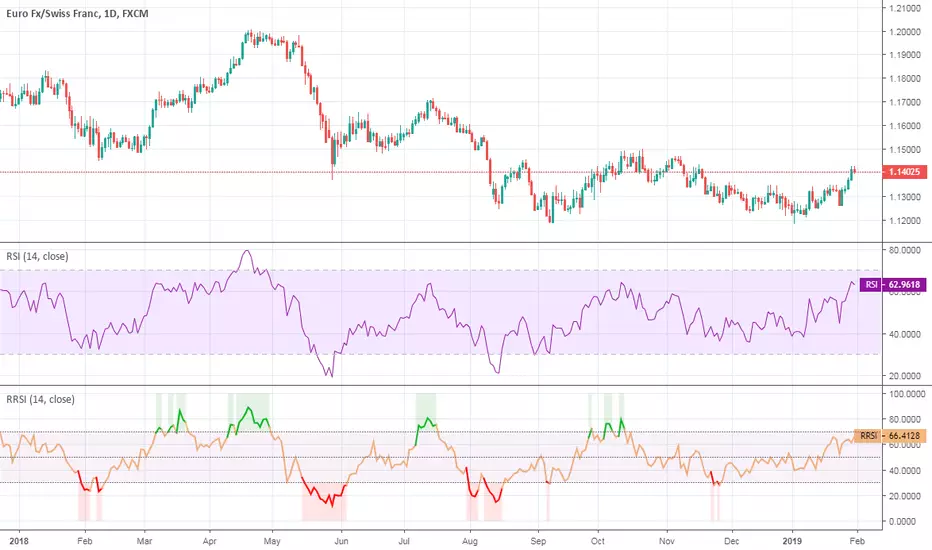
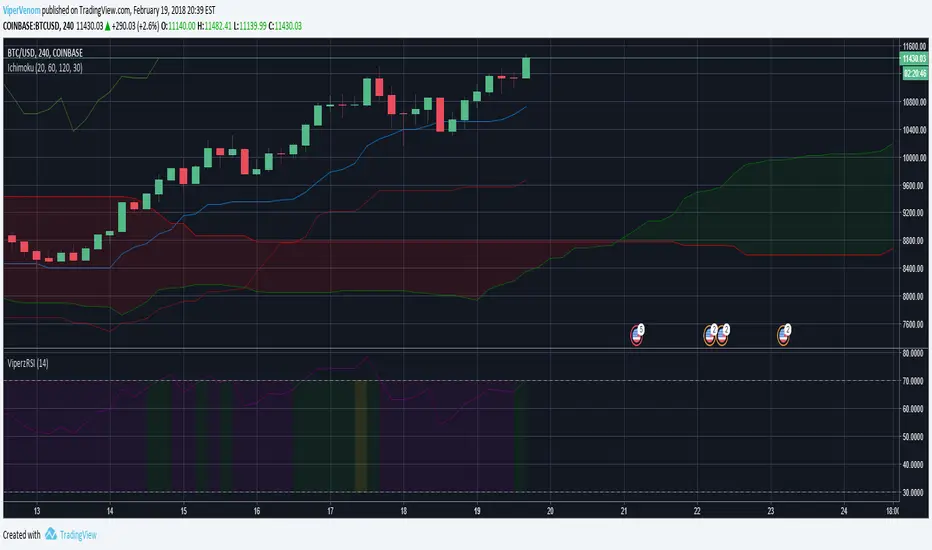
Viperz RSI v1.2The color of the RSI inner bands will change from Purple to Green if RSI >70 and they will change to yellow if RSI >75. Nothing else has been changed from the standard RSI. Please understand I'm testing how publishing indicators works in Trading View. I have only done a minor adjustment to the RSI indicator, but I plan to do much more once I fully understand the publishing process. Thank you. Hope you enjoy. :)
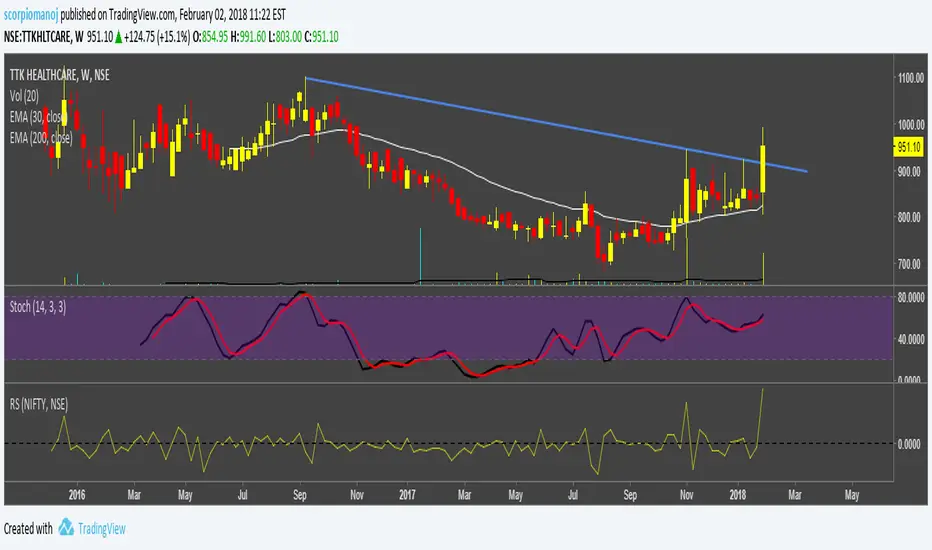
STAN WEINSTEIN RS INDEX WITH NIFTYThis is an indicator for Indian markets.
It shows the relative strength of particular stock to the underlying index.
The concept of this indicator is well described in Stan Weinstein's book.
Mansfield Relative Strength Multi TrendThis indicator is an advanced studie of 'Mansfield Relative Strength Trend' indicator
Since it is too time consuming to constantly change the index, I have developed a multi-index indicator.
The default order of the indexes is:
1. S&P 500
2. Dow Jones Industrial Average
3. Nasdaq Composite
4. NYSE Composite
5. DAX
You can change all indexes in the settings if you want.
*********************************
'Stan Weinstein' developed an indicator called Relative Strength which compares the relative strength of a stock with the associated index.
This indicator combines the relative strength with Weinstein's stage analysis.
The indiacator was made for weekly stock charts only!
BUY & HOLD Conditions (green):
1. Mansfield Relative Strength is above the zero line
2. Price is above the Simple Moving Average (30)
3. Simple Moving Average (30) is rising
SELL & HOLD Conditions (red):
1. Mansfield Relative Strength is below the zero line
2. Price is below the Simple Moving Average (30)
3. Simple Moving Average (30) is falling
It is recommended to end the trade when the trend changes.
*********************************
Please always remember, there is no holy grail indicator!
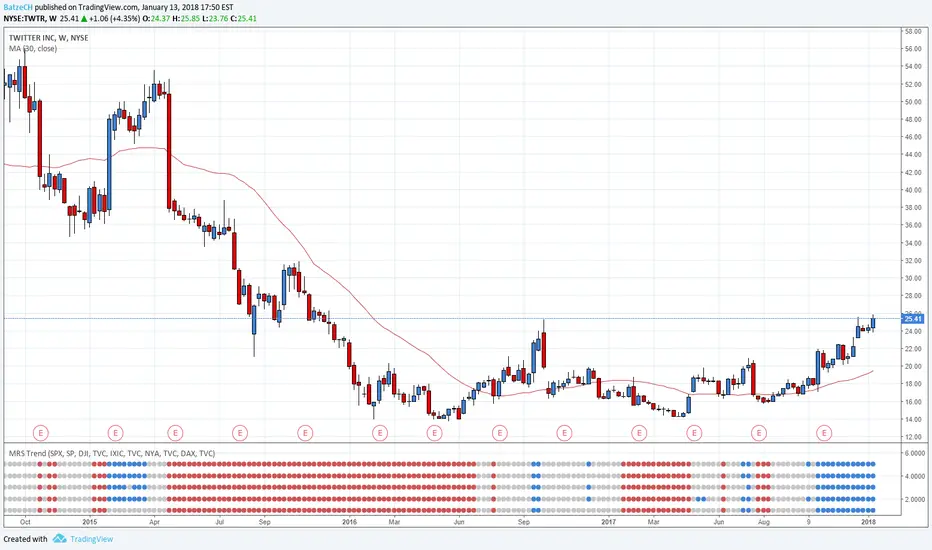
Mansfield Relative Strength Trend'Stan Weinstein' developed an indicator called Relative Strength which compares the relative strength of a stock with the associated index (in this case the S&P 500).
This indicator combines the relative strength with Weinstein's stage analysis.
The indiacator was made for weekly stock charts only!
BUY & HOLD Conditions (green):
1. Mansfield Relative Strength is above the zero line
2. Price is above the Simple Moving Average (30)
3. Simple Moving Average (30) is rising
SELL & HOLD Conditions (red):
1. Mansfield Relative Strength is below the zero line
2. Price is below the Simple Moving Average (30)
3. Simple Moving Average (30) is falling
It is recommended to end the trade when the trend changes.
Default index is S&P 500, but you can change the index in the settings if you want.
Please always remember, there is no holy grail indicator!
