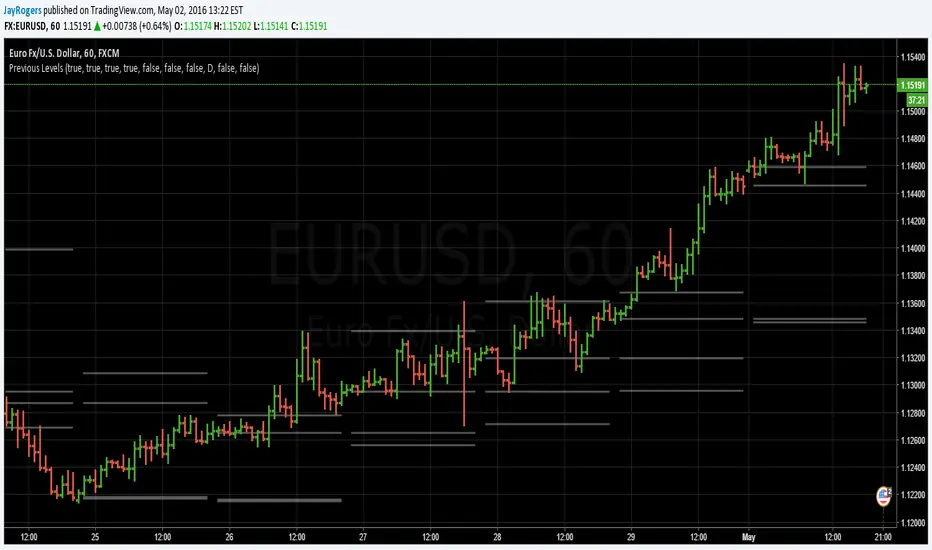
Previous OHLC LevelsQuick dirty code for personal use. Plots previous OHLC levels based on a selected time-frame on the chart.
Not bad if you want to see different time-frame levels.
Fill function can serve to highlight the daily range (high-low or open-close) on non-standard charts
Uses base code from JayRogers
Previous


Previous hourly low-highA simple indication of the previous hourly low and high _ (Complete version) _

Range: OHLC vs Previous OHLCThis will plot your choice of OHLC (or any of the averaging choices) of the current candle compared to the previous candle.
For example if you choose "high" for the input and set the chart to daily, you'll see the currently daily high vs the previous daily high.
Green candle represent a higher high and the length of the candle represents how much higher.
Red candles represent a lower high than the previous day and the length is by how much lower.
This indicator is pretty straight forward, look for me to build on this with something a little more elaborate in the near future.

FIRST 5-MINUTES ZONE AND HI-LO BRKOUTS..!FIRST 5-MINUTES ZONE
--------------------------------
This script displays the first 5-Minutes high and low range zone and shades in gray color for identification of the zone.
HIGH - LOW BREAKOUT
----------------------------
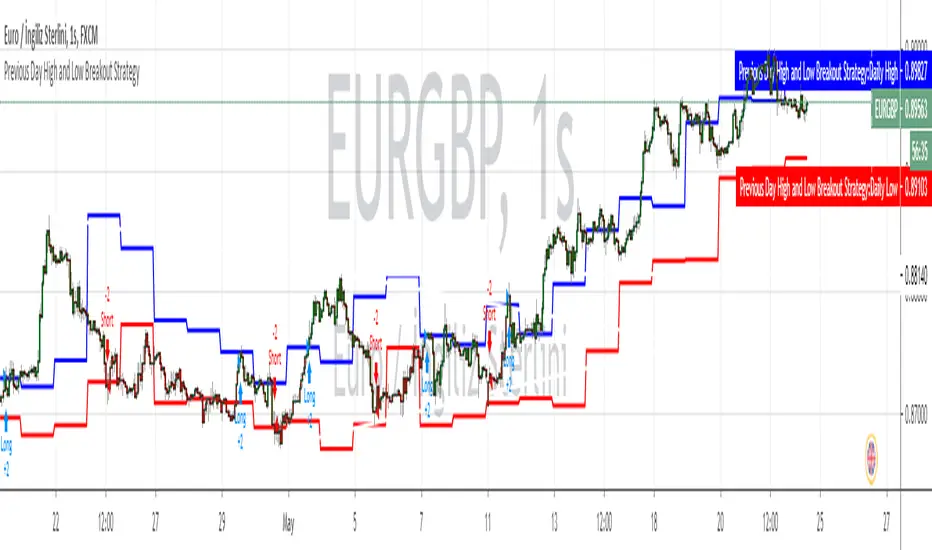
As we all know that a stock's best breakout level is its previous day's high or low. Hence I designed the script to automatically draw a line when the LTP is near or crossing Previous day's high or Low price, so that we can be sure in taking trading decisions.
And added 30-EMA also
PR.HIGH BREAKOUT
------------------------
PR.LOW BREAKOUT
------------------------
- hope this may be a little help for you traders for taking decisions.
- HAPPY WEALTHY TRADING
cheers
SANJAY RAMANATHAN

Previous Period LevelsDescription:
It's just levels of previous periods, with the inclusion of 4 hour and and month. Nothing special.
Setup:
Should be mostly self explanatory... but selecting either the 4 hour or month check boxes will override the dropdown selection.
Checking both the 4 hour and month boxes together will cause it to default to whatever has been selected in the dropdown.