Adaptive Risk Management [sgbpulse]1. Introduction:
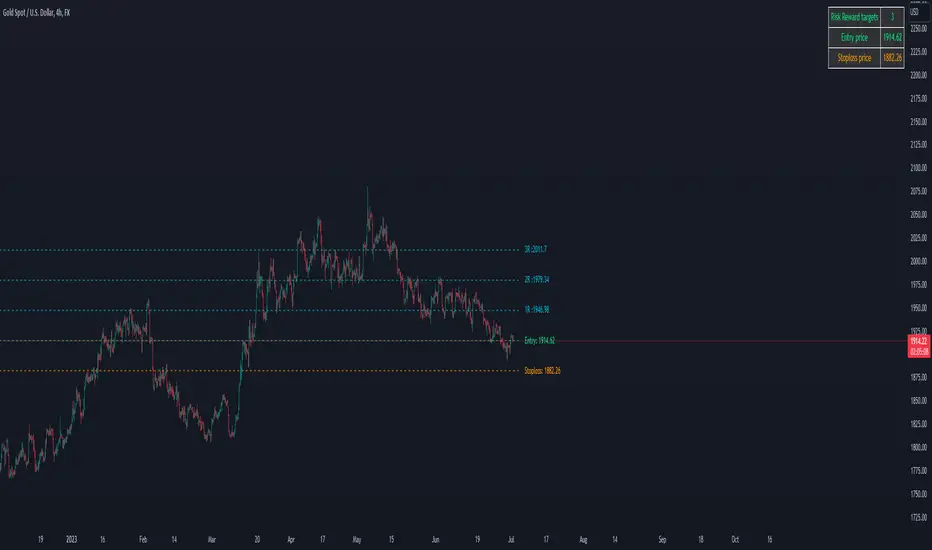
Adaptive Risk Management is an advanced indicator designed to provide traders with a comprehensive risk management tool directly on the chart. Instead of relying on complex manual calculations, the indicator automates all critical steps of trade planning. It dynamically calculates the estimated Entry Price , the Stop Loss location, the required Position Size (Quantity) based on your capital and risk limits, and the three Take Profit targets based on your defined Reward/Risk ratios. The indicator displays all these essential data points clearly and visually on the chart, ensuring you always know the potential risk-reward profile of every trade.
ARM : The A daptive R isk M anagement every trader needs to ARM themselves with.
2. The Critical Importance of Risk Management
Proper risk management is the cornerstone of successful trading. Consistent profitability in the market is impossible without rigorously defining risk limits.
Risk Control: This starts by setting the maximum risk amount you are willing to lose in a single trade (Risk per Trade), and limiting the total capital allocated to the position (Max Capital per Trade).
Defining Boundaries (Stop Loss & Take Profit): It is mandatory to define a technical Stop Loss and a Take Profit target. A fundamental rule of risk management is that the Reward/Risk Ratio (R/R) must be a minimum of 1:1.
3. Core Features, Adaptivity, and Customization
The Adaptive Risk Management indicator is engineered for use across all major trading styles, including Swing Trading, Intraday Trading, and Scalping, providing consistent risk control regardless of the chosen timeframe.
Real-Time Dynamic Adaptivity: The indicator calculates all risk management parameters (Entry, Stop Loss, Quantity) dynamically with every new bar, thus adapting instantly to changing market conditions.
Trend Direction Adjustment: Define the analysis direction (Long/Uptrend or Short/Downtrend).
Intraday Session Data Control: Full control over whether lookback calculations will include data from Extended Trading Hours (ETH), or if the daily calculations will start actively only from the first bar of Regular Trading Hours (RTH).
Status Validation: The indicator performs critical status checks and displays clear Warning Messages if risk conditions are not met.
4. Intuitive Visualization and Real-Time Data
Dynamic Tracking Lines: The Entry Price and Stop Loss lines are updated with every new bar. Crucially, the length of these lines dynamically reflects the calculation's lookback range (e.g., the extent of Lookback Bars or the location of the confirmed Pivot Point), providing a visual anchor for the calculated price.
Risk and Reward Zones: The indicator creates a graphical background fill between Entry and Stop Loss (marked with the risk color) and between Entry and the Reward Targets (marked with the reward color).
Essential Information Labels: Labels are placed at the end of each line, providing critical data: Estimated Entry Price, Stock/Contract Quantity (Quantity), Total Entry Amount, Estimated Stop Loss, Risk per Share, Total Financial Risk (Risk Amount), Exit Amount, Estimated Take Profit 1/2/3, Reward/Risk Ratio 1/2/3, Total Reward 1/2/3, TP Exit Amount 1/2/3.
4.1. Data Window Metrics (16 Full Series)
The indicator displays 16 full data series in the TradingView Data Window, allowing precise tracking of every calculation parameter:
Entry Data: Estimated Entry, Quantity, Entry Amount.
Risk Data (Stop Loss): Estimated Stop Loss, Risk per Share, Risk Amount, Exit Amount.
Reward Data (Take Profit): Estimated Take Profit 1/2/3, Reward/Risk Ratio 1/2/3, Total Reward 1/2/3, TP Exit Amount 1/2/3.
4.2. Instant Tracking in the Status Line
The indicator displays 6 critical parameters continuously in the indicator's Status Line: Estimated Entry, Quantity, Estimated Stop Loss, Estimated Take Profit 1/2/3.
5. Detailed Indicator Inputs
5.1 General
Focused Trend: Defines the analysis direction (Uptrend / Downtrend).
Max Capital per Trade: The maximum amount allocated to purchasing stocks/contracts (in account currency).
Risk per Trade: The maximum amount the user is willing to risk in this single trade (in account currency).
ATR Length: The lookback period for the Average True Range (ATR) calculation.
5.2 Intraday Session Data Control
Regular Hours Limitation : If enabled, all daily lookback calculations (for Entry/Stop Loss anchor points) will begin strictly from the first Regular Trading Hours (RTH) bar. This limits the lookback range to the current RTH session, excluding preceding Extended Trading Hours (ETH) data. Only relevant for Intraday charts. Default: False (Off)
5.3 Entry Inputs
Entry Method: Selects the entry price calculation method:
Current Price: Uses the closing price of the current bar as the estimated entry point (Market Entry).
ATR Real Bodies Margin :
- Uptrend: Calculates the Maximum Real Body over the lookback period + the calculated safety margin.
- Downtrend: Calculates the Minimum Real Body over the lookback period - the calculated safety margin.
ATR Bars Margin :
- Uptrend: Calculates the Maximum High price over the lookback period + the calculated safety margin.
- Downtrend: Calculates the Minimum Low price over the lookback period - the calculated safety margin.
Lookback Bars: The number of bars used to calculate the extremes in the ATR-based entry methods (Relevant only for ATR Real Bodies Margin and ATR Bars Margin methods).
ATR Multiplier (Entry): The multiplier applied to the ATR value. The result of the multiplication is the calculated safety margin used to determine the estimated Entry Price.
5.4 Risk Inputs (Stop Loss)
Risk Method: Selects the Stop Loss price calculation method.
ATR Current Price Margin :
- Uptrend: Entry Price - the calculated safety margin.
- Downtrend: Entry Price + the calculated safety margin.
ATR Current Bar Margin :
- Uptrend: Current Bar's Low price - the calculated safety margin.
- Downtrend: Current Bar's High price + the calculated safety margin.
ATR Bars Margin :
- Uptrend: Lowest Low over lookback period - the calculated safety margin.
- Downtrend: Highest High over lookback period + the calculated safety margin.
ATR Pivot Margin :
- Uptrend: The first confirmed Pivot Low point - the calculated safety margin.
- Downtrend: The first confirmed Pivot High point + the calculated safety margin.
Lookback Bars: The lookback period for finding the extreme price used in the 'ATR Bars Margin' calculation.
ATR Multiplier (Risk): The multiplier applied to the ATR value. The result of the multiplication is the calculated safety margin used to place the estimated Stop Loss. Note: If set to 0, the Stop Loss will be placed exactly at the technical anchor point, provided the Minimum Margin Value is also 0.
Minimum Margin Value: The minimum price value (e.g., $0.01) the Stop Loss margin buffer must be.
Pivot (Left / Right): The number of bars required on either side of the pivot bar for confirmation (relevant only for the ATR Pivot Margin method).
5.5 Reward Inputs (Take Profit)
Show Take Profit 1/2/3: ON/OFF switch to control the visibility of each Take Profit target.
Reward/Risk Ratio 1/ 2/ 3: Defines the R/R ratio for the profit target. Must be ≥1.0.
6. Indicator Status/Warning Messages
In situations where the Stop Loss location cannot be calculated logically and validly, often caused by a mismatch between the configured Focused Trend (Uptrend/Downtrend) and the actual price action, the indicator will display a warning message, explaining the reason and suggesting corrective action.
Status Message 1: Pivot reference unavailable
Condition: The Stop Loss is set to the "ATR Pivot Margin" method, but the anchor point (Pivot) is missing or inaccessible.
Message Displayed: "Pivot reference unavailable. Wait for valid price action, or adjust the Regular Hours Limitation setting or Pivot Left/Right inputs."
Status Message 2: Calculated Stop Loss is unsafe
Condition: The calculated Stop Loss is placed illogically or unsafely relative to the trend direction and the Entry price.
Message Displayed: "Calculated Stop Loss is unsafe for current trend. Wait for valid price action or adjust SL Lookback/Multiplier."
7. Summary
The Adaptive Risk Management (ARM) indicator provides a seamless and systematic approach to trade execution and risk control. By dynamically automating all critical trade parameters—from Entry Price and Stop Loss placement to Position Sizing and Take Profit targets—ARM removes emotional bias and ensures every trade adheres strictly to your predefined risk profile.
Key Benefits:
Systematic Risk Control: Strict enforcement of maximum capital allocation and risk per trade limits.
Adaptivity: Dynamic calculation of prices and quantities based on real-time market data (ATR and Lookback).
Clarity and Trust: Clear on-chart visualization, precise data metrics (16 series), and unambiguous Status/Warning Messages ensure transparency and reliability.
ARM allows traders to focus on strategy and analysis, confident that their execution complies with the core principles of professional risk management.
Important Note: Trading Risk
This indicator is intended for educational and informational purposes only and does not constitute investment advice or a recommendation for trading in any form whatsoever.
Trading in financial markets involves significant risk of capital loss. It is important to remember that past performance is not indicative of future results. All trading decisions are your sole responsibility. Never trade with money you cannot afford to lose.
Positionsize

JRien Position Sizer (Real-Time) — ATR / LOD / Manual % $ RiskReal time position sizing based on real time potential entry price and calculations based on max risk. Usable on multi timeframes. You can also input manually your entry and stop based on your own discretion. I usually use a spreadsheet to calculate these things but wanted a way to see this in real time without needing to type out Entry, ATR, Stops, etc - TradingView has all this information already so why not just have it automatically update!
4 Stop Types:
ATR Based Stop
Based on the stocks ATR (mainly used on daily charts but options if you use other timeframe ATR) and uses a multiple of that ATR to base the plot. Many traders use less than 0.6ATR to base your stop as a rule and max entry 60% from LOD as another rule.
Manual Percent Stop
You're able to input your desired % stop and this will dynamically move with the current entry (last) price.
Manual Price Stop
You're able to input your desired price $ stop and this will dynamically move with the current entry (last) price.
Low of Day (LOD) Stop
Calculates your position based on if you were to have your stop at LOD and also calculates % of ATR away from LOD. Many swing traders use LOD for their stop so this moving dynamically with the current LOD and automatically calculating this is useful.
Calculates:
Entry (Last)
ATR (14 | D)
ATR Stop Price
Manual Stop Percent
Manual Stop Price
Final Stop
Risk per Share ($)
Shares by Risk
Shares by Stake
Final Shares
Final Position Cost
Potential Stop Loss
LOD Price
Loss at LOD
LOD Risk % of Account
LOD dist as % of ATR
Customizable table - can hide items, change color and size.
Also an option to hide historical data - so plots start at market open!
Let me know if any calculations are incorrect, good luck!
- JRien

Multi-Entry Fibonacci CalculatorMulti-Entry Fibonacci Calculator
This tool is a comprehensive trade calculator designed for discretionary traders who plan to scale into positions. It automates the complex task of position sizing across up to three separate entries while ensuring your total risk exposure remains fixed. By inputting your desired entry, stop loss, and initial profit target levels, the script calculates the precise quantity for each entry and provides a dynamic, real-time view of your trade's vitals.
The primary goal of this script is to allow for disciplined risk management in multi-entry trade plans. Whether you are averaging into a position or adding on pullbacks, this tool ensures your total predefined risk is never exceeded, even if all entries are filled.
Key Features
Multi-Entry Position Sizing: Automatically calculates the share/contract size for up to three entries based on their distance from the stop loss and user-defined weights.
Fixed Risk Management: Define your total risk as a percentage of your account. The script ensures that a full stop-out across all filled entries will result in a loss equal to this predefined amount.
Dynamic Take Profit: The take-profit level automatically adjusts based on your current average entry price to preserve the original target profit amount in dollars.
Real-Time Info Panel: A customizable on-chart panel displays all critical trade data, including current quantity, average price, projected P&L, and trade status.
Visual Trade Plan: Plots all your defined price levels (entries, stop loss, take profit) directly on the chart with informative labels.
Trade State Tracking & Alerts: The script monitors the price and will trigger alerts when entries are hit, or when the stop loss or take profit levels are reached.
How to Use
Configure Account & Risk: In the settings, enter your "Account Size" and the "Risk per Trade (%)" you are willing to take on the entire position.
Set Trade Direction: Choose either "LONG" or "SHORT".
Input Price Levels: Manually enter the prices for your entries (Entry 1, 2, 3), your "Stop Loss Price," and an "Initial TP Reference." The initial TP is used to calculate the target profit in dollars.
Distribute Position Weight: Assign weights to each entry (e.g., 50% for Entry 1, 30% for Entry 2, 20% for Entry 3). The total should sum to 100.
Monitor the Trade: Use the info panel and on-chart visuals to track the trade's progress. The script will show your average price as entries are filled and update the dynamic take-profit level accordingly.
Understanding the Calculations
Weighted Position Sizing: The script calculates sizes for each entry so that if all entries are filled and the stop loss is hit, your total loss will equal your predefined risk amount. It intelligently allocates size based on the distance of each entry from the stop loss and the weight you assign to it.
Dynamic Take Profit: The "Initial TP Reference" is used only to calculate a target profit in dollars based on your first entry's size. The script then calculates a dynamic TP line on your chart. This line adjusts based on your average entry price as positions are filled, ensuring that if price reaches this level, you will realize your original target dollar profit, regardless of how many entries were filled.
On-Chart Elements
Price Lines: Blue lines for entries, a red line for the stop loss, and a green line for the dynamic take profit.
Labels: Display the calculated quantity for each entry, the total risk amount at the stop loss, and the target profit amount at the take profit.
Average Price: Yellow circles plot your live average entry price as the position is built.
Info Panel: A comprehensive table showing live trade status, current quantity, average price, and projected profit/loss. The panel changes color to green on a TP hit and red on an SL hit.

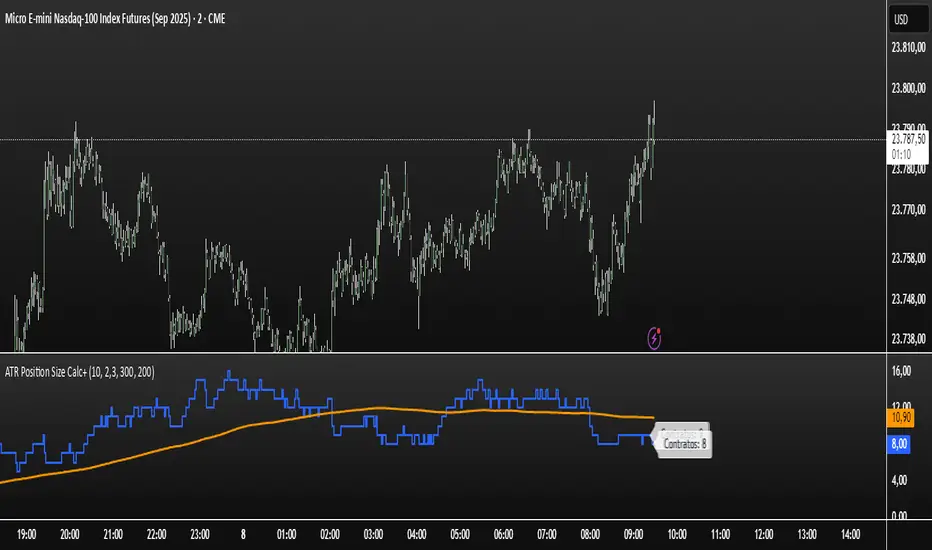
Position Sizing Calculator (Real-Time) - Futures Edition█ SUMMARY
The following indicator is a Position Sizing Calculator based on Average True Range (ATR), originally developed by market technician J. Welles Wilder Jr., intended for real-time trading.
This script utilizes the user's account size, acceptable risk percentage, and a stop-loss distance based on ATR to dynamically calculate the appropriate position size for each trade in real time.
█ BACKGROUND
Developed for use on the Micro E-mini Nasdaq-100 futures (MNQ), this script provides traders with continuously updated dynamic position sizes. It enables traders to instantly determine the exact number of contracts to use when entering a trade while staying within their acceptable risk tolerance.
This real-time position sizing tool helps traders make well-informed decisions when planning trade entries and calculating maximum stop-loss levels, ultimately enhancing risk management.
█ USER INPUTS
Trading Account Size: Total dollar value of the user's trading account.
Acceptable Risk (%): Maximum percentage of the trading account that the user is willing to risk per trade.
ATR Multiplier for Stop-Loss: Multiplier used to determine the distance of the stop-loss from the current price, based on the ATR value.
ATR Length: The length of the lookback period used to calculate the ATR value.
Show Target Risk Row: Toggle to hide/show the Target Risk Row
SL Levels Display: Option to see Both, Long Only, Short Only, or None of the Stop Loss Level Values.
Contract Point Value ($): Point value per contract. Tooltip highlights common values.
Tick Size: Minimum Price Movement (Default set to 0.25)
Minimum Contracts: Override the Minimum Contracts per trade to a user selected value.
(May Exceed User's Target Risk)

RPT Position Sizer🎯 Purpose
This indicator is a position sizing and stop-loss calculator designed to help traders instantly determine:
How many shares/contracts to buy,
How much risk (₹) they are taking per trade,
How much capital will be deployed, and
The precise stop-loss price level based on user-defined parameters.
It displays all key values in a compact on-chart table (bottom-left corner) for quick trade planning.
💡 Use Case
Perfect for discretionary swing traders, systematic position traders, and risk managers who want instant visual feedback of trade sizing metrics directly on the chart — eliminating manual calculations and improving discipline.
⚙️ Key Features
Dynamic Inputs
Trading Capital (₹) — total available capital for trading.
RPT % — risk-per-trade as a percentage of total capital.
SL % — stop-loss distance in percent below CMP (Current Market Price).
CMP Source — can be linked to close, hl2, etc.
Rounding Style — round position size to Nearest, Floor, or Ceil.
Decimals Show — control number formatting precision in the table.
Core Calculations
SL Points: CMP × SL%
SL Price: CMP − SL Points
Risk Amount (₹): Capital × RPT%
Position Size: Risk ÷ SL Points
Capital Used: Position Size × CMP
Clean On-Chart Table Display
Displays:
Trading Capital
RPT %
Risk Amount (₹)
Position Size (shares/contracts)
Capital Required (₹)
Stop-Loss % & SL Price
The table uses a minimalistic white-on-black design with clear labeling and rupee formatting for quick reference.
Data Window Integration
Plots hidden values (Position Size, Risk Amount, SL Points, Capital Used) for use in TradingView’s Data Window—ideal for strategy testing and exporting values.

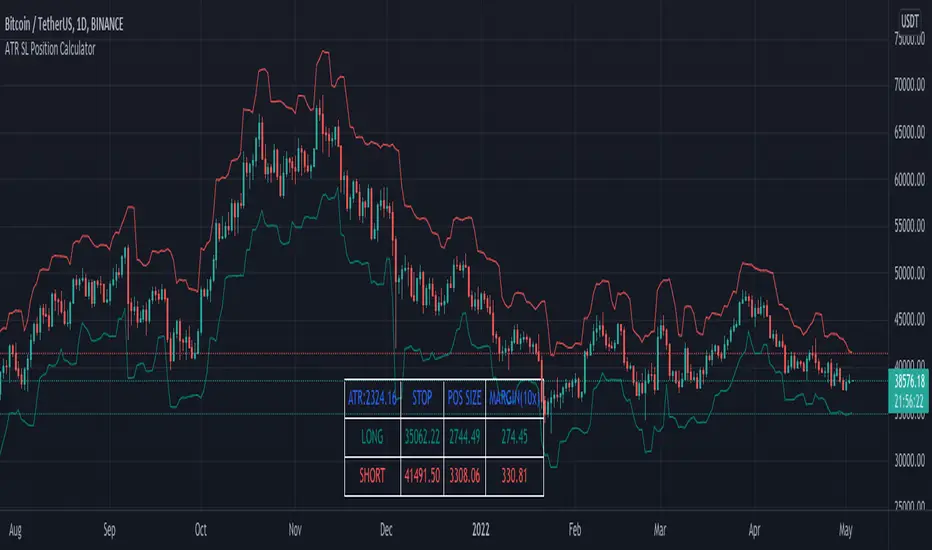
ATR Position Size Calc+Stop guessing your position size. This indicator automatically calculates the optimal number of contracts or shares for each trade.
It is designed for one purpose: to help you maintain consistent risk management by adjusting your trade size based on current market volatility (ATR) and your fixed monetary risk.
// KEY FEATURES
Consistent Risk : Set your max risk in dollars (e.g., $300), and the script calculates the exact position size to match it.
Volatility-Based Stops : Uses the ATR to define a logical stop loss that adapts to market conditions.
Stable Calculation : The calculation is based on the previous closed candle, so the value is reliable and doesn't change intra-bar.
// HOW TO USE
In the settings, simply define your max risk per trade ($) and your ATR parameters. The indicator does the rest.
The essential tool for disciplined trading.
Index Position Size Calculator for [US30 / US100 / SP500]What it does
This tool helps you size positions consistently for index trades on US30 (Dow Jones), NAS100 (Nasdaq-100), and SP500 (S&P 500). Enter your account balance, risk %, and your planned Entry / Stop-Loss / Target and the script calculates:
• Position Size (rounded to your lot/contract step)
• Risk-to-Reward (R/R)
• Potential P/L in USD based on your inputs
• Visual Entry / SL / TP lines with green/red zones and concise labels
Supported contract styles
Choose a preset for common products (e.g., CFD $1/pt, YM/NQ/ES futures, MYM/MNQ/MES micros) or override the economics yourself. You remain in control of the two key levers:
• $/point — how many dollars you gain/lose per 1 index point per contract/lot
• Point size — how many price units equal 1 index point on your chart (often 1.0, but some brokers use 0.1 or 0.5)
Inputs
• Account Balance ($) and Risk % per trade
• Index: US30 / NAS100 / SP500
• Contract: CFD / Futures (YM, NQ, ES) / Micros (MYM, MNQ, MES)
• $/point: auto from Contract or manual override
• Point size: auto from Index or manual override
• Position size step: rounding (e.g., 1 for futures, 0.01 for CFDs)
• Entry / SL / TP: typed values (snapped to tick), with on-chart zones and labels
• Display toggles for lines and labels
How the math works
• StopPoints = |Entry − SL| ÷ PointSize
• ProfitPoints = |TP − Entry| ÷ PointSize
• Position Size = (AccountBalance × Risk%) ÷ (StopPoints × $/point)
• R/R = ProfitPoints ÷ StopPoints
• Potential P/L = PositionSize × Points × $/point
How to use (quick start)
1. Select Index and Contract.
2. Confirm $/point and Point size match your broker’s specs.
3. Enter Entry / SL / TP for the trade idea.
4. Read the Position Size, R/R, and Potential P/L in the info box.
5. Adjust for fees, spreads, and slippage as needed.
Notes & limitations
• Broker symbols can vary. Always verify $/point and Point size for your instrument before risking capital.
• The script does not place orders and does not generate trade signals; it’s a sizing/visualization tool.
• Results can differ across brokers due to pricing, spreads, minimum lot sizes, and execution rules.
• Use on the intended indices; you’ll see a reminder if you load it elsewhere.
Changelog highlights
• Pine v6, constant-safe inputs, tick-snapping, global fills (no local-scope errors).
• Robust label handling and optional minimal chart markers.
Disclaimer
This script is provided for educational purposes only and does not constitute financial advice or a recommendation to buy or sell any security or derivative. Trading involves risk, including the possible loss of principal. Always do your own research, verify contract specifications with your broker, and consider testing in a demo environment before trading live.

Position Size CalculatorIt calculates the risk per trade using two methods: Margin-Based (percentage of total Account Balance) or Equity-Based (percentage of Total Balance minus minimum balance). Displayed as a compact, customizable label on the main chart, it’s perfect for traders seeking quick, precise risk calculations.
Key Features
Two Calculation Options:
Margin-Based: Risk as a percentage (0-5%) of your total account balance.
Equity-Based: Risk as a percentage (0-50%) of (Total balance - Minimum balance).
Flexible Risk Input: Manually enter any risk percentage with 0.01% precision (e.g., 1.75%).
Customizable Display:
Repositionable table (9 positions, e.g., top-right, middle-center).
Four table sizes (XL, L, M, S) with text scaling (large, normal, small, tiny).
Adjustable cell color, text color, and transparency
Margin-Based Risk Calculation:
Set “Total Margin” (e.g., $10,000).
Enter “Risk Percentage (%)” (0 to 5%, e.g., 1.75%).
Equity-Based Risk Calculation:
Set “Total Equity” (e.g., $15,000).
Set “Minimum Balance” (e.g., $5,000).
Enter “Equity Risk Percentage (%)” (0 to 50%, e.g., 1.75%).
Display Settings:
Choose “Calculation Method” (Margin-Based or Equity-Based).
Select “Table Position” (e.g., top_right).
Select “Table Size” (XL, L, M, S; default M).
Customize “Table Cell Color”, “Table Text Color”, and “Table Cell Transparency”.

[TCV] - Position Tool Position Tool by TheCryptoVizier is a trade-planning widget that lets you drop Entry, Take-Profit and Stop-Loss levels directly on the chart, instantly calculates risk-to-reward and position size, and shows only the numbers you actually need. It’s designed for traders who plan visually and don’t want to juggle spreadsheets or external calculators.
WHAT PROBLEM DOES IT SOLVE?
When you drag price levels on TradingView you still have to:
work out how many contracts / coins you can buy for a fixed $ risk,
check that your R:R is acceptable,
copy the final values somewhere else.
The Position Tool automates all of that inside the chart and keeps the screen clean.
HOW TO USE
Add the indicator to any chart.
Drag the blue (Entry), green (TP) and red (SL) lines to your desired levels.
Set your Risk in USDT and toggle the check-boxes to show / hide extra fields.
Read off the position size, risk and R:R in the corner table or copy the exact numbers from the Data Window.
Place your order with confidence – the maths is already done.
Whether you scalp lower-timeframes or swing trade higher ones, the Position Tool removes friction from trade preparation and lets you focus on execution.
KEY FEATURES
Drag-and-drop Entry / TP / SL lines – plan the trade visually.
Fixed-risk position sizing – enter how much you’re willing to lose in USDT (or account currency) and the script tells you the exact position value and quantity.
Live R-to-R ratio – instantly see whether the reward compensates the risk as you move levels.
Smart info panel – overlay table shows Entry, TP, SL, R:R and – optionally via check-boxes – position in USDT, position in $TICKER and risk in USDT. Hide what you don’t need.
Copy-ready Data Window values – the same numbers appear in TradingView’s Data Window, so you can click any cell to copy it straight to the clipboard.
----------
Disclaimer: This indicator is provided for educational purposes only. Trading involves substantial risk, and nothing here should be construed as financial advice or a recommendation to trade. Always do your own research and consult a qualified professional.

Position Size CalculatorThis indicator is a Position Size Calculator designed for stock traders. It calculates the optimal number of shares, investment amount, and potential risk (in ₹) based on your account size, selected risk percentage (0.05% to 0.20%), entry price, stop loss, and brokerage charges. The output is neatly displayed in a table on the chart, helping you manage risk and position sizing efficiently while trading.

BTC/ETH Lot Size for Dexin - V1.0
█ Overview - This tool is specifically tailored for Delta Exchange India’s users.
I use this interactive tool before taking a position in the BTC’s futures perpetual market . With only 3 mouse clicks, I see all the necessary information, whether a Long or Short position.
A visual of Liquidation Price Level, Stop Loss Price Level, Entry Price Level, Break-even Price Level, and Take Profit Price Level can be immediately seen.
On the top right corner of the chart, which Leverage is to be used, No. of Lots to be taken, expected Profit amount, Loss amount, Brokerage Fees, Risk to Reward Ratios, and Return on Investment are shown, excluding brokerage travel. To get the correct answer in the table that suits your account and risk-taking appetite, the user needs to enter the account balance and Risk per trade.
It also does live tracking of the position, and alerts can be configured too.
█ How to Use
Load the indicator on an active chart.
In the Trading View, ensure that the Magnets is enabled (on the left panel). This will precisely select the price levels you want to choose from OHLC for a candle.
When you first load the tool on the bottom of the chart, you will see a blue box with text in white color guiding you on what you need to do.
Before the first click, the box shall prompt “On the signal candle, set the entry level, where the position would be executed”.
Once the entry price level is selected, the next prompt in the blue box shall be “Set the stop loss level where the position would be exited”. Thus, you need to click the stop loss price level.
Now that the two clicks of Entry and Stop Loss are already done, the last remaining is for the take profit. The last prompt shall be “Set the profit level where the position would be exited”. Therefore, you need to select your take-profit level
Finally, when all three points are selected, the tool shall draw trade zones.
The tool automatically determines whether it is a Long Position or Short Position from the Stop loss and take-profit price levels concerning the entry price level
If the take profit level is above the entry price, the stop must be below, and vice versa; otherwise, an error occurs.
You can change levels by dragging the handles that appear when you select the indicator, or by entering new values in the settings.
Once the position tool is on a chart, it will appear at the same levels on all symbols you use.
If you select the position tool on your chart and delete it, this will also delete the indicator from the chart. You will need to re-add it if you want to draw another position tool. You can add multiple instances of the indicator if you need a position tool on more than one of your charts.
█ Features
Display
The tool displays the following information as graphical visuals
The Liquidation to Stop Loss, Stop Loss to Entry, Entry to Break-even, and Entry to Take Profit zones shall be initiated from the entry candle point.
If you want to be from the candle that crossed the level at a different time from the entry candle, you may go to the settings and adjust the time accordingly. Please note that the time interval is 15 minutes, so at times you may not be able to see the graphical display; however, once the 15-minute time interval is over, you will see the graphical display on the chart.
The tool displays the following information in a tabulated manner
The first row indicates the Leverage that is best suited. The leverage selection by default is greater than or equal to the risk distance.
The second row indicates the number of lots that is computed in relation to the account balance, Risk appetite, Entry price, and Stop Loss price.
The third row indicates estimated profit considering taker's fees and is computed in relation to the number of Lots, Entry price, and Take-Profit price.
The fourth row indicates estimated loss considering taker's fees and is computed in relation to the number of Lots, Entry price, and Stop Loss price.
The fifth row indicates the actual Risk to Reward Ratio, ignoring the travel that pertains to fees.
The sixth row indicates actual Return on Investment, ignoring the travel that pertains to fees.
The intent is to allow the user to make an informed decision prior to taking a position by seeing “$/Rs.” or “% of R O I” or “R : R”.
In case the user wants to know beforehand what the expected charges are that need to be borne before taking a position, that too is made available in the seventh and eighth rows. Both sides' charges are made available for ready reference, irrespective of the outcome of the trade, the user knows the consequences beforehand.
█ Settings
'Trade Sizing'
The tool's input menu is divided into various parts. The first part is 'Trade Sizing'. The user needs to key in the exact number that appears in the Delta Exchange India account against 'Account Balance ($)'. The second thing the user needs to do is key in the 'Risk per Trade'. By default,t it is set to 0.25 and has a default stop change of 0.25. Alternatively, the user can key in any number (Whole number or Rational number) within 100 if that suits their risk management criterion.
'Trade Levels'
Allows users to manually set the Entry, Time, Stop Loss, and Take Profit Price Levels.
'Aggressive Mode Selection'
As the Liquidation zone is shown on the chart, if the user feels that the liquidation price level is too far from the stop loss, this option of 'Use Aggressive Leverage?' allows to increase the leverage, thus reducing the investment amount and in return increasing the Return on Investment %.
The second option in this category is 'Compute Lots based on invested Margin?' itself is self-explanatory, and thus the tabulated data shall be populating the data based on the number entered by the user against 'Margin to be invested ($)'. It is for the user to ensure that the estimated outcomes are within their risk management criterion.
'Conversion & Charges'
If the user wants to see the Profit, Loss, and Fees amount in 'Rs.', all that needs to be done is simply enable the 'Show P&L in Rs.?' The conversion shall take place considering 1 USD = 85 Rs. Same as that carried out by Delta Exchange India.
If the user wants to see the Brokerage Fees, all that needs to be done is simply enable the 'Show Brokerage Fees?'. On enabling this, the table shall show Profitable Trade's (PT) Fees and Lost Trade's (LT) Fees irrespective of the outcome of the trade. The intent is to allow the user to make informed decisions to avoid regrets or surprises at the end of the trade.
'Table'
The division of the input section is related to table position, font size and colors for text and background.
█ Alerts
Alerts can be configured by clicking 'More' (the three dots that appear when you place the cursor on the indicator title that appears on the top left corner of the chart). Alternatively, one can configure alerts by right-clicking on either of the two price levels - Stop Loss price level or Take Profit Price level. Upon right clicking, a window shall appear and the topmost line on that window shall display 'Add alert on ……….' The user can thus put alerts on either of the key levels, such as Stop Loss, Take Profit, and Break Even, or on all of them one by one.

Position Size CalculatorPosition Size Calculator - User Guide
A simple tool to calculate optimal position size based on your risk preferences, visualize trade levels, and automatically determine trade direction.
Introduction
The Position Size Calculator is a TradingView indicator designed to help traders calculate the optimal position size for their trades based on account size and risk tolerance. This tool visually represents entry, stop loss, and take profit levels while automatically calculating the appropriate position size to maintain consistent risk management.
Getting Started
Setting Up Your Account Parameters
Setting Price Levels
Understanding the Visual Elements
Adjusting Your Trade on the Chart
Reading the Information Panel
1. Getting Started
After adding the indicator to your chart, you'll see three horizontal lines representing:
Yellow line: Entry price
Green line: Take profit price
Red line: Stop loss price
The indicator automatically detects whether you're planning a Long or Short trade based on the position of your take profit relative to your entry.
2. Setting Up Your Account Parameters
In the "Position Calculator" settings group:
Account Size : Enter your total account balance
Account Currency : Set your account currency (USD, EUR, etc.)
Risk (%) : Enter the percentage of your account you're willing to risk per trade (e.g., 2%)
Instrument Type : Select your trading instrument (Forex, Futures, Stocks, or Crypto)
Value per 0.01 lot per tick : Enter the value of 0.01 lots per tick (for most Forex pairs, this is $1 per pip for 0.01 lot)
Minimum Lot Size : Set the minimum lot size allowed by your broker (usually 0.01 for Forex)
3. Setting Price Levels
In the "Price Levels" section:
Entry Price : The price at which you plan to enter the trade
Stop Loss Price : Where you'll exit if the trade goes against you
Take Profit Price : Your target price where you'll take profits
If you set Entry Price to 0, it will default to the current price. If Stop Loss or Take Profit are set to 0, they'll default to 5% below or above entry price respectively.
4. Understanding the Visual Elements
Yellow line : Your entry price
Green line : Your take profit level
Red line : Your stop loss level
Green zone : The profit zone (between entry and take profit)
Red zone : The loss zone (between entry and stop loss)
Information panel : Shows all calculations and trade details
5. Adjusting Your Trade on the Chart
The beauty of this tool is its interactivity:
You can drag any of the lines directly on the chart to adjust entry, stop loss, or take profit
If you drag the take profit above the entry , the indicator automatically sets up for a Long trade
If you drag the take profit below the entry , it automatically configures for a Short trade
All calculations and visuals update in real-time as you adjust the lines
This means you can quickly test different scenarios and see how they affect your position size and potential profit/loss.
6. Reading the Information Panel
The information panel displays:
Account details : Your account size and currency
Risk information : Your percentage risk and the equivalent monetary amount
Position Size : The optimal lot size calculated based on your risk parameters
Price levels : Entry, Stop Loss, and Take Profit with distances in ticks
Risk/Reward ratio : Shown as 1:X (where X is the reward relative to 1 unit of risk)
Potential outcomes : The exact amount you stand to gain or lose on this trade
Trade direction : Whether this is a Long or Short trade
Visual Settings
You can customize the appearance in the "Visual" settings group:
Adjust colors for profit and loss zones
Change the transparency of colored zones
Toggle the filling of spaces between lines
Adjust how far the lines extend beyond the last candle
Practical Tips
Always double-check your "Value per 0.01 lot per tick" setting for the specific instrument you're trading
For Forex major pairs, the standard is usually $1 per pip for 0.01 lots
For other instruments, consult your broker's specifications
The indicator works best when you place your stop loss at a logical market level (support/resistance, swing high/low) rather than a fixed percentage
Final Thoughts
This Position Size Calculator helps remove emotion from your trading by objectively calculating your position size based on your predefined risk parameters. It ensures that you maintain consistent risk across all your trades, regardless of the stop loss distance, which is a key component of successful risk management.
Remember: The most important goal in trading is capital preservation. This tool helps you ensure that each trade risks only what you've decided is acceptable for your trading strategy.
Position Sizing Calculator (Real-Time)█ SUMMARY
The following indicator is a Position Sizing Calculator based on Average True Range (ATR), originally developed by market technician J. Welles Wilder Jr., intended for real-time trading.
This script utilizes the user's account size, acceptable risk percentage, and a stop-loss distance based on ATR to dynamically calculate the appropriate position size for each trade in real time.
█ BACKGROUND
Developed for use on the 5-minute timeframe, this script provides traders with continuously updated, dynamic position sizes. It enables traders to instantly determine the exact number of shares and dollar amount to use for entering a trade within their acceptable risk tolerance whenever a trade opportunity arises.
This real-time position sizing tool helps traders make well-informed decisions when planning trade entries and calculating maximum stop-loss levels, ultimately enhancing risk management.
█ USER INPUTS
Trading Account Size: Total dollar value of the user's trading account.
Acceptable Risk (%): Maximum percentage of the trading account that the user is willing to risk per trade.
ATR Multiplier for Stop-Loss: Multiplier used to determine the distance of the stop-loss from the current price, based on the ATR value.
ATR Length: The length of the lookback period used to calculate the ATR value.

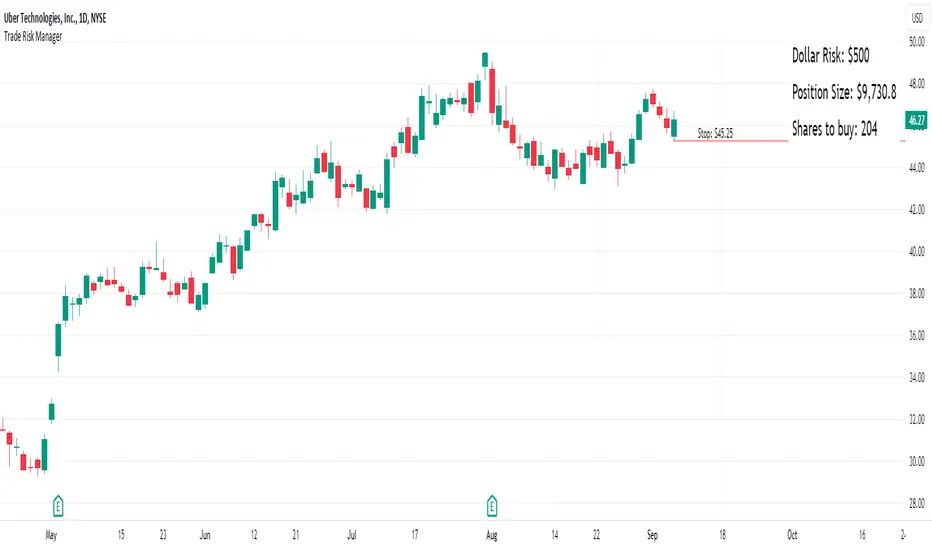
Equity Trade Risk ManagerEquity Trade Risk Manager is a simple indicator that helps you protect your portfolio by going into each trade risk first !
Equity Trade Risk Manager does this by calculating your ideal position size or ideal stop loss based on your account size, purchase price and risk tolerance. This ensures you are never risking more than your predetermined amount on each trade.
Unlike most position size calculators, that will only tell traders how many shares to purchase, Equity Trade Risk Manger allows the trader to choose whether they want to calculate the ideal number of shares to purchase or where to set the trades stop loss based on the number of shares owned. Not only that, but knowing traders need to act fast, the indicator also gives the option to quickly use the current price and low of the day as an entry and stop. Lastly, your stop loss will be plotted onto the chart for a visual aid.
Features:
Dynamic Risk Settings:
Account Customization: Input your account size to get metrics tailored to you.
Calculation Choices: Decide if you want the tool to calculate the number of shares you should buy or where to set your stop-loss.
Custom Risk Parameters: Use preset risk percentages or set your own to match your comfort level.
Price Point Flexibility:
Enter your entry and stop price or opt to use the current price and the low of the day.
Interactive Display Settings:
Customizable Interface: Adjust table positions, text size, and color schemes to match your trading dashboard aesthetic.
On-Chart Stop-Loss Indication: Visualize your stop loss on the chart itself.
Get a snapshot of your dollar risk, position size, shares to buy, and stop-loss.
Risk Management GO8686: Stop Loss, Position Size & TargetFull Name: Risk Management GO8686: Stop Loss, Position Size & Target
What this indicator provides:
A dashboard to calculate Stop Loss, Position Size and Target, where users can customize Risk Management parameters in the setting.
Position Size: calculated from "initialCapital", "Leverage", "Max Loss", "feeMaker", "feeTaker".
Stop Loss Price: using pivots, default length is set to 3, with an extra ATR value controlled by "'Multiplier OF Extra ATR".
Target: calculated from entry price, risk reward, distance between entry and stop loss, fees
What the indicator does Not provides:
entries of positions: The Long/Short entries displayed are just MACD signal crossing zero, users can apply their own entry logic, by modifying ready2L / ready2S variables.
What the indicator does Not guarantee:
the integrity, timeliness, accuracy, and comprehensiveness of the data, calculation method, calculation results, etc.
Two types labels:
1. Automated labels: they are displayed when MACD signal crossing zero, use "Display History Labels" to toggle display or not.
2. Setup Manually label: located at the right side of the latest bar, to display results when users setup manually
The settings of the indicator:
"Toggle to Reload",
"InitialCapital", "Leverage", "Max Loss % per trade", "feeMaker", "feeTaker",
4 length inputs for Pivot, "Multiplier of Extra ATR for stop loss",
"Toggle To setup manually", "Toggle between Long / Short", "Entry Price, set manually", "Stop Loss Price, set manually", "Risk-Reward Ratio"
"Display History Labels"
---------- Disclaimer ----------
Before using or requesting access to the indicator, customers/users acknowledge that they have read and accepted that the indicator, any associated contents on all social medias and any communication with the indicator author, including but not limited to: product and service details, signals, alerts, data, calculation methods, calculation results, user manual, tutorials, ideas, videos, chats, messages, emails, blogs, tweets, etc. are provided solely for educational purpose and Not as financial advice. Customers/users understand and agree to use the aforementioned indicator and information at their own risk.
---------- Updates ----------
The latest updates override the previous content.
To activate a update, if it does not load as expected: close the indicator, save the chart, clear browser caches, restart the browser, reload the chart and apply the indicator to the chart.

Forex Risk CalculatorForex Risk Calculator 's logical is bring the differential between Entry price and Stoploss price, your acceptable risk and your account size to calculate the loss size first then convert to the 'Lot size' and have another feature like auto scale static target calculate by your loss size with RRR (Risk Reward Ratio). Give you to get easier to manage your orders.
Key Features:
📈 Real-time Risk Assessment: Enter the amount you are willing to risk, and Forex Risk Calculator will calculate the appropriate position size for your trade in real-time.
🎯 Target Lines and Static Target Prices based on RRR: Set your desired Risk-Reward Ratio (RRR), and let Forex Risk Calculator auto-generate target prices according to your RRR. Additionally, place target lines to visualize the expected profit if the price hits that line.
⚙️ Customizable Parameters: Adjust risk percentage, RRR, and other parameters to tailor the tool to your trading strategy.
👁️ User-Friendly Interface: Forex Risk Calculator features an easy-to-use and intuitive interface for both beginners and seasoned traders.
Usage:
Step 1: Place your entry price
Step 2: Place your stoploss price
Step 3: Place your target price
Step 4: Confirm your account detail
Step 5: Bring the 'Lot size' to use
Parameter:
Initial account size
Risk percent
Entry price
Stop price
Target price
Show your target price
Show static target prices
Number of your static target prices
Table position
Text size
Background color
Text color
Border color
Output:
Chart
Entry price line
Stop loss price line (loss in USD)
Target price line (profit in USD)
Table
Account size
Risk percent
Entry price
Stoploss price
Lot size
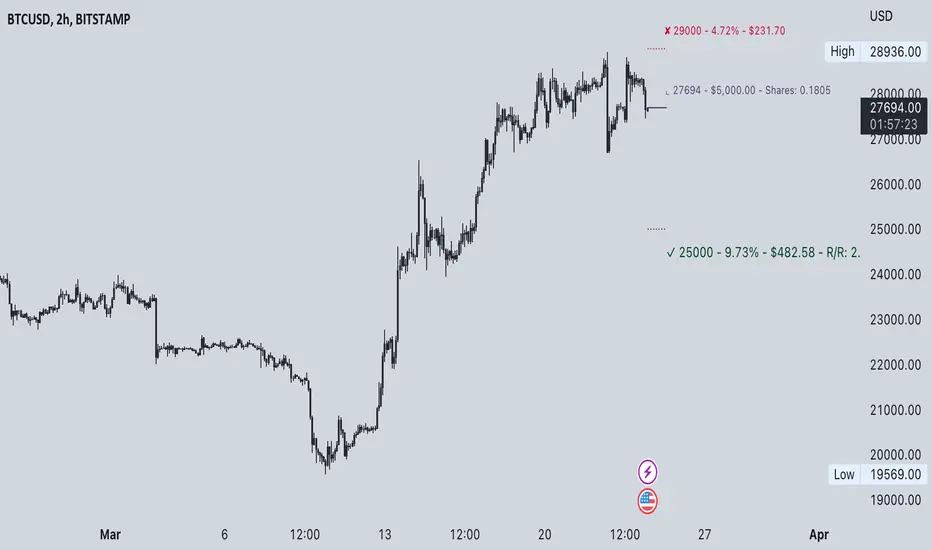
Commission-aware Trade LabelsCommission-aware Trade Labels
Description:
This library provides an easy way to visualize take-profit and stop-loss levels on your chart, taking into account trading commissions. The library calculates and displays the net profit or loss, along with other useful information such as risk/reward ratio, shares, and position size.
Features:
Configurable take-profit and stop-loss prices or percentages.
Set entry amount or shares.
Calculates and displays the risk/reward ratio.
Shows net profit or loss, considering trading commissions.
Customizable label appearance.
Usage:
Add the script to your chart.
Create an Order object for take-profit and stop-loss with desired configurations.
Call target_label() and stop_label() methods for each order object.
Example:
target_order = Order.new(take_profit_price=27483, stop_loss_price=28000, shares=0.2)
stop_order = Order.new(stop_loss_price=29000, shares=1)
target_order.target_label()
stop_order.stop_label()
This script is a powerful tool for visualizing your trading strategy's performance and helps you make better-informed decisions by considering trading commissions in your profit and loss calculations.
Library "tradelabels"
entry_price(this)
Parameters:
this : Order object
@return entry_price
take_profit_price(this)
Parameters:
this : Order object
@return take_profit_price
stop_loss_price(this)
Parameters:
this : Order object
@return stop_loss_price
is_long(this)
Parameters:
this : Order object
@return entry_price
is_short(this)
Parameters:
this : Order object
@return entry_price
percent_to_target(this, target)
Parameters:
this : Order object
target : Target price
@return percent
risk_reward(this)
Parameters:
this : Order object
@return risk_reward_ratio
shares(this)
Parameters:
this : Order object
@return shares
position_size(this)
Parameters:
this : Order object
@return position_size
commission_cost(this, target_price)
Parameters:
this : Order object
@return commission_cost
target_price
net_result(this, target_price)
Parameters:
this : Order object
target_price : The target price to calculate net result for (either take_profit_price or stop_loss_price)
@return net_result
create_take_profit_label(this, prefix, size, offset_x, bg_color, text_color)
Parameters:
this
prefix
size
offset_x
bg_color
text_color
create_stop_loss_label(this, prefix, size, offset_x, bg_color, text_color)
Parameters:
this
prefix
size
offset_x
bg_color
text_color
create_entry_label(this, prefix, size, offset_x, bg_color, text_color)
Parameters:
this
prefix
size
offset_x
bg_color
text_color
create_line(this, target_price, line_color, offset_x, line_style, line_width, draw_entry_line)
Parameters:
this
target_price
line_color
offset_x
line_style
line_width
draw_entry_line
Order
Order
Fields:
entry_price : Entry price
stop_loss_price : Stop loss price
stop_loss_percent : Stop loss percent, default 2%
take_profit_price : Take profit price
take_profit_percent : Take profit percent, default 6%
entry_amount : Entry amount, default 5000$
shares : Shares
commission : Commission, default 0.04%
Position Size ToolUpdated - Version 2
This tool is used to calculate the size of a trade.
Settings - Type in total account size and % of capital that can be risked on each trade.
The table will display:
Column 1 - Stop placement based on low, mid or high value of the current candle.
Column 2 - Percent risk on the trade.
Column 3 - Amount of shares that can be traded (calculated from account size, risk and selected stop placement).
Green color is intended for long position, stop at the low of the candle.
Red color is intended for short position, stop at the high of the candle.
Middle value can shift between either color since its measured from open to close.

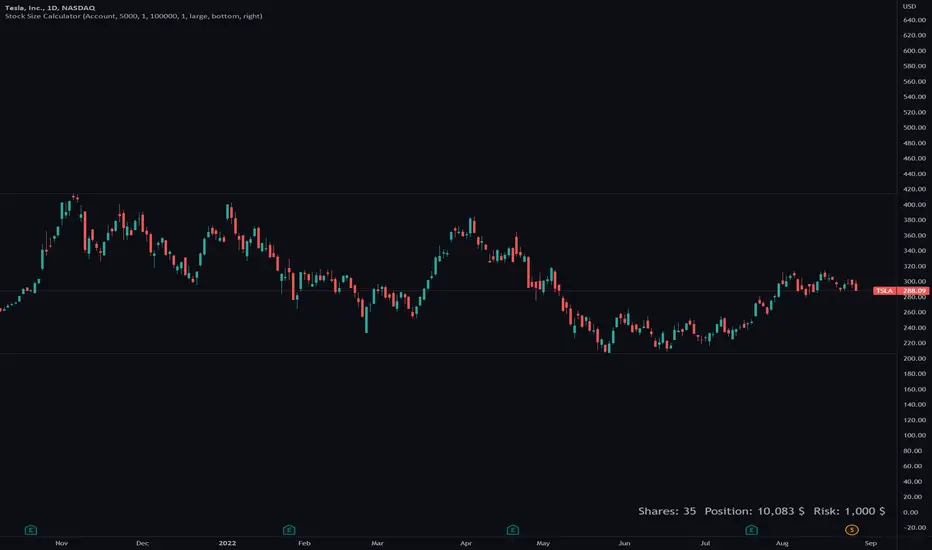
Stock Size CalculatorThis indicator helps traders to calculate the amount of shares they need to buy based on their preferred position size.
The Stock Size Calculator has two modes: Account and Position mode.
Position mode:
In Position mode the trader enters a position size in dollar and directly gets the amount of shares that can be bought with the given position size.
In addition it is possible to select a factor to quickly see how many shares should be bought for a half or double position.
Account mode:
In Account mode the trader enters his/her account size and a preferred risk in percent.
With both values the amount of shares as well as the risk in dolloar is calculated.
Features
■ Calculate the amount of shares, position size & risk
■ Use Position or Account mode
■ Multiple customize options
Hints
*Only tested on US stocks
*All calculations without guarantee, please check the results before open orders
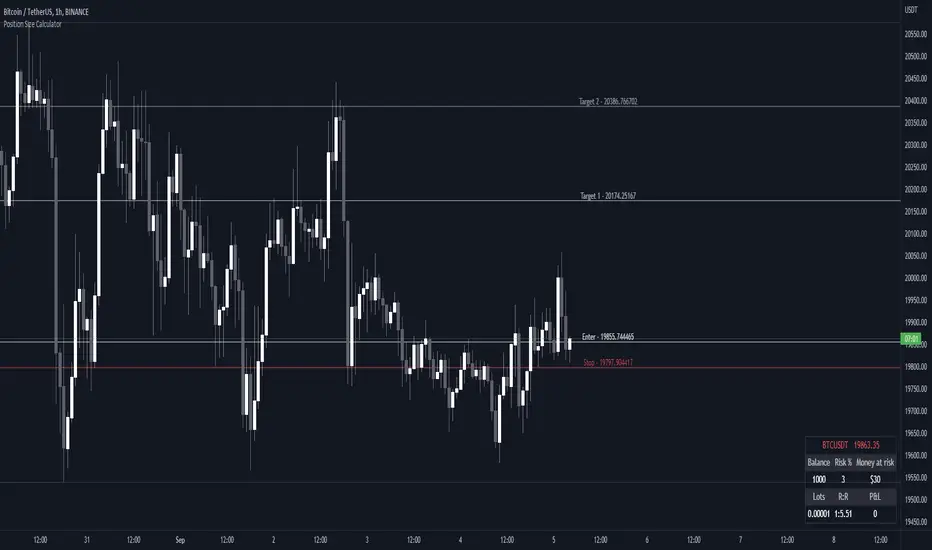
Position -/ lot size calculator - SonarlabCalculating a lot size in MetaTrader is normally not a quick task, but it is a very important one.
MetaTrader doesn't offer a fast way to calculate the position size, so, usually, a trader needs to manually perform several calculations.
When you are submitting an order, you are already supposed to know and type in the lot size for the trade. It can be frustrating to calculate - that's why we made this tool to speed up the process a little. Now you can also see your P/L live and calculate the lot size within seconds straight from Tradingview.
Usage:
Step 1: Set your entry price
Step 2: Set your stop loss
Step 3: Set your Target
Step 4: Choose the symbol, forex will be automatically detected
Step 5: Fill in your balance and set your risk settings
Parameters
- Set symbol: Forex (auto detection), US100, US30, BTC, XAUUSD, NGAS, XBRUSD, XTIUSD, AUS200, US500
- Account balance
- Risk in %
- Contract size
- Levels: Stop loss, Entry, Target 1, Target 2, Target 3
- Display settings for the Trading Panel
Trading panel
- Show Live P/L
- Show Risk to reward
- Show lot size
- Show risk in %
- Show account balance
- Show money at risk (no commissions included)
Forex Lot Size Calculator [AKCHOOO]Forex Lot Size Calculator based off stop loss (ticks), also shows the lot size needed for taking partials (based of % of trade to close partial position).
credits
inspired by @DewMic
adapted from @hanabil
Ultimate risk management toolHow to use:
Use the cursor to select the time, entry, stop loss, and target position. Then a window will pop up and type the trading fee or any other things you want to adjust to calculate the actual reward/risk ratio according to the price you selected.
Known error:
Settings of this script can't be saved as default might due to the interactive price selection function. If anyone knows how to fix it, please let me know.
feature:
1. Dynamic profit label can move up and down vertically on the right-hand side of the box.
2. The breakeven line can tell you you can move your stop loss to the entry price when the price reaches it.
3. Calculate the actual reward/risk ratio based on the trading fee. The calculator only calculates the actual Risk/Reward Ratio, which might be helpful for scalpers.
4. When the price touches sl or tp, that side of the box will be highlighted. Sometimes it doesn't work but I will try my best to fix it. Feel free to share your idea to help me to fix it.
5. Price alert. This tool compares with the alert function but reopens it if you want to change the alert price.

ATR SL + Position Size Calculator [DoctaBot]Props to @Veryfid for his original script 'ATR Stop Loss Finder'.
The concept is simple. We use the average true range to determine an appropriate stop loss distance based on recent volatility. The original script calculated the stop loss offset from the current candle's high or low. Here, I've added the option to offset stop loss from the recent local low or local high (a better way in my opinion).
I have also added a feature to automatically calculate position size by either dollar amount or as a percent of your account size to suit your risk profile (percent of account at risk per trade). This calculator supports use of leverage to calculate the amount of margin required to open desired position size.