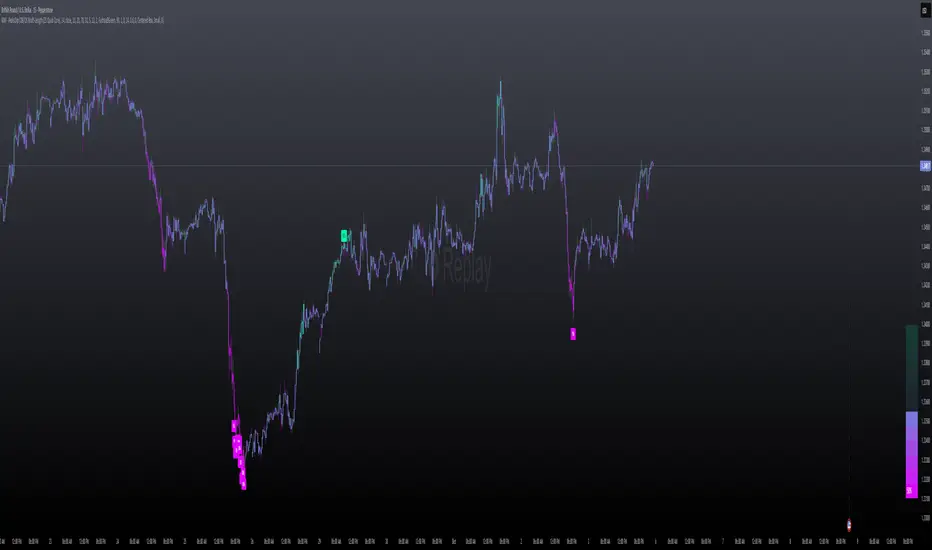
MILLION MEN - Peaks & Dips MeterWhat it is
The MILLION MEN — Peaks & Dips Meter is a dynamic momentum visualization tool designed to identify extreme strength and exhaustion zones. It uses two selectable engines:
RSI Meter (ZS Core) for classic strength analysis.
OB/OS Multi-Length (ZS Quick Core) for adaptive readings that reflect multi-period sentiment shifts.
How it works
The script computes normalized momentum values (0–100) from price dynamics, builds a smooth gradient representation, and displays it as a fixed right-bottom table. The meter color scales between fuchsia and green, with optional candle coloring and percentage labels.
It can also highlight overbought (peaks) and oversold (dips) moments directly on candles with adjustable ATR offsets and label styles.
How to use
Values near 90–100% → potential short-term exhaustion (watch for reversals).
Values near 0–10% → potential accumulation zones (possible bounces).
Use together with structure, volume, or trend filters for confirmation.
Originality
Unlike standard RSI tools, this script merges multi-length OB/OS detection with a real-time visual meter, optimized for scalpers and visual traders. It does not repaint and maintains a lightweight structure for fast responsiveness.
Limitations
This indicator is for analysis purposes only and should not be considered financial advice. Past readings do not guarantee future performance.
Overbought

Aggregated Scores Oscillator [Alpha Extract]A sophisticated risk-adjusted performance measurement system that combines Omega Ratio and Sortino Ratio methodologies to create a comprehensive market assessment oscillator. Utilizing advanced statistical band calculations with expanding and rolling window analysis, this indicator delivers institutional-grade overbought/oversold detection based on risk-adjusted returns rather than traditional price movements. The system's dual-ratio aggregation approach provides superior signal accuracy by incorporating both upside potential and downside risk metrics with dynamic threshold adaptation for varying market conditions.
🔶 Advanced Statistical Framework
Implements dual statistical methodologies using expanding and rolling window calculations to create adaptive threshold bands that evolve with market conditions. The system calculates cumulative statistics alongside rolling averages to provide both historical context and current market regime sensitivity with configurable window parameters for optimal performance across timeframes.
🔶 Dual Ratio Integration System
Combines Omega Ratio analysis measuring excess returns versus deficit returns with Sortino Ratio calculations focusing on downside deviation for comprehensive risk-adjusted performance assessment. The system applies configurable smoothing to both ratios before aggregation, ensuring stable signal generation while maintaining sensitivity to regime changes.
// Omega Ratio Calculation
Excess_Return = sum((Daily_Return > Target_Return ? Daily_Return - Target_Return : 0), Period)
Deficit_Return = sum((Daily_Return < Target_Return ? Target_Return - Daily_Return : 0), Period)
Omega_Ratio = Deficit_Return ≠ 0 ? (Excess_Return / Deficit_Return) : na
// Sortino Ratio Framework
Downside_Deviation = sqrt(sum((Daily_Return < Target_Return ? (Daily_Return - Target_Return)² : 0), Period) / Period)
Sortino_Ratio = (Mean_Return / Downside_Deviation) * sqrt(Annualization_Factor)
// Aggregated Score
Aggregated_Score = SMA(Omega_Ratio, Omega_SMA) + SMA(Sortino_Ratio, Sortino_SMA)
🔶 Dynamic Band Calculation Engine
Features sophisticated threshold determination using both expanding historical statistics and rolling window analysis to create adaptive overbought/oversold levels. The system incorporates configurable multipliers and sensitivity adjustments to optimize signal timing across varying market volatility conditions with automatic band convergence logic.
🔶 Signal Generation Framework
Generates overbought conditions when aggregated score exceeds adjusted upper threshold and oversold conditions below lower threshold, with neutral zone identification for range-bound markets. The system provides clear binary signal states with background zone highlighting and dynamic oscillator coloring for intuitive market condition assessment.
🔶 Enhanced Visual Architecture
Provides modern dark theme visualization with neon color scheme, dynamic oscillator line coloring based on signal states, and gradient band fills for comprehensive market condition visualization. The system includes zero-line reference, statistical band plots, and background zone highlighting with configurable transparency levels.
snapshot
🔶 Risk-Adjusted Performance Analysis
Utilizes target return parameters for customizable risk assessment baselines, enabling traders to evaluate performance relative to specific return objectives. The system's focus on downside deviation through Sortino analysis provides superior risk-adjusted signals compared to traditional volatility-based oscillators that treat upside and downside movements equally.
🔶 Multi-Timeframe Adaptability
Features configurable calculation periods and rolling windows to optimize performance across various timeframes from intraday to long-term analysis. The system's statistical foundation ensures consistent signal quality regardless of timeframe selection while maintaining sensitivity to market regime changes through adaptive band calculations.
🔶 Performance Optimization Framework
Implements efficient statistical calculations with optimized variable management and configurable smoothing parameters to balance responsiveness with signal stability. The system includes automatic band adjustment mechanisms and rolling window management for consistent performance across extended analysis periods.
This indicator delivers sophisticated risk-adjusted market analysis by combining proven statistical ratios in a unified oscillator framework. Unlike traditional overbought/oversold indicators that rely solely on price movements, the ASO incorporates risk-adjusted performance metrics to identify genuine market extremes based on return quality rather than price volatility alone. The system's adaptive statistical bands and dual-ratio methodology provide institutional-grade signal accuracy suitable for systematic trading approaches across cryptocurrency, forex, and equity markets with comprehensive visual feedback and configurable risk parameters for optimal strategy integration.

RSI Cloud v1.0 [PriceBlance] RSI Cloud v1.0 — Ichimoku-style Cloud on RSI(14), not on price.
Recalibrated baselines: EMA9 (Tenkan) for speed, WMA45 (Kijun) for stability.
Plus ADX-on-RSI to grade strength so you know when momentum persists or fades.
1. Introduction
RSI Cloud v1.0 applies an Ichimoku Cloud directly on RSI(14) to reveal momentum regimes earlier and cleaner than price-based views. We replaced Tenkan with EMA9 (faster, more responsive) and Kijun with WMA45 (slower, more stable) to fit a bounded oscillator (0–100). Forward spans (+26) and a lagging line (−26) provide a clear framework for trend bias and transitions.
To qualify signals, the indicator adds ADX computed on RSI—highlighting whether strength is weak, strong, or very strong, so you can decide when to follow, fade, or stand aside.
2. Core Mapping (Hook + Bullets)
At a glance: Ichimoku on RSI(14) with recalibrated baselines for a bounded oscillator.
Source: RSI(14)
Tenkan → EMA9(RSI) (fast, responsive)
Kijun → WMA45(RSI) (slow, stable)
Span A: classic Ichimoku midline, displaced +26
Span B: classic Ichimoku baseline, displaced +26
Lagging line: RSI shifted −26
3. Key Benefits (Why traders care)
Momentum regimes on RSI: position vs. Cloud = bull / bear / transition at a glance.
Cleaner confirmations: EMA9/WMA45 pairing cuts noise vs. raw 30/70 flips.
Earlier warnings: Cloud breaks on RSI often lead price-based confirmations.
4. ADX on RSI (Enhanced Strength Normalization)
Grade strength inside the RSI domain using ADX from ΔRSI:
ADX ≤ 20 → Weak (transparency = 60)
ADX ≤ 40 → Strong (transparency = 15)
ADX > 40 → Very strong (transparency = 0)
Use these tiers to decide when to trust, fade, or ignore a signal.
5. How to Read (Quick rules)
Bias / Regime
Bullish: RSI above Cloud and RSI > WMA45
Bearish: RSI below Cloud and RSI < WMA45
Neutral / Transition: all other cases
6. Settings (Copy & use)
RSI Length: 14 (default)
Tenkan: EMA9 on RSI · Kijun: WMA45 on RSI
Displacement: +26 (Span A/B) · −26 (Lagging)
Theme: PriceBlance Dark/Light
Visibility toggles: Cloud, Baselines, Lagging, labels/panel, Overbought/Oversold, Divergence, ADX-on-RSI (via transparency coloring)
7. Credits & License
Author/Brand: PriceBlance
Version: v1.0 (Free)
Watermark: PriceBlance • RSI Cloud v1.0
Disclaimer: Educational content; not financial advice.
8. CTA
If this helps, please ⭐ Star and Follow for updates & new tools.
Feedback is welcome—comment what you’d like added next (alerts, presets, visuals).

icreature RSI Divergence Indicator with Customizable OB/OS Spotsicreature RSI Divergence Indicator with Customizable OB/OS Spots
Oscillator Matrix [Alpha Extract]A comprehensive multi-oscillator system that combines volume-weighted money flow analysis with enhanced momentum detection, providing traders with a unified framework for identifying high-probability market opportunities across all timeframes. By integrating two powerful oscillators with advanced confluence analysis, this indicator delivers precise entry and exit signals while filtering out market noise through sophisticated threshold-based regime detection.
🔶 Volume-Weighted Money Flow Analysis
Utilizes an advanced money flow calculation that tracks volume-weighted price movements to identify institutional activity and smart money flow. This approach provides superior signal quality by emphasizing high-volume price movements while filtering out low-volume market noise.
// Volume-weighted flows
up_volume = price_up ? volume : 0
down_volume = price_down ? volume : 0
// Money Flow calculation
up_vol_sum = ta.sma(up_volume, mf_length)
down_vol_sum = ta.sma(down_volume, mf_length)
total_volume = up_vol_sum + down_vol_sum
money_flow_ratio = total_volume > 0 ? (up_vol_sum - down_vol_sum) / total_volume : 0
🔶 Enhanced Hyper Wave Oscillator
Features a sophisticated MACD-based momentum oscillator with advanced normalization techniques that adapt to different price ranges and market volatility. The system uses percentage-based calculations to ensure consistent performance across various instruments and timeframes.
// Enhanced MACD-based oscillator
fast_ma = ta.ema(src, hw_fast)
slow_ma = ta.ema(src, hw_slow)
macd_line = fast_ma - slow_ma
signal_line = ta.ema(macd_line, hw_signal)
// Proper normalization using percentage of price
price_base = ta.sma(close, 50)
macd_normalized = macd_line / price_base
hyper_wave = macd_range > 0 ? macd_normalized / macd_range : 0
🔶 Multi-Factor Confluence System
Implements an intelligent confluence scoring mechanism that combines signals from both oscillators to identify high-probability trading opportunities. The system assigns strength scores based on multiple confirmation factors, significantly reducing false signals.
🔶 Fixed Threshold Levels
Uses predefined threshold levels optimized for standard oscillator ranges to distinguish between normal market fluctuations and significant momentum shifts. The dual-threshold system provides clear visual cues for overbought/oversold conditions while maintaining consistent signal criteria across different market conditions.
🔶 Overflow Detection Technology
Advanced overflow indicators identify extreme market conditions that often precede major reversals or continuation patterns. These signals highlight moments when market momentum reaches critical levels, providing early warning for potential turning points.
🔶 Dual Oscillator Integration
The indicator simultaneously tracks volume-weighted money flow and momentum-based price action through two independent oscillators. This dual approach ensures comprehensive market analysis by capturing both institutional activity and technical momentum patterns.
// Multi-factor confluence scoring
confluence_bull = (mf_bullish ? 1 : 0) + (hw_bullish ? 1 : 0) +
(mf_overflow_bull ? 1 : 0) + (hw_overflow_bull ? 1 : 0)
confluence_bear = (mf_bearish ? 1 : 0) + (hw_bearish ? 1 : 0) +
(mf_overflow_bear ? 1 : 0) + (hw_overflow_bear ? 1 : 0)
confluence_strength = confluence_bull > confluence_bear ? confluence_bull / 4 : -confluence_bear / 4
🔶 Intelligent Signal Generation
The system generates two tiers of reversal signals: strong signals that require multiple confirmations across both oscillators, and weak signals that identify early momentum shifts. This hierarchical approach allows traders to adjust position sizing based on signal strength.
🔶 Visual Confluence Zones
Background coloring dynamically adjusts based on confluence strength, creating visual zones that immediately communicate market sentiment. The intensity of background shading corresponds to the strength of the confluent signals, making pattern recognition effortless.
🔶 Threshold Visualization
Color-coded threshold zones provide instant visual feedback about oscillator positions relative to key levels. The fill areas between thresholds create clear overbought and oversold regions with graduated color intensity.
🔶 Candle Color Integration
Optional candle coloring applies confluence-based color logic directly to price bars, creating a unified visual framework that helps traders correlate indicator signals with actual price movements for enhanced decision-making.
🔶 Overflow Alert System
Specialized circular markers highlight extreme overflow conditions on both oscillators, drawing attention to potential climax moves that often precede significant reversals or accelerated trend continuation.
🔶 Customizable Display Options
Comprehensive display controls allow traders to toggle individual components on or off, enabling focused analysis on specific aspects of the indicator. This modularity ensures the indicator adapts to different trading styles and analytical preferences.
1 Week
1 Day
15 Min
This indicator provides a complete analytical framework by combining volume analysis with momentum detection in a single, coherent system. By offering multiple confirmation layers and clear visual hierarchies, it empowers traders to identify high-probability opportunities while maintaining precise risk management across all market conditions and timeframes. The sophisticated confluence system ensures that signals are both timely and reliable, making it an essential tool for serious technical analysts.

Algorithmic Value Oscillator [CRYPTIK1]Algorithmic Value Oscillator
Introduction: What is the AVO? Welcome to the Algorithmic Value Oscillator (AVO), a powerful, modern momentum indicator that reframes the classic "overbought" and "oversold" concept. Instead of relying on a fixed lookback period like a standard RSI, the AVO measures the current price relative to a significant, higher-timeframe Value Zone .
This gives you a more contextual and structural understanding of price. The core question it answers is not just "Is the price moving up or down quickly?" but rather, " Where is the current price in relation to its recently established area of value? "
This allows traders to identify true "premium" (overbought) and "discount" (oversold) levels with greater accuracy, all presented with a clean, futuristic aesthetic designed for the modern trader.
The Core Concept: Price vs. Value The market is constantly trying to find equilibrium. The AVO is built on the principle that the high and low of a significant prior period (like the previous day or week) create a powerful area of perceived value.
The Value Zone: The range between the high and low of the selected higher timeframe.
Premium Territory (Distribution Zone): When the oscillator moves into the glowing pink/purple zone above +100, it is trading at a premium.
Discount Territory (Accumulation Zone): When the oscillator moves into the glowing teal/blue zone below -100, it is trading at a discount.
Key Features
1. Glowing Gradient Oscillator: The main oscillator line is a dynamic visual guide to momentum.
The line changes color smoothly from light blue to neon teal as bullish momentum increases.
It shifts from hot pink to bright purple as bearish momentum increases.
Multiple transparent layers create a professional "glow" effect, making the trend easy to see at a glance.
2. Dynamic Volatility Histogram: This histogram at the bottom of the indicator is a custom volatility meter. It has been engineered to be adaptive, ensuring that the visual differences between high and low volatility are always clear and dramatic, no matter your zoom level. It uses a multi-color gradient to visualize the intensity of market volatility.
3. Volatility Regime Dashboard: This simple on-screen table analyzes the histogram and provides a clear, one-word summary of the current market state: Compressing, Stable, or Expanding.
How to Use the AVO: Trading Strategies
1. Reversion Trading This is the most direct way to use the indicator.
Look for Buys: When the AVO line drops into the teal "Accumulation Zone" (below -100), the price is trading at a discount. Watch for the oscillator to form a bottom and start turning up as a signal that buying pressure is returning.
Look for Sells: When the AVO line moves into the pink "Distribution Zone" (above +100), the price is trading at a premium. Watch for the oscillator to form a peak and start turning down as a signal that selling pressure is increasing.
2. Best Practices & Settings
Timeframe Synergy: The AVO is most effective when your chart timeframe is lower than your selected "Value Zone Source." For example, if you trade on the 1-hour chart, set your Value Zone to "Previous Day."
Confirmation is Key: This indicator provides powerful context, but it should not be used in isolation. Always combine its readings with your primary analysis, such as market structure and support/resistance levels.

FSVZO [Alpha Extract]A sophisticated volume-weighted momentum oscillator that combines Fourier smoothing with Volume Zone Oscillator methodology to deliver institutional-grade flow analysis and divergence detection. Utilizing advanced statistical filtering including ADF trend analysis and multi-dimensional volume dynamics, this indicator provides comprehensive market sentiment assessment through volume-price relationships with extreme zone detection and intelligent divergence recognition for high-probability reversal and continuation signals.
🔶 Advanced VZO Calculation Engine
Implements enhanced Volume Zone Oscillator methodology using relative volume analysis combined with smoothed price changes to create momentum-weighted oscillator values. The system applies exponential smoothing to both volume and price components before calculating positive and negative momentum ratios with trend factor integration for market regime awareness.
🔶 Fourier-Based Smoothing Architecture
Features advanced Fourier approximation smoothing using cosine-weighted calculations to reduce noise while preserving signal integrity. The system applies configurable Fourier length parameters with weighted sum normalization for optimal signal clarity across varying market conditions with enhanced responsiveness to genuine trend changes.
// Fourier Smoothing Algorithm
fourier_smooth(src, length) =>
sum = 0
weightSum = 0
for i = 0 to length - 1
weight = cos(2 * π * i / length)
sum += src * weight
weightSum += weight
sum / weightSum
🔶 Intelligent Divergence Detection System
Implements comprehensive divergence analysis using pivot point methodology with configurable lookback periods for both standard and hidden divergence patterns. The system validates divergence conditions through range analysis and provides visual confirmation through plot lines, labels, and color-coded identification for precise timing analysis.
15MIN
4H
12H
🔶 Flow Momentum Analysis Framework
Calculates flow momentum by measuring oscillator deviation from its exponential moving average, providing secondary confirmation of volume flow dynamics. The system creates momentum-based fills and visual indicators that complement the primary oscillator analysis for comprehensive market flow assessment.
🔶 Extreme Zone Detection Engine
Features sophisticated extreme zone identification at ±98 levels with specialized marker system including white X markers for signals occurring in extreme territory and directional triangles for potential reversal points. The system provides clear visual feedback for overbought/oversold conditions with institutional-level threshold accuracy.
🔶 Dynamic Visual Architecture
Provides advanced visualization engine with bullish/bearish color transitions, dynamic fill regions between oscillator and signal lines, and flow momentum overlay with configurable transparency levels. The system includes flip markers aligned to color junction points for precise signal timing with optional bar close confirmation to prevent repainting.
🔶 ADF Trend Filtering Integration
Incorporates Augmented Dickey-Fuller inspired trend filtering using normalized price statistics to enhance signal quality during trending versus ranging market conditions. The system calculates trend factors based on mean deviation and standard deviation analysis for improved oscillator accuracy across market regimes.
🔶 Comprehensive Alert System
Features intelligent multi-tier alert framework covering bullish/bearish flow detection, extreme zone reversals, and divergence confirmations with customizable message templates. The system provides real-time notifications for critical volume flow changes and structural market shifts with exchange and ticker integration.
🔶 Performance Optimization Framework
Utilizes efficient calculation methods with optimized variable management and configurable smoothing parameters to balance signal quality with computational efficiency. The system includes automatic pivot validation and range checking for consistent performance across extended analysis periods with minimal resource usage.
This indicator delivers sophisticated volume-weighted momentum analysis through advanced Fourier smoothing and comprehensive divergence detection capabilities. Unlike traditional volume oscillators that focus solely on volume patterns, the FSVZO integrates volume dynamics with price momentum and statistical trend filtering to provide institutional-grade flow analysis. The system's combination of extreme zone detection, intelligent divergence recognition, and multi-dimensional visual feedback makes it essential for traders seeking systematic approaches to volume-based market analysis across cryptocurrency, forex, and equity markets with clearly defined reversal and continuation signals.

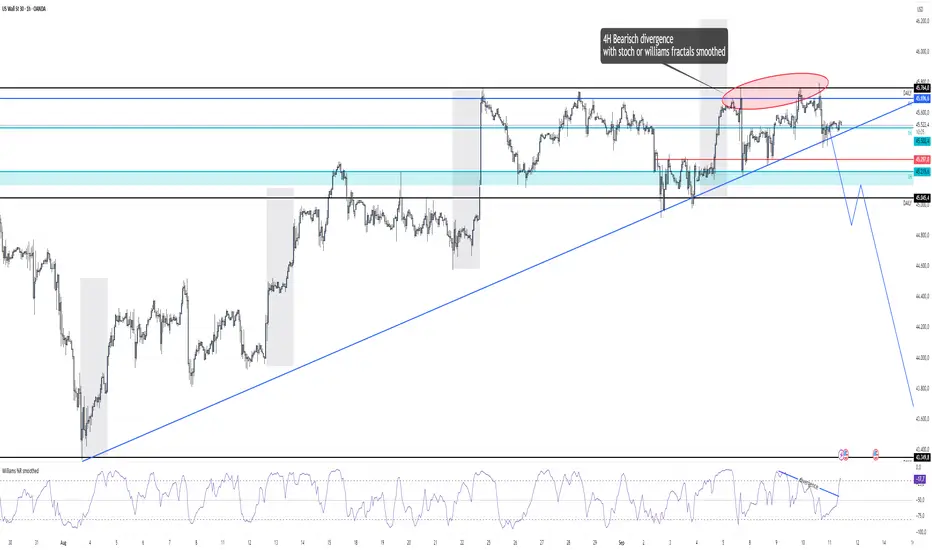
Williams %R smoothed🌍 English Description
Williams %R Smoothed – by Ján Salma
This is the first smoothed version of the Williams %R indicator published on TradingView.
The traditional Williams %R is a momentum oscillator that can be very choppy and noisy. Many traders find it hard to use because of the constant whipsaws.
This indicator solves that problem by applying an EMA smoothing on top of the raw Williams %R values.
Why is this special?
[* ]📉 Reduces noise → much cleaner signal, fewer false spikes.
🔍 Highlights real momentum shifts → easier to spot when the market truly changes direction.
🎯 Customizable smoothing → you decide how sensitive or smooth the curve should be.
⚡ Unique → currently, there is no other smoothed Williams %R available on TradingView.
Settings
Length → default 14 (standard Williams %R period).
Smoothing → default 3 EMA (smooths out the raw values).
Levels: -20 (overbought), -80 (oversold), -50 (mid-level).
This indicator is great for scalpers and swing traders who love Williams %R but hate the noise.
Now you can finally use %R with more confidence and clarity.
--------------------------------------------------------------------
Slovenský popis
Williams %R Smoothed – od Jána Salmu
Toto je prvá vyhladená verzia Williams %R indikátora publikovaná na TradingView.
Klasický Williams %R je oscilátor hybnosti, ktorý je často veľmi „roztrasený“ a plný šumu. Mnoho traderov s ním preto pracuje ťažko, pretože dáva veľa falošných signálov.
Tento indikátor to rieši tak, že na pôvodné hodnoty Williams %R aplikuje EMA vyhladenie .
Čo robí tento indikátor výnimočným?
📉 Redukuje šum → výsledná krivka je čistejšia, s menej falošnými výkyvmi.
🔍 Zvýrazňuje skutočné zmeny hybnosti → jasnejšie vidíš, kedy sa trh naozaj otáča.
🎯 Nastaviteľné vyhladenie → citlivosť indikátora si prispôsobíš podľa seba.
⚡ Unikát → na TradingView zatiaľ neexistuje žiadny iný vyhladený Williams %R.
Nastavenia
Dĺžka → predvolená hodnota 14 (štandardný Williams %R).
Smoothing (EMA) → predvolená hodnota 3 (vyhladenie krivky).
Úrovne: -20 (prekúpený trh), -80 (prepredaný trh), -50 (stredová hodnota).
Tento indikátor je skvelý pre scalperov aj swing traderov, ktorí majú radi Williams %R, ale chcú ho používať s väčšou presnosťou a prehľadnosťou.
RSI ALL INOverbought and Oversold with Candle Pattern Confluences
1. Overbought / Oversold signal only
2. RSI + Engulfing Candle
3. RSI + Hammer/Shooting Star
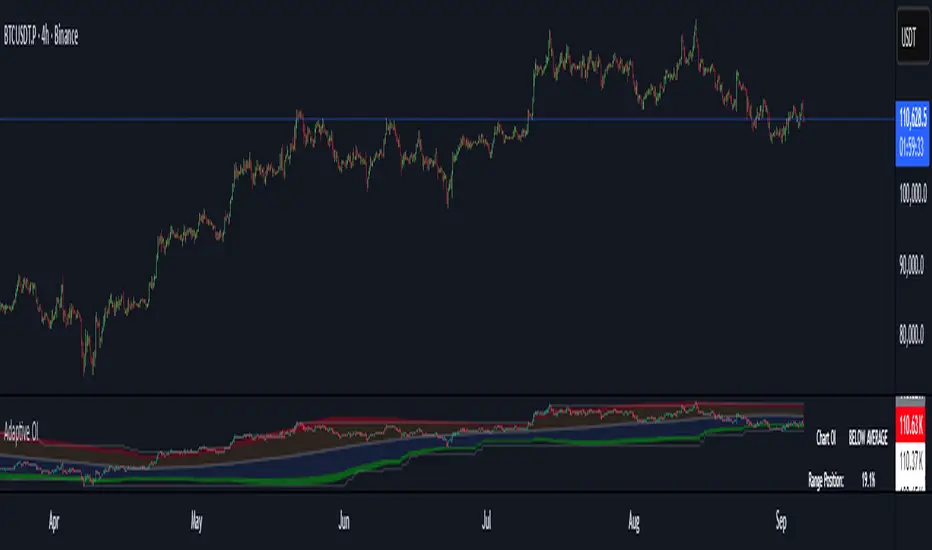
Adaptive Open InterestThis indicator analyzes Bitcoin open interest to identify overbought and oversold conditions that historically precede major price moves. Unlike static levels, it automatically adapts to current market conditions by analyzing the last 320 bars (user adjustable).
How It Works
Adaptive Algorithm:
-Analyzes the last 320 bars of open interest data
-Combines percentile analysis (90th, 80th, 20th, 10th percentiles) with statistical analysis (standard deviations)
-Creates dynamic zones that adjust as market conditions change
Four Key Zones:
🔴 Extreme Overbought (Red) - Major crash risk territory
🟠 Overbought (Orange) - Correction risk territory
🔵 Oversold (Blue) - Opportunity territory
🟢 Extreme Oversold (Green) - Major opportunity territory
For Risk Management:
-When OI enters red zones → Consider reducing long positions, major crash risk
-When OI enters orange zones → Caution, correction likely incoming
For Opportunities:
-When OI enters blue zones → Look for long opportunities
-When OI enters green zones → Strong buying opportunity, major bounce potential
The Table Shows:
-Current status (which zone OI is in)
-Range position (where current OI sits as % of 320-bar range)
-320-bar high/low levels for context
Why It's Effective:
-Adaptive Nature: What's "high" OI in a bear market differs from bull market - the indicator knows the difference and adjusts automatically.
-Proven Approach: Combines multiple statistical methods for robust signals that work across different market cycles.
-Alert System: Optional alerts notify you when OI crosses critical thresholds, so you don't miss important signals.
-The indicator essentially tells you when the futures market is getting "too crowded" (danger) or "too empty" (opportunity) relative to recent history.
Dynamic Value Zone Oscillator (DVZO) - @CRYPTIK1Dynamic Value Zone Oscillator (DVZO) @CRYPTIK1
Introduction: What is the DVZO?
The Dynamic Value Zone Oscillator (DVZO) is a powerful momentum indicator that reframes the classic "overbought" and "oversold" concept. Instead of relying on a fixed lookback period like a standard RSI or Stochastics, the DVZO measures the current price relative to a significant, higher-timeframe Value Zone (e.g., the previous week's entire price range).
This gives you a more contextual and structural understanding of price. The core question it answers is not just "Is the price moving up or down quickly?" but rather, "Where is the current price in relation to its recently established area of value?"
This allows traders to identify true "premium" (overbought) and "discount" (oversold) levels with greater accuracy, leading to higher-probability reversal and trend-following signals.
The Core Concept: Price vs. Value
The market is constantly trying to find equilibrium or "fair value." The DVZO is built on the principle that the high and low of a significant prior period (like the previous day, week, or month) create a powerful area of perceived value.
The Value Zone: The range between the high and low of the selected higher timeframe. The midpoint of this zone is the equilibrium (0 line on the oscillator).
Premium Territory (Distribution Zone): When price breaks above the Value Zone High (+100 line), it is trading at a premium. This is an area where sellers are more likely to become active and buyers may be over-extending.
Discount Territory (Accumulation Zone): When price breaks below the Value Zone Low (-100 line), it is trading at a discount. This is an area where buyers are more likely to see value and sellers may be exhausted.
By anchoring its analysis to these significant structural levels, the DVZO filters out much of the noise from lower-timeframe price fluctuations.
Key Features
The Oscillator:
The main blue line visualizes exactly where the current price is within the context of the Value Zone.
+100: The high of the Value Zone.
0: The midpoint/equilibrium of the Value Zone.
-100: The low of the Value Zone.
Automatic Divergence Detection:
The DVZO automatically identifies and plots bullish and bearish divergences on both the price chart and the oscillator itself.
Bullish Divergence: Price makes a new low, but the DVZO makes a higher low. This is a strong signal that downside momentum is fading and a reversal to the upside is likely.
Bearish Divergence: Price makes a new high, but the DVZO makes a lower high. This indicates that upside momentum is waning and a pullback is probable.
Value Migration Histogram:
The purple histogram in the background visualizes the width of the Value Zone.
Expanding Histogram: Volatility is increasing, and the accepted value range is getting wider.
Contracting Histogram: Volatility is decreasing, and the price is coiling in a tight range, often in anticipation of a major breakout.
How to Use the DVZO: Trading Strategies
1. Reversion Trading
This is the most direct way to use the indicator.
Look for Buys: When the DVZO line drops below -100, the price is in the "Accumulation Zone." Wait for the price to show signs of strength (e.g., a bullish candle pattern) and the DVZO line to start turning back up towards the -100 level. This is a high-probability mean reversion setup.
Look for Sells: When the DVZO line moves above +100, the price is in the "Distribution Zone." Look for signs of weakness (e.g., a bearish engulfing candle) and the DVZO line to start turning back down towards the +100 level.
2. Divergence Trading
Divergences are powerful confirmation signals.
Entry Signal: When a Bullish Divergence appears, it provides a strong entry signal for a long position, especially if it occurs within the Accumulation Zone (below -100).
Exit/Short Signal: When a Bearish Divergence appears, it can serve as a signal to take profit on long positions or to look for a short entry, especially if it occurs in the Distribution Zone (above +100).
3. Best Practices & Settings
Timeframe Synergy: The DVZO is most effective when your chart timeframe is lower than your selected Value Zone Source.
For Day Trading (e.g., 1H, 4H chart): Use the "Previous Day" Value Zone.
For Swing Trading (e.g., 1D, 12H chart): Use the "Previous Week" or "Previous Month" Value Zone.
Confirmation is Key: The DVZO is a powerful tool, but it should not be used in isolation. Always combine its signals with other forms of analysis, such as market structure, support/resistance levels, and candlestick patterns, for confirmation.
EMA Oscillator [Alpha Extract]A precision mean reversion analysis tool that combines advanced Z-score methodology with dual threshold systems to identify extreme price deviations from trend equilibrium. Utilizing sophisticated statistical normalization and adaptive percentage-based thresholds, this indicator provides high-probability reversal signals based on standard deviation analysis and dynamic range calculations with institutional-grade accuracy for systematic counter-trend trading opportunities.
🔶 Advanced Statistical Normalization
Calculates normalized distance between price and exponential moving average using rolling standard deviation methodology for consistent interpretation across timeframes. The system applies Z-score transformation to quantify price displacement significance, ensuring statistical validity regardless of market volatility conditions.
// Core EMA and Oscillator Calculation
ema_values = ta.ema(close, ema_period)
oscillator_values = close - ema_values
rolling_std = ta.stdev(oscillator_values, ema_period)
z_score = oscillator_values / rolling_std
🔶 Dual Threshold System
Implements both statistical significance thresholds (±1σ, ±2σ, ±3σ) and percentage-based dynamic thresholds calculated from recent oscillator range extremes. This hybrid approach ensures consistent probability-based signals while adapting to varying market volatility regimes and maintaining signal relevance during structural market changes.
// Statistical Thresholds
mild_threshold = 1.0 // ±1σ (68% confidence)
moderate_threshold = 2.0 // ±2σ (95% confidence)
extreme_threshold = 3.0 // ±3σ (99.7% confidence)
// Percentage-Based Dynamic Thresholds
osc_high = ta.highest(math.abs(z_score), lookback_period)
mild_pct_thresh = osc_high * (mild_pct / 100.0)
moderate_pct_thresh = osc_high * (moderate_pct / 100.0)
extreme_pct_thresh = osc_high * (extreme_pct / 100.0)
🔶 Signal Generation Framework
Triggers buy/sell alerts when Z-score crosses extreme threshold boundaries, indicating statistically significant price deviations with high mean reversion probability. The system generates continuation signals at moderate levels and reversal signals at extreme boundaries with comprehensive alert integration.
// Extreme Signal Detection
sell_signal = ta.crossover(z_score, selected_extreme)
buy_signal = ta.crossunder(z_score, -selected_extreme)
// Dynamic Color Coding
signal_color = z_score >= selected_extreme ? #ff0303 : // Extremely Overbought
z_score >= selected_moderate ? #ff6a6a : // Overbought
z_score >= selected_mild ? #b86456 : // Mildly Overbought
z_score > -selected_mild ? #a1a1a1 : // Neutral
z_score > -selected_moderate ? #01b844 : // Mildly Oversold
z_score > -selected_extreme ? #00ff66 : // Oversold
#00ff66 // Extremely Oversold
🔶 Visual Structure Analysis
Provides a six-tier color gradient system with dynamic background zones indicating mild, moderate, and extreme conditions. The histogram visualization displays Z-score intensity with threshold reference lines and zero-line equilibrium context for precise mean reversion timing.
snapshot
4H
1D
🔶 Adaptive Threshold Selection
Features intelligent threshold switching between statistical significance levels and percentage-based dynamic ranges. The percentage system automatically adjusts to current volatility conditions using configurable lookback periods, while statistical thresholds maintain consistent probability-based signal generation across market cycles.
🔶 Performance Optimization
Utilizes efficient rolling calculations with configurable EMA periods and threshold parameters for optimal performance across all timeframes. The system includes comprehensive alert functionality with customizable notification preferences and visual signal overlay options.
🔶 Market Oscillator Interpretation
Z-score > +3σ indicates statistically significant overbought conditions with high reversal probability, while Z-score < -3σ signals extreme oversold levels suitable for counter-trend entries. Moderate thresholds (±2σ) capture 95% of normal price distributions, making breaches statistically significant for systematic trading approaches.
snapshot
🔶 Intelligent Signal Management
Automatic signal filtering prevents false alerts through extreme threshold crossover requirements, while maintaining sensitivity to genuine statistical deviations. The dual threshold system provides both conservative statistical approaches and adaptive market condition responses for varying trading styles.
Why Choose EMA Oscillator ?
This indicator provides traders with statistically-grounded mean reversion analysis through sophisticated Z-score normalization methodology. By combining traditional statistical significance thresholds with adaptive percentage-based extremes, it maintains effectiveness across varying market conditions while delivering high-probability reversal signals based on quantifiable price displacement from trend equilibrium, enabling systematic counter-trend trading approaches with defined statistical confidence levels and comprehensive risk management parameters.

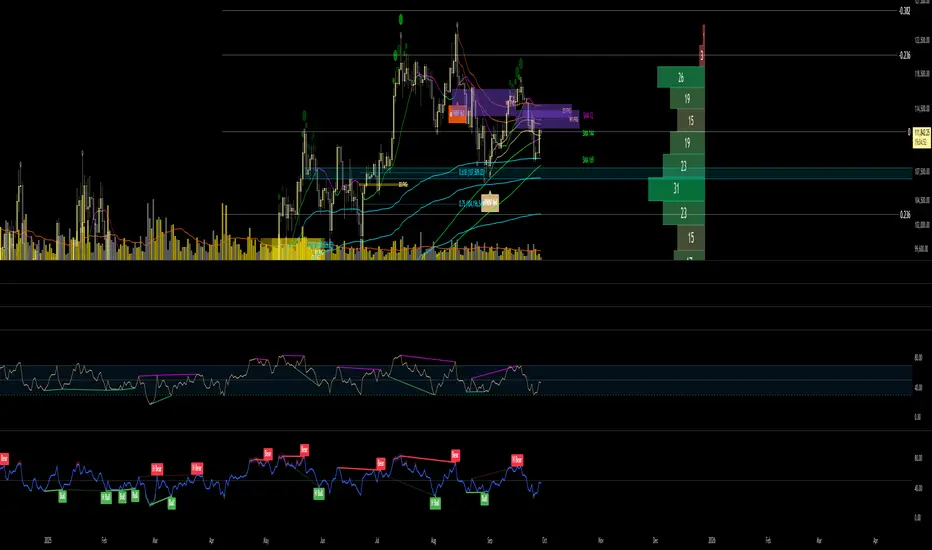
Fundur - Market Sentiment BIndicator Overview
The Market Sentiment B indicator is a sophisticated multi-timeframe momentum oscillator that provides comprehensive market analysis through advanced wave theory and sentiment measurement. Unlike traditional single-timeframe indicators, Market Sentiment B analyzes 11 different timeframes simultaneously to create a unified view of market momentum and sentiment.
What Makes Market Sentiment B Unique
Multi-Timeframe Convergence : The indicator combines data from 11 different periods (8, 13, 21, 34, 55, 89, 144, 233, 377, 610, 987) based on mathematical sequences that naturally occur in market cycles.
Advanced Wave Analysis : The histogram component tracks momentum waves with precise peak and trough identification, allowing traders to spot both major moves and smaller precursor waves.
Sentiment Extremes Detection : When all 11 timeframes reach extreme levels simultaneously, the indicator highlights these rare conditions with background coloring, signaling potential major reversals.
Dynamic Zone Analysis : The indicator divides market conditions into Premium (80+), Discount (20-), and Liquidity zones (40-60), providing clear context for trade entries and exits.
Core Components
1. Market Sentiment B Line (Main Signal)
The primary oscillator line that represents the averaged sentiment across all timeframes. This line uses advanced mathematical filtering to smooth out noise while preserving important trend changes.
Key Features:
Oscillates between 0-100
Color-coded: Green when rising, Red when falling
Shows divergences with colored dots
Premium zone: 80+, Discount zone: 20-
2. Momentum Waves (Secondary Signal)
A smoothed version of the Market Sentiment B line that acts as a trend-following component. This line helps identify the underlying momentum direction.
Key Features:
Blue coloring during bullish expansion (above 50 and rising)
Orange coloring during bearish expansion (below 50 and falling)
Filled areas show expansion and contraction phases
Critical 50-line crossovers signal momentum shifts
3. Histogram (Wave Analysis)
The difference between Market Sentiment B and Momentum Waves, displayed as a histogram that reveals the relationship between current sentiment and underlying momentum.
Key Features:
Green bars: Positive momentum (Market Sentiment above Momentum Waves)
Red bars: Negative momentum (Market Sentiment below Momentum Waves)
Wave height labels show the strength of each wave
Divergence patterns identify potential reversals
4. Divergence System
Advanced divergence detection that identifies both regular and hidden divergences, with special "Golden Divergences" for the strongest signals.
Types:
Regular Divergences : Price makes new highs/lows while indicator doesn't
Hidden Divergences : Continuation patterns in trending markets
Golden Divergences : High-probability reversal signals (orange dots)
5. Zone Analysis
The indicator divides market conditions into distinct zones:
Premium Zone (80-100) : Potential selling area
Liquidity Zone (40-60) : Neutral/consolidation area (highlighted in orange)
Discount Zone (0-20) : Potential buying area
Extreme Conditions : Background coloring when all timeframes align
Setup Guide
Initial Installation
Open TradingView and navigate to your desired chart
Click the "Indicators" button or press "/" key
Search for "Fundur - Market Sentiment B"
Click on the indicator to add it to your chart
The indicator will appear in a separate pane below your chart
Essential Settings Configuration
Main Settings
Show Histogram Wave Values : Enable to see wave strength numbers
Wave Value Text Size : Choose from tiny, small, normal, or large
Wave Label Offset : Adjust label positioning (default: 2)
Market Sentiment Thresholds
Only Show Indicators at Market Sentiment Extremes : Filter signals to extreme zones only
Extreme levels are automatically set at 80 (high) and 20 (low)
Small Wave Strategy
Enable Small Wave Swing Strategy : Focus on smaller, early-warning waves
Small Wave Label Color : Customize the color for small wave labels
Divergence Analysis
Show Regular Divergences : Enable standard divergence detection
Show Gold Divergence Dots : Enable high-probability golden signals
Show Divergence Dots : Show all divergence markers
Histogram Settings
Enable Histogram : Toggle the histogram display
Divergence Types : Choose which types to display (Bullish/Bearish Reversals and Continuations)
Recommended Initial Setup
Enable all main components (Histogram, Divergences, Momentum Waves)
Set wave value text size to "small" for clarity
Enable golden divergence dots for premium signals
Start with all alert categories enabled, then customize based on your trading style
Basic Trading Guide
Understanding the Zones
Premium Zone Trading (80-100)
When to Consider Selling:
Market Sentiment B enters 80+ zone
Bearish divergences appear
Histogram shows weakening momentum (smaller green waves)
Background turns red (extreme conditions)
What to Look For:
Bearish pivot signals (orange triangles pointing down)
Golden divergence dots at tops
Momentum Waves turning bearish
Discount Zone Trading (0-20)
When to Consider Buying:
Market Sentiment B enters 0-20 zone
Bullish divergences appear
Histogram shows strengthening momentum (smaller red waves)
Background turns green (extreme conditions)
What to Look For:
Bullish pivot signals (blue triangles pointing up)
Golden divergence dots at bottoms
Momentum Waves turning bullish
Liquidity Zone Trading (40-60)
Consolidation and Breakout Zone:
Orange-filled area indicates neutral sentiment
Wait for clear breaks above 60 or below 40
Use for range-bound trading strategies
Look for momentum wave direction changes
Key Signal Types
1. Zone Crossovers
Above 60 : Bullish momentum building
Below 40 : Bearish momentum building
50-line crosses : Primary trend changes
2. Divergence Signals
Golden dots : Strongest reversal signals that align accross different timeframes
Colored dots : Standard divergence warnings
Hidden divergences : Trend continuation signals
3. Histogram Patterns
Increasing green bars : Building bullish momentum
Increasing red bars : Building bearish momentum
Smaller waves : Early warning signals of deteriorating interest
Basic Entry Rules
Long Entries
Market Sentiment B in discount zone (0-20) OR
Bullish divergence confirmed OR
Break above 40 from oversold conditions OR
Golden divergence dot at bottom
Short Entries
Market Sentiment B in premium zone (80-100) OR
Bearish divergence confirmed OR
Break below 60 from overbought conditions OR
Golden divergence dot at top
Exit Rules
Exit longs when entering premium zone
Exit shorts when entering discount zone
Close positions on opposite divergence signals
Use histogram wave tops/bottoms for fine-tuning exits
Advanced Analysis Setups
Setup 1: Scalping Configuration
Purpose : Quick intraday trades focusing on small moves
Settings :
Enable Small Wave Strategy
Show indicators only at extremes: OFF
Combine multiple alerts: ON
Focus on 1-5 minute timeframes
Signals to Watch :
Small wave histogram peaks/troughs
Quick zone crossovers (40/60 line breaks)
Momentum wave direction changes
Short-term divergences
Setup 2: Swing Trading Configuration
Purpose : Medium-term trend following and reversal trading
Settings :
Show indicators only at extremes: ON
Enable all divergence types
Focus on 15-minute to 4-hour timeframes
Golden divergence alerts: HIGH priority
Signals to Watch :
Premium/discount zone entries
Golden divergence signals
Extreme condition backgrounds
Major histogram wave formations
Setup 3: Position Trading Configuration
Purpose : Long-term trend identification and major reversal spots
Settings :
Only alert in extremes: ON
Focus on golden divergences only
Use daily and weekly timeframes
Minimize noise with extreme filtering
Signals to Watch :
Extreme condition backgrounds (red/green)
Major golden divergence signals
Long-term momentum wave trends
Weekly/monthly zone transitions
Setup 4: Reversal Hunting Configuration
Purpose : Catching major market turns at key levels
Settings :
Enable all divergence types
Show golden divergence dots: ON
Extreme filtering: ON
Small wave strategy: OFF
Signals to Watch :
Multiple divergence confirmations
Golden divergence + extreme zones
All-timeframe extreme conditions
Major histogram wave exhaustion
Setup 5: Trend Following Configuration
Purpose : Riding momentum in established trends
Settings :
Momentum waves: HIGH priority
Hidden divergences: ON
Continuation patterns focus
Zone crossover alerts
Signals to Watch :
Momentum wave expansion phases
Hidden divergence continuations
Liquidity zone breakouts
Sustained momentum patterns
Alert System
The Market Sentiment B indicator features a comprehensive alert system with over 30 different alert types organized into logical categories.
Alert Categories
Market Sentiment B Line Alerts
Golden Divergences : Highest priority reversal signals
Standard Divergences : Regular divergence patterns
Bearish/Bullish Pivots : Momentum pivot points
Premium/Discount Zone : Zone entry/exit alerts
Extreme Conditions : Rare all-timeframe extremes
Liquidity Zone : 40-60 zone movement alerts
Momentum Waves Alerts
Premium/Discount Zones : 80+/20- level alerts
Liquidity Zone Movement : 40-60 zone alerts
Expansion Phases : Bullish/bearish expansion alerts
Direction Changes : 50-line crossover alerts
Cross Alerts : MSB vs Momentum crossovers
Histogram Alerts
State Changes : Bullish/bearish turns
Peak/Trough Detection : Wave top/bottom alerts
Divergence Alerts : Histogram-specific divergences
Hidden Divergences : Continuation pattern alerts
Smaller Wave Alerts : Early warning signals
Alert Configuration Tips
For Day Trading
Enable quick state change alerts
Focus on histogram and small wave alerts
Use combined alerts to reduce noise
Disable extreme-only filtering
For Swing Trading
Enable zone crossover alerts
Focus on divergence and pivot alerts
Use extreme-only filtering
Prioritize golden divergence alerts
For Position Trading
Enable only golden divergences and extreme conditions
Use extreme-only filtering
Focus on major zone transitions
Disable minor wave alerts
Trading Strategies
Strategy 1: Premium/Discount Zone Reversal
Setup : Wait for Market Sentiment B to reach extreme zones
Entry :
Long: Enter discount zone (0-20) with bullish divergence
Short: Enter premium zone (80-100) with bearish divergence
Exit : Opposite zone reached or momentum wave reversal
Risk Management : Stop loss at recent swing high/low
Strategy 2: Golden Divergence Power Plays
Setup : Wait for golden divergence dots to appear
Entry : Enter in direction opposite to divergence (reversal play)
Confirmation : Wait for momentum wave to confirm direction
Exit : When sentiment reaches opposite zone
Risk Management : Tight stops below/above divergent pivot
Strategy 3: Momentum Wave Trend Following
Setup : Identify strong momentum wave expansion phases
Entry : Enter on pullbacks to 50-line during expansion
Continuation : Hold while expansion phase continues
Exit : When expansion phase ends or opposite expansion begins
Risk Management : Trail stops using wave peaks/troughs
Strategy 4: Small Wave Early Entry
Setup : Enable Small Wave Strategy for early signals
Entry : Enter on small wave formations before major moves
Confirmation : Wait for main sentiment line to follow
Exit : When major wave forms or opposite signal appears
Risk Management : Quick exits if main indicator doesn't confirm
Strategy 5: Extreme Condition Contrarian
Setup : Wait for background color changes (extreme conditions)
Entry : Counter-trend when ALL timeframes are extreme
Confirmation : Look for early divergence signs
Exit : When background color disappears
Risk Management : Position size smaller due to counter-trend nature
FAQ & Troubleshooting
Frequently Asked Questions
Q: Why don't I see any signals on my chart?
A: Check if "Only Show Indicators at Market Sentiment Extremes" is enabled. If so, signals only appear when the indicator is above 80 or below 20.
Q: What's the difference between golden and standard divergences?
A: Golden divergences (orange dots) are higher-probability signals that meet additional criteria for strength and momentum alignment. Standard divergences are regular price/indicator disagreements.
Q: How do I reduce alert noise?
A: Enable "Only Alert In Extremes" in the alert settings, or use "Combine Multiple Alerts" to consolidate multiple signals into single messages.
Q: What timeframe works best with this indicator?
A: The indicator works on all timeframes. For day trading, use 1-15 minutes. For swing trading, use 1-4 hours. For position trading, use daily or weekly.
Q: Why are the histogram wave values important?
A: Wave values show the strength of momentum. Declining wave values (smaller peaks) often precede trend changes, while increasing values confirm trend strength.
Troubleshooting Common Issues
Issue: Indicator not loading
Solution: Ensure you're using TradingView Pro or higher
Check that max_bars_back is set appropriately
Refresh the chart and re-add the indicator
Issue: Too many alerts firing
Solution: Enable extreme-only filtering
Disable less important alert categories
Use combined alerts feature
Issue: Missing divergence signals
Solution: Check that divergence detection is enabled
Ensure you're looking in the correct zones
Verify that extreme filtering isn't hiding signals
Issue: Histogram not displaying
Solution: Check that "Enable Histogram" is turned ON
Verify histogram divergence types are enabled
Ensure the chart has sufficient historical data
Best Practices
Start Simple : Begin with basic zone trading before using advanced features
Paper Trade First : Test strategies with paper trading before risking capital
Combine with Price Action : Use the indicator alongside support/resistance levels
Respect Risk Management : Never risk more than you can afford to lose
Keep Learning : Market conditions change; adapt your usage accordingly
Performance Optimization
Use appropriate timeframes for your trading style
Enable only necessary alert types
Consider using extreme filtering during high-volatility periods
Regularly review and adjust settings based on market conditions
Conclusion
The Market Sentiment B indicator represents a sophisticated approach to market analysis, combining multiple timeframes, advanced wave theory, and comprehensive divergence detection into a single powerful tool. Whether you're a scalper looking for quick opportunities or a position trader seeking major reversals, this indicator provides the insights needed to make informed trading decisions.
Remember that no indicator is perfect, and the Market Sentiment B should be used as part of a comprehensive trading plan that includes proper risk management, fundamental analysis awareness, and sound money management principles.
Happy Trading!
Disclaimer: Trading involves substantial risk and is not suitable for all investors. Past performance is not indicative of future results. Always practice proper risk management and never trade with money you cannot afford to lose.

Mayfair Reversal Change✅ Mayfair Reversal Change — By EastWave Capital
Description:
The Mayfair Reversal Change indicator is a tool designed to help traders identify potential market turning points using Stochastic Oscillator behavior and filtered price action logic. It acts as a reversal signal filter and is particularly effective when the market is overextended (overbought/oversold) and about to revert from exhaustion zones.
🔍 How It Works:
This script monitors the Stochastic %K and %D crossovers and adds a custom logic layer to filter only high-quality reversal points:
Stochastic Filter Conditions:
Uses smoothed stochastic settings:
%K smoothing = 3
%D smoothing = 3
Only shows signals after %K crosses back below 80 (for Sell) or above 20 (for Buy)
This prevents signals from appearing too early during an active overbought or oversold phase.
Directional Confirmation Logic:
Bullish signal is printed only when %K re-enters below 20 after a confirmed stochastic crossover.
Bearish signal appears only when %K re-enters above 80.
This reduces false signals that occur during continued trending moves.
Toggle Switch:
A user-toggle input is included to enable or disable the reversal filter logic.
This gives flexibility for traders who want to test signals with or without the stochastic condition.
📈 How to Use:
Timeframes: Recommended for 5M, 15M, and 30M
Markets: Compatible with any market — FX, Gold, Indices, Crypto
Entry Approach:
Wait for signal after price has reached a potential extreme area.
Confirm with chart structure, support/resistance, or SMC zone.
Enter on confirmation, placing stop loss beyond the swing high/low.
Combine with trendline breaks or price imbalances (FVG) for extra confluence.
Can be used in combination with the Mayfair FX Scalper script for dual-layer confirmation.
⚠️ Important Notes:
Signals are visual only and should be confirmed with proper strategy.
This indicator does not execute or manage trades automatically.
Designed to assist with reversal setups but should not be used in isolation.
Always manage risk, use SL/TP, and avoid over-leveraging.

AMV Volume AssistantThe AMV Volume Assistant is a custom tool that visualizes volume delta strength using percentile-based scoring. It helps identify potential overbought and oversold conditions by measuring how strong recent buying or selling pressure is compared to historical volume behavior.
What it does:
Tracks delta accumulation using lower timeframe data split into buying and selling volume based on candle direction.
Converts this accumulation into a percentile score to show relative strength or weakness.
Colors the background green or red when the smoothed score crosses key thresholds (+3 or -3), highlighting moments of possible volume exhaustion or continuation.
Use case:
This tool is useful for intraday traders who want a simple way to spot strong buying or selling pressure and assess when the move may be overextended. It works best as a supporting indicator alongside your main strategy or trend framework.
This tool works best on futures such as CME_MINI:NQ1! due to the accuracy of volume data provided.
IMPORTANT: On lower tf's such as the 1 minute timeframes, 5s data is needed so a premium subscription is required for the use of this indicator.

[ BETA ][ IND ][ LIB ] Dynamic LookBack RSI RangeGet visual confirmation with this indicator if the current range selected had been oversold or overbough in the latest n bars

Volume Overbought/Oversold Zones📊 What You’ll See on the Chart
Red Background or Red Triangle ABOVE a Candle
🔺 Means: Overbought Volume
→ Volume on that bar is much higher than average (as defined by your settings).
→ Suggests strong activity, possible exhaustion in the trend or an emotional spike.
→ It’s a warning: consider watching for signs of reversal, especially if price is already stretched.
Green Background or Green Triangle BELOW a Candle
🔻 Means: Oversold Volume
→ Volume on that bar is much lower than normal.
→ Suggests the market may be losing momentum, or few sellers are left.
→ Could signal an upcoming reversal or recovery if confirmed by price action.
Orange Line Below the Candles (Volume Moving Average)
📈 Shows the "normal" average volume over the last X candles (default is 20).
→ Helps you visually compare each bar’s volume to the average.
Gray Columns (Actual Volume Bars)
📊 These are your regular volume bars — they rise and fall based on how active each candle is.
🔍 What This Indicator Does (In Simple Words)
This indicator looks at trading volume—which is how many shares/contracts were traded in a given period—and compares it to what's considered "normal" for recent history. When volume is unusually high or low, it highlights those moments on the chart.
It tells you:
• When volume is much higher than normal → market might be overheated or experiencing a buying/selling frenzy.
• When volume is much lower than normal → market might be quiet, potentially indicating lack of interest or indecision.
These conditions are marked visually, so you can instantly spot them.
💡 How It Helps You As a Trader
1. Spotting Exhaustion in Trends (Overbought Signals)
If a market is going up and suddenly volume spikes way above normal, it may mean:
• The move is getting crowded (lots of buyers are already in).
• A reversal or pullback could be near because smart money may be taking profits.
Trading idea: Wait for high-volume up bars, then look for price weakness to consider a short or exit.
2. Identifying Hidden Opportunities (Oversold Signals)
If price is falling but volume drops unusually low, it might mean:
• Panic is fading.
• Sellers are losing energy.
• A bounce or trend reversal could happen soon.
Trading idea: After a volume drop in a downtrend, watch for bullish price patterns or momentum shifts to consider a buy.
3. Confirming or Doubting Breakouts
Volume is critical for confirming breakouts:
• If price breaks a key level with strong volume, it's more likely to continue.
• A breakout without volume could be a fake-out.
This indicator highlights volume surges that can help you confirm such moves.
📈 How to Use It in Practice
• Combine it with candlestick patterns, support/resistance, or momentum indicators.
• Use the background colors or shapes as a visual cue to pause and analyze.
• Adjust the sensitivity to suit fast-moving markets (like crypto) or slow ones (like large-cap stocks).

Aqua MTF Stochastic Oscillator——————————————————————————————————————————————————————————
The Aqua Multi-Timeframe (MTF) Stochastic Oscillator is a comprehensive momentum analysis tool that synthesizes
stochastic data from up to five distinct, user-configurable sources and timeframes into a single, unified view.
--- CORE CONCEPT ---
Traditional oscillators provide insight into one specific timeframe. This indicator overcomes that limitation by
aggregating momentum readings from multiple timeframes. The core principle is to gauge the confluence of momentum
across different market cycles. A strong trend is often characterized by aligned momentum across short-term,
medium-term, and long-term perspectives. This tool visualizes that alignment in a clear, intuitive oscillator.
--- METHODOLOGY ---
For each of the five analysis slots, the script calculates the Stochastic %K line and its corresponding %D signal line.
To allow for direct comparison and weighting, each of these standard 0-100 oscillator values is then normalized
to a bipolar scale of -100 to +100, where 0 represents the neutral midline.
These normalized scores are then blended, according to user-defined weights, into two master composite lines:
1. A master "Score Line" representing the weighted average of the raw %K momentum values.
2. A master "Signal Line" representing the weighted average of the smoothed %D signal values.
--- KEY FEATURES ---
• Multi-Timeframe & Multi-Symbol Analysis: Configure up to five slots, each with its own symbol, timeframe, price source, and stochastic settings.
• Normalized Momentum Scale: All stochastic values are re-scaled to a -100 to +100 range, providing a standardized measure of momentum. Values above 0 indicate bullish momentum, while values below 0 indicate bearish momentum.
• Weighted Composite Score: User-defined weights allow for prioritizing certain timeframes, creating a custom-tailored final momentum reading.
• Dynamic Color-Coding: The color of the master Score Line and each individual timeframe's line instantly changes based on its position relative to its signal line (%K vs. %D). This provides immediate visual feedback on momentum acceleration (bullish) or deceleration (bearish).
--- HOW TO INTERPRET ---
• Crossovers: The interaction between the master Score Line and the Signal Line can be used to identify potential shifts in momentum, similar to a traditional MACD.
• Line Color: The color of the master Score Line itself serves as a primary signal. A bullish color indicates that overall raw momentum is leading smoothed momentum, and vice-versa.
• Overbought/Oversold Levels: Extreme readings near the +100 or -100 levels suggest that the aggregated momentum may be overextended and due for a reversion.
• Zero Line Crosses: When the oscillator crosses above the zero line, it signals that the balance of momentum has shifted to positive territory. A cross below zero signals a shift to negative territory.
• Divergence: Look for divergences where price makes a new high or low, but the oscillator fails to confirm it. This can often signal a pending reversal.
Author: Aquaritek
——————————————————————————————————————————————————————————

Intermarket Correlation Oscillator (ICO)The Intermarket Correlation Oscillator (ICO) is a TradingView indicator that helps traders analyze the relationship between two assets, such as stocks, indices, or cryptocurrencies, by measuring their price correlation. It displays this correlation as an oscillator ranging from -1 to +1, making it easy to spot whether the assets move together, oppositely, or independently. A value near +1 indicates strong positive correlation (assets move in the same direction), near -1 shows strong negative correlation (opposite movements), and near 0 suggests no correlation. This tool is ideal for confirming trends, spotting divergences, or identifying hedging opportunities across markets.
How It Works?
The ICO calculates the Pearson correlation coefficient between the chart’s primary asset (e.g., Apple stock) and a secondary asset you choose (e.g., SPY for the S&P 500) over a specified number of bars (default: 20). The oscillator is plotted in a separate pane below the chart, with key levels at +0.8 (overbought, strong positive correlation) and -0.8 (oversold, strong negative correlation). A midline at 0 helps gauge neutral correlation. When the oscillator crosses these levels or the midline, labels ("OB" for overbought, "OS" for oversold) and alerts notify you of significant shifts. Shaded zones highlight extreme correlations (red for overbought, green for oversold) if enabled.
Why Use the ICO?
Trend Confirmation: High positive correlation (e.g., SPY and QQQ both rising) confirms market trends.
Divergence Detection: Negative correlation (e.g., DXY rising while stocks fall) signals potential reversals.
Hedging: Identify negatively correlated assets to balance your portfolio.
Market Insights: Understand how assets like stocks, bonds, or crypto interact.
Easy Steps to Use the ICO in TradingView
Add the Indicator:
Open TradingView and load your chart (e.g., AAPL on a daily timeframe).
Go to the Pine Editor at the bottom of the TradingView window.
Copy and paste the ICO script provided earlier.
Click "Add to Chart" to display the oscillator below your price chart.
Configure Settings:
Click the gear icon next to the indicator’s name in the chart pane to open settings.
Secondary Symbol: Choose an asset to compare with your chart’s symbol (e.g., "SPY" for S&P 500, "DXY" for USD Index, or "BTCUSD" for Bitcoin). Default is SPY.
Correlation Lookback Period: Set the number of bars for calculation (default: 20). Use 10-14 for short-term trading or 50 for longer-term analysis.
Overbought/Oversold Levels: Adjust thresholds (default: +0.8 for overbought, -0.8 for oversold) to suit your strategy. Lower values (e.g., ±0.7) give more signals.
Show Midline/Zones: Check boxes to display the zero line and shaded overbought/oversold zones for visual clarity.
Interpret the Oscillator:
Above +0.8: Strong positive correlation (red zone). Assets move together.
Below -0.8: Strong negative correlation (green zone). Assets move oppositely.
Near 0: No clear relationship (midline reference).
Labels: "OB" or "OS" appears when crossing overbought/oversold levels, signaling potential correlation shifts.
Set Up Alerts:
Right-click the indicator, select "Add Alert."
Choose conditions like "Overbought Alert" (crossing above +0.8), "Oversold Alert" (crossing below -0.8), or zero-line crossings for bullish/bearish correlation shifts.
Configure notifications (e.g., email, SMS) to stay informed.
Apply to Trading:
Use positive correlation to confirm trades (e.g., buy AAPL if SPY is rising and correlation is high).
Spot divergences for reversals (e.g., stocks dropping while DXY rises with negative correlation).
Combine with other indicators like RSI or moving averages for stronger signals.
Tips for New Users
Start with related assets (e.g., SPY and QQQ for tech stocks) to see clear correlations.
Test on a demo account to understand signals before trading live.
Be aware that correlation is a lagging indicator; confirm signals with price action.
If the secondary symbol doesn’t load, ensure it’s valid on TradingView (e.g., use correct ticker format).
The ICO is a powerful, beginner-friendly tool to explore intermarket relationships, enhancing your trading decisions with clear visual cues and alerts.

MVRV Ratio [Alpha Extract]The MVRV Ratio Indicator provides valuable insights into Bitcoin market cycles by tracking the relationship between market value and realized value. This powerful on-chain metric helps traders identify potential market tops and bottoms, offering clear buy and sell signals based on historical patterns of Bitcoin valuation.
🔶 CALCULATION The indicator processes MVRV ratio data through several analytical methods:
Raw MVRV Data: Collects MVRV data directly from INTOTHEBLOCK for Bitcoin
Optional Smoothing: Applies simple moving average (SMA) to reduce noise
Status Classification: Categorizes market conditions into four distinct states
Signal Generation: Produces trading signals based on MVRV thresholds
Price Estimation: Calculates estimated realized price (Current price / MVRV ratio)
Historical Context: Compares current values to historical extremes
Formula:
MVRV Ratio = Market Value / Realized Value
Smoothed MVRV = SMA(MVRV Ratio, Smoothing Length)
Estimated Realized Price = Current Price / MVRV Ratio
Distance to Top = ((3.5 / MVRV Ratio) - 1) * 100
Distance to Bottom = ((MVRV Ratio / 0.8) - 1) * 100
🔶 DETAILS Visual Features:
MVRV Plot: Color-coded line showing current MVRV value (red for overvalued, orange for moderately overvalued, blue for fair value, teal for undervalued)
Reference Levels: Horizontal lines indicating key MVRV thresholds (3.5, 2.5, 1.0, 0.8)
Zone Highlighting: Background color changes to highlight extreme market conditions (red for potentially overvalued, blue for potentially undervalued)
Information Table: Comprehensive dashboard showing current MVRV value, market status, trading signal, price information, and historical context
Interpretation:
MVRV ≥ 3.5: Potential market top, strong sell signal
MVRV ≥ 2.5: Overvalued market, consider selling
MVRV 1.5-2.5: Neutral market conditions
MVRV 1.0-1.5: Fair value, consider buying
MVRV < 1.0: Potential market bottom, strong buy signal
🔶 EXAMPLES
Market Top Identification: When MVRV ratio exceeds 3.5, the indicator signals potential market tops, highlighting periods where Bitcoin may be significantly overvalued.
Example: During bull market peaks, MVRV exceeding 3.5 has historically preceded major corrections, helping traders time their exits.
Bottom Detection: MVRV values below 1.0, especially approaching 0.8, have historically marked excellent buying opportunities.
Example: During bear market bottoms, MVRV falling below 1.0 has identified the most profitable entry points for long-term Bitcoin accumulation.
Tracking Market Cycles: The indicator provides a clear visualization of Bitcoin's market cycles from undervalued to overvalued states.
Example: Following the progression of MVRV from below 1.0 through fair value and eventually to overvalued territory helps traders position themselves appropriately throughout Bitcoin's market cycle.
Realized Price Support: The estimated realized price often acts as a significant
support/resistance level during market transitions.
Example: During corrections, price often finds support near the realized price level calculated by the indicator, providing potential entry points.
🔶 SETTINGS
Customization Options:
Smoothing: Toggle smoothing option and adjust smoothing length (1-50)
Table Display: Show/hide the information table
Table Position: Choose between top right, top left, bottom right, or bottom left positions
Visual Elements: All plots, lines, and background highlights can be customized for color and style
The MVRV Ratio Indicator provides traders with a powerful on-chain metric to identify potential market tops and bottoms in Bitcoin. By tracking the relationship between market value and realized value, this indicator helps identify periods of overvaluation and undervaluation, offering clear buy and sell signals based on historical patterns. The comprehensive information table delivers valuable context about current market conditions, helping traders make more informed decisions about market positioning throughout Bitcoin's cyclical patterns.

Candle Breakout Oscillator [LuxAlgo]The Candle Breakout Oscillator tool allows traders to identify the strength and weakness of the three main market states: bullish, bearish, and choppy.
Know who controls the market at any given moment with an oscillator display with values ranging from 0 to 100 for the three main plots and upper and lower thresholds of 80 and 20 by default.
🔶 USAGE
The Candle Breakout Oscillator represents the three main market states, with values ranging from 0 to 100. By default, the upper and lower thresholds are set at 80 and 20, and when a value exceeds these thresholds, a colored area is displayed for the trader's convenience.
This tool is based on pure price action breakouts. In this context, we understand a breakout as a close above the last candle's high or low, which is representative of market strength. All other close positions in relation to the last candle's limits are considered weakness.
So, when the bullish plot (in green) is at the top of the oscillator (values above 80), it means that the bullish breakouts (close below the last candle low) are at their maximum value over the calculation window, indicating an uptrend. The same interpretation can be made for the bearish plot (in red), indicating a downtrend when high.
On the other hand, weakness is indicated when values are below the lower threshold (20), indicating that breakouts are at their minimum over the last 100 candles. Below are some examples of the possible main interpretations:
There are three main things to look for in this oscillator:
Value reaches extreme
Value leaves extreme
Bullish/Bearish crossovers
As we can see on the chart, before the first crossover happens the bears come out of strength (top) and the bulls come out of weakness (bottom), then after the crossover the bulls reach strength (top) and the bears weakness (bottom), this process is repeated in reverse for the second crossover.
The other main feature of the oscillator is its ability to identify periods of sideways trends when the sideways values have upper readings above 80, and trending behavior when the sideways values have lower readings below 20. As we just saw in the case of bullish vs. bearish, sideways values signal a change in behavior when reaching or leaving the extremes of the oscillator.
🔶 DETAILS
🔹 Data Smoothing
The tool offers up to 10 different smoothing methods. In the chart above, we can see the raw data (smoothing: None) and the RMA, TEMA, or Hull moving averages.
🔹 Data Weighting
Users can add different weighting methods to the data. As we can see in the image above, users can choose between None, Volume, or Price (as in Price Delta for each breakout).
🔶 SETTINGS
Window: Execution window, 100 candles by default
🔹 Data
Smoothing Method: Choose between none or ten moving averages
Smoothing Length: Length for the moving average
Weighting Method: Choose between None, Volume, or Price
🔹 Thresholds
Top: 80 by default
Bottom: 20 by default

Z-Score Trend Monitor [EdgeTerminal]The Z-Score Trend Monitor measures how far the short-term moving average deviates from the long-term moving average using the spread difference of the two — in standardized units. It’s designed to detect overextension, momentum exhaustion, and potential mean-reversion points by converting the spread between two moving averages into a normalized Z-score and tracking its change and direction over time.
The idea behind this is to catch the changes in the direction of a trend earlier than the usual and lagging moving average lines, allowing you to react faster.
The math behind the indicator itself is very simple. We take the simple moving average of the spread between a long term and short term moving average, and divide it by the difference between the spread and spread mean.
This results in a relatively accurate and early acting trend detector that can easily identify overbought and oversold levels in any timeframe. From our own testing, we recommend using this indicator as a trend confirmation tool.
How to Use It:
Keep an eye on the Z-Score or the blue line. When it goes over 2, it indicates an overbought or near top level, and when it goes below -2, it indicates an oversold or near bottom.
When Z-Score returns to zero or grey line, it suggests mean reversion is in progress.
You can also change the Z-Score criteria from 2 and -2 in the settings to any number you’d like for tighter or wider levels.
For scalping and fast trading setups, we recommend shorter SMAs, such as 5 and 20, and for longer trading setups such as swing trades, we recommend 20 and 100.
Settings:
Short SMA: Lookback period of short term simple moving average for the lower side of the SMA spread.
Short Term Weight: Additional weight or multiplier to suppress the short term SMA calculation. This is used to refine the SMA calculation for more granular and edge cases when needed, usually left at 1, meaning it will take the entire given value in the short SMA field.
Long SMA: Lookback period of long term simple moving average for the upper side of the SMA spread.
Long Term Weight: Additional weight or multiplier to suppress the long term SMA calculation. This is used to refine the long SMA calculation for more granular and edge cases when needed, usually left at 1, meaning it will take the entire given value in the long SMA field.
Z-Score Threshold: The threshold for upper (oversold) and lower (overbought) levels. This can also be set individually from the style page.
Z-Score Lookback Window: The lookback period to calculate spread mean and spread standard deviation
