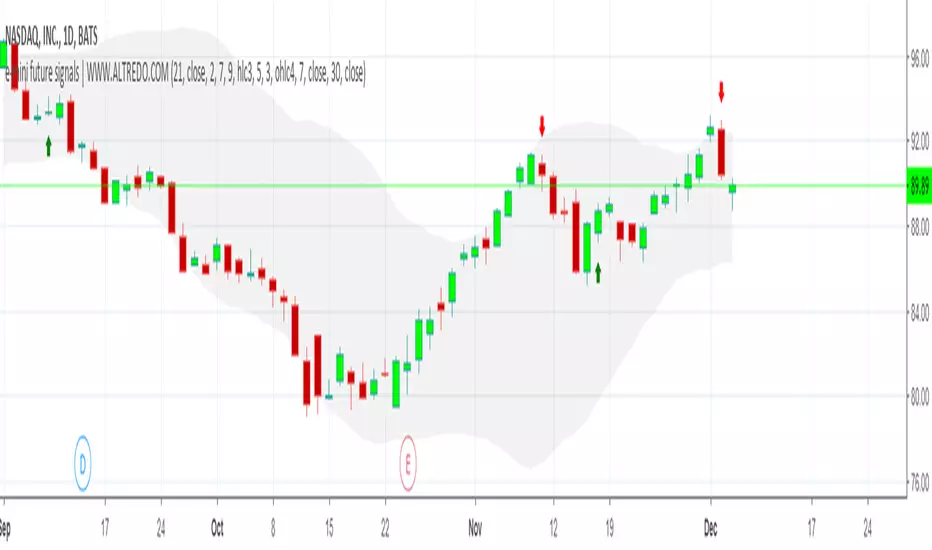
NASDAQ 1D TRADING SIGNALS | DAY TRADING SIGNALSNASDAQ 1D TRADING SIGNALS FOR SHORT-TERM AND MEDIUM-TERM TRADING!
✅ Based on trend analysis, includes Moving Average, Volatility indicators.
✅ This strategy can be used alone or alongside other strategies for better success.
✅ Real-time NASDAQ trading signals
The indicator provides an easy and fast way to determine the trend direction and possible reversals.
Green : Uptrend. Long trading
Red : Downtrend. Short trading
Nasdaq
Stock Market Indices Correlations HeatmapHello friends,
I'm excited to share one of my insightful tools. This indicator visualizes how major global stock indices move relative to your selected instrument, helping you instantly spot market-wide strength, weakness, or divergence.
🛠 How It Works
The indicator calculates Pearson correlation coefficients between your selected symbol and 28 major stock indices , including S&P 500, NASDAQ, DAX, NIKKEI, and many more. Each color is selected according to the correlation value:
Green hues show positive correlations (instruments moving together).
Red hues show negative correlations (instruments moving in opposite directions).
Lighter or transparent colors indicate weak or no correlation.
You can customize the correlation lookback period (default 14 bars ), select your preferred data source (close, open, etc.), and choose from multiple professional color palettes to best match your charting style.
🔥 Key Features
Comprehensive Global Coverage — Correlations across 28 major indices from North America, Europe, and Asia.
Multiple Palettes — Choose from 8 professional color palettes (Blue/Red, Spectral, Viridis, etc.) for better visual clarity.
Adjustable Lookback — Set correlation calculation period from 1 to any number of bars.
Dynamic Data Requests — Real-time updates for all tracked indices using TradingView's request.security.
Smart Alerts — Receive alerts when all indices align positively or negatively — a sign of broad market sentiment extremes.
Performance Optimized — Efficient data handling ensures smooth operation even with multiple requests per bar.
Enhanced UI — Streamlined settings panel for fast palette and source adjustments.
Non-Repainting — Uses only historical data, ensuring stable readings.
If you'd like access or have any questions, feel free to reach out to me directly via DM.
👋 Good luck and happy trading!
สคริปต์แบบชำระเงิน

PPSignal Salper Day (w and M)We have ppsignal day signal, we take daily and monthly signals, when these two intersect they generate atrend signal. ideal to search long signs in indices and actions.
Use with ppsigna trend overlay, hullma cross ordemae with ewo lbr and wave

Dhananjay Volatility stop strategy v1.0
Sharing one more strategy after getting good feedback on my earlier published strategy.
This is simple volatility stop strategy where in we are using VStop as entry and exit point.
Again smart traders can add MA to decide the trend and can avoid trading in opposite direction of trend which will help them to minimize loss making trades.
There are more than 1 parameters which traders can use/change to make this strategy compatible to their instrument.
To understand what is VStop use google.com :-)
Looking forward to receiving feedback from all of you.

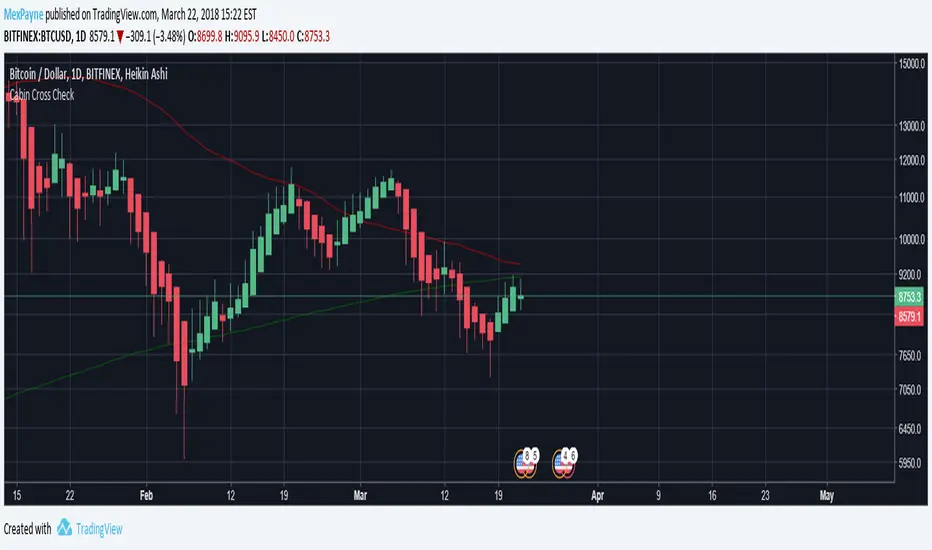
Death Cross - 200 MA / 50 Cross CheckerBITFINEX:BTCUSD
You can check if 200 day MA crossed by 50 day MA. Nuff said.