CFH | RSI-SRSI tableShows RSI and SRSI values on multiple timeframes, highlights oversold and overbought
Timeframes and colors are customizable
/V1llager/
Multitimeframeanalysis

Timeframe Bias TableAllows you to display a bias for the W, D, 4h, 15m & 1m Timeframes based on your own analysis.

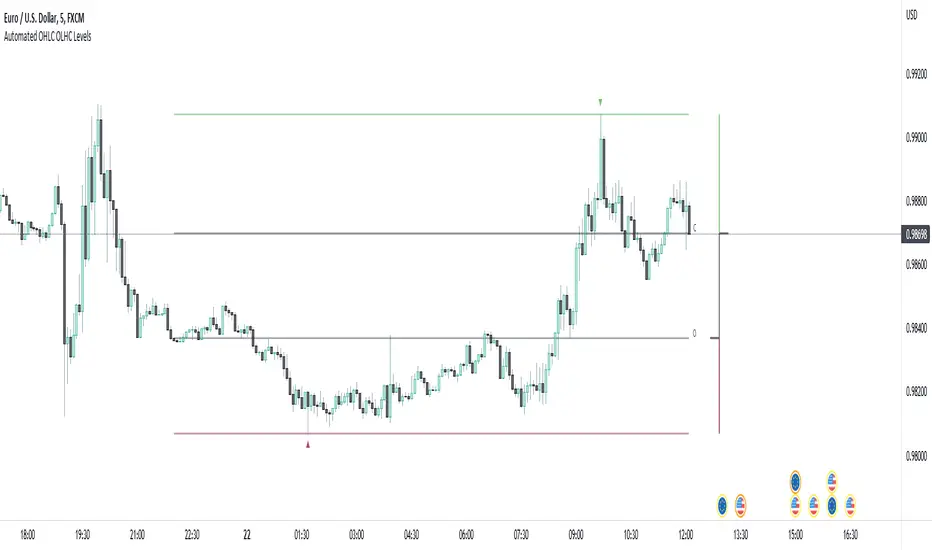
Automated OHLC OLHC LevelsA simple, clean, effective visualization tool, for the OHLC or OLHC of a chosen candle/timeframe.
Apply this indicator using a higher timeframe, in conjunction with other levels and the directional bias, to easily recognize trading opportunities at lower timeframes.
SuperTrend Momentum Chart(My goal creating this indicator) : Provide a quick way to check the current momentum of multiple timeframes. The Smart Momentum Chart was intended to be a live trading tool that should be used when a trader has already defined his edge and no longer needs the past Momentum data.
The Underlying Concept
What is Momentum ?
The Momentum shown is derived from a Mathematical Formula SUPERTREND , when price is above SUPERTREND its bullish Momentum and when its below SUPERTREND its Bearish Momentum. This indicator scans for candle closes on the timeframes you've selected and when there is a shift in momentum it notifies the trader with a color change and an alert if one was set up.
Technical inputs
- If you want to optimize the rate of signals to better fit your trading plan you would change the Factor input and ATR Length input. Increase factor and ATR Length to decrease the frequency of signals and decrease the Factor and ATR Length to increase the frequency of signals.
Quick TIP! : You can Sync all VFX SuperTrend Indicators together! All VFX SuperTrend indicators display unique information but its all derived from that same Momentum Formula. Keep the Factor input and ATR Length the same on other VFX SuperTrend indicators to have them operating on the same data.
Time Frame Inputs
- Your able to fill the chart with up to 8 timeframes
- If You don't need all 8 you can limit the amount to display by changing the "Time Frame Amount"
Display Inputs
- You can change the size of the chart and the color of the text
- You can toggle ON if you want to be signaled when a momentum switch occurs ( bullish to bearish or bearish to bullish )
- Your able to pick the Bullish and Bearish Colors of the Momentum switch
How it can be used ?
- Easily check the momentum of other Timeframes and use that information as a variable in your trading plan.
- quickly glance and know the momentum of any time frame before you enter any trade
- always know the momentum of the higher time frames
- Eliminate the need to switch from current chart
- Get an abundance of information in one location
- Have clear variables to structure your trades around

MTFT EMA CloudsMulti Time Frame Tools
Multi Time Frame Tools (MTFT) is a suite of scripts aimed to establish a standard timeframe-based color scheme. This can be utilized to overlay different timeframes calculations/values over a single timeframe. As one example, this would allow to observe the 5-month moving average, 5-week moving average, and 5-day moving average overlaid over each other. This would allow to study a chart, get accustomed to the color scheme and study all these at the same time much easier.
All indicators calculated using the below specific timeframes as input, will always use the color scheme outlined below. This is to get you in habit of recognizing the different timeframes overlaid in top of each other. These can be personalized.
Longer TF analysis.
Yearly - Black
Semi-Annual - Yellow
Quarterly - White
Monthly - Maroon
Weekly - Royal Blue
Daily - Lime
Shorter TF analysis.
4 hour - Fuchsia
1 hour - Orange
30 min - Red
15 min - Brown
10 min - Purple
5 min - Lilac
All color coordination is able to be modified in either the “Inputs” or “Style” section. If you need to make changes, make sure to select “Save as Default” on the bottom right of the settings menu.
Recommended Chart Color Layout
I played around with color coordination a lot. The final product was what worked best for me. I personally use the following chart settings to accent all available TF colors.
-> Click on the settings wheel on your chart. -> Click on “Appearance”.
Background - Solid -> On the top row pick the 6th color from the left.
Vert Grid Lines and Horz Grid Lines -> On the top row pick the 7th color from the left.
You may of course change these and the indicator line colors as you like.
Adding indicator to Chart
-> Open the TradingView “Indicators & Strategies” library, the icon has “ƒx”. -> All premium scripts will be located under “Invite-Only Scripts” -> Click indicator to add to your chart.
*** MTFT EMA Clouds ***
The Exponential Moving Average Clouds, EMA Clouds, is a commonly discussed FinTwit tool. I personally found it through Ripster47 and PatternProfits on Twitter. I have seen big FinTwit accounts solely focus on this strategy alone and have seen other big FinTwit accounts mix with their other indicators. I will be providing very basic info to utilize this script; it is up to you to dive deep into learning this strategy. I am not an expert with the tool or a financial advisor. As with all aspects of life, I recommend you research, learn, discern and practice extensively in order to become a master.
The script has the following features.
1. Two user selected timeframes(TF) per script instance. Timeframes include: Quarter, Month, Weekly, Daily, 4 hour, 1 hour, 30 min, 15 min, 10 min, and 5 min candlestick data.
2. Five Unique Clouds per selected timeframe can each be individually enabled/disabled. Cloud pairs include: 5&13, 8&9, 34&50, 72&89, and 180&200.
Below are some examples of how switching between multiple TF’s could assist you in identifying patterns and resistance/support easier. Below are 4 different timeframe EMA Clouds plotted over similar areas. What supports/resistances do you see?
Weekly timeframe selected with Quarterly Clouds
Weekly timeframe selected with Monthly Clouds
Daily timeframe selected with Weekly Clouds
1-hour timeframe selected with Daily Clouds.
This is meant to show you that the EMA Clouds often serve as resistance/support on multiple timeframes.
3. Force a specific cloud on both selected timeframes. Maybe you want to see how one cloud on several TFs looks over the same chart. Here I added two instances of the script in order to show 4 different TF clouds (Q, M, W, and D). Then I selected the “8_9” on “Force single cloud” for each instance, which will force only the selected cloud to be forced on all the selected time frames.
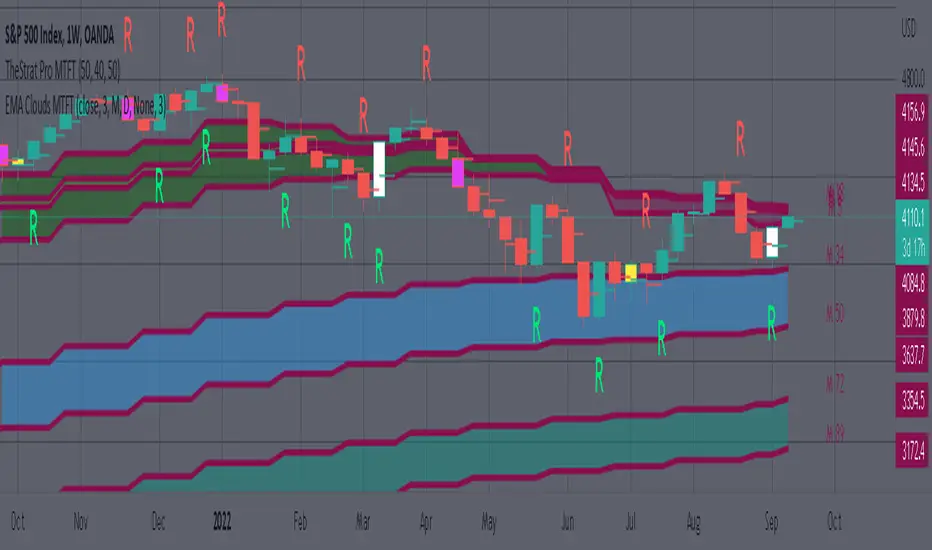
IMPORTANT NOTE: One of the lessons I would consider most important in attaining clarity regarding trading, is “TheStrat” by Rob Smith. His lesson on “actionable signals” is something that can be applied to any strategy. For this reason, I am including “MTFT TheStrat Patterns Pro” script in all images that will depict confluence for a better trade selection.
Example using TheStrat Pro MTFT with this indicator.
Look for a “TheStrat actionable signal” or a “TheStrat Reversal signal” on a smaller timeframe that has an instance of this indicator on a larger timeframe calculation that is in range of the candlestick that formed your actionable signal. This means that the indicators plot you are observing must be above the low and below the high of the candlestick that is the actionable signal/reversal signal. Image below shows what this would look like with this indicator.
The Image below shows what this would look like with this indicator. The selected candlestick is the Weekly, it shows a hammer actionable signal and the Monthly 34 EMA in range. This actionable signal is meant to be played in a long position. If the high is breached, you would enter a long position from the high of the hammer candlestick. For targets you would look at the previous pivots, for this example all targets were hit. Note that the “Entry” and “Targets” line were added manually and are not part of the script. Setups won’t always play out so nice and clean, but given that there is so many stocks and so many signals this is just a thought to improve the quality of the signal as it has extra confluence. If you are interested in learning further, research ‘TheStrat’ by Rob Smith.
MTF Supertrend [Trading Nerd]Trend Trading Strategy using Supertrends
Backtesting Script that uses a multitimeframeanalysis of the Supertrend Indicator. The trend direction is determind by a higher Timeframe (TF) Supertrend. The entry Signals are given by the Supertrend of the current TF. The script is NOT repainting (the script takes the previous value of the higher TF Supertrend, if the higher TF candle is not confirmed yet).
Strategy Conditions
Longs:
The higher TF Supertrend has to be green
The current TF Supertrend change from red to green
Shorts:
The higher TF Supertrend has to be red
The current TF Supertrend change from green to red
Optional:
Option: If enabled also a trend chage of the higher TF Supertrend is a valid Entry Signal
If enabled Signals are discarded if the ADX is below the value
Take Profit
On default there is no Take Profit. You can activate a Risk Reward Based Take Profit target trough the option. Also a Partial Take Profit is possible.
Stop Loss
The default Stop Loss Strategy is a Trailing Stoploss. As trailing Price the current TF Supertrend is used.
Additional
Time Filter: Only opens trade in the defined Session. Open trades are still being closed outside of the Session.
Start Date/End Date: Limits the backtest for the defined Date Range
Trading Days: Only open Trades on the checked Days
Risk % per Trade: If enabled the Strategy uses X% of the capital (defined in Settings -> Properties -> Initial Capital)
Use Compound Interest: If enabled Capital is recalculated for every trade (initial capital + net Profit)
IMPORTANT: For low Timeframes and Markets with tight SL (like Forex) it requires a lower Margin Percent than default. Go to Settings->Properties and lower the required Long/Short Margin. Otherwise Trades might not be considered because of too less capital/marign. Margins can e.g. set to: 2% (Forex), 10% (Stocks), 20% (Crypto).

Multi-timeframe Squeeze Mom + ADX and DIsMulti-timeframe Squeeze and ADX
This indicator is designed to be able to get used in combination with others that can lead to a potential help for trading.
The indicator uses colors such us light green, dark green, light red and dark red. Light green and light red to indicate the second half and strongest movement of an upwards and downwards movement, respectively. The same for the first half of an upwards or downwards movement, dark red for the possible start of the upwards movement and dark green ad possible start of the downwards movement.
The indicator is multi-timeframe because the trader can configure within the menu a background timeframe, which plots a squeeze momentum for a different timeframe than the one selected for the main graph. It plots the background timeframe with an area style, while the main squeeze is plotted with a column style. This helps the traders to analyze whether entering a position countering a higher timeframe upwards or downwards squeeze momentum.
It also shows the divergences that occur between the price and the squeeze momentum that can add strength to a potential movement upwards or downwards.
The ADX, DI+ and DI- lines are also added to determine the potential strength of the movement in the monitor (squeeze momentum). If the DI+ is over the DI-, then the strength is likely higher upwards and the opposite for the downwards strength.
Fundamentals
Squeeze momentum: It shows the periods when volatility increases or decreases, in other words, when the market goes from the trend into flat movement and vice versa.
ADX (Average Directional Index): The ADX helps the indicator to estimate the strength of the movement, always considering the DI+ and DI- to not go against the trend strength.
Positive (DI+) and Negative DI (DI-): Both DI+ and DI- measure up and down price movement, in some cases crossovers of these lines can be used as trade signals.
Divergences: Divergence occur when the price of an asset is moving in the opposite direction of a technical indicator, such as an oscillator (squeeze momentum). Divergence warns that the current price trend may be weakening, and in some cases may lead to the price changing direction.
Panel
This panel allows the trader to have a summary of the values of the direction and strength of the movement. It has the following characteristics:
It is placed on the right middle side of the chart indicator by the default.
Its colors changes according to the indicator’s values.
The summary box shows the projection for the main squeeze plot and also for the background squeeze plot. If only one is needed, it can be changed on the menu of the indicator.
Summary
From all previously mentioned, it can be stated that the indicator allows users to:
Detect the direction of trends
Detect price and squeeze divergences
Get a table summarizing important values of the indicator to determine the strength of a trend.

MTFA - Multi Time Frame Analysis - Moving AveragesThis indicator will help you make better informed trading decisions by showing higher time frame moving averages overlaid on a single chart. You can customise 4 moving averages.
Triple RSI strategyThis strategy is commonly used both in forex and stock markets for reversal trading. when the rsi line reaches and crosses simultaneously at 3 rsi setups i.e at 7, 14, and 21, a signal is generated.
This strategy works best in 1-hour timeframe. It provides over 60 to 80 percent accuracy in 1-hour timeframe.
In the stock market, this strategy provides an excellent entry point, if one is seeking small profits.
One can expect to make around 10 to 50 pips in the forex market easily. However, I advise seeking support from price action from the lower timeframe in the forex market.
I hope you like it.
Follow for more strategies and scripts like this.

Rsi/W%R/Stoch/Mfi: HTF overlay mini-plotsOverlay mini-plots for various indicators. Shows current timeframe; and option to plot 2x higher timeframes (i.e. 15min and 60min on the 5min chart above).
The idea is to de-clutter chart when you just want real-time snippets for an indicator.
Useful for gauging overbought/oversold, across timeframes, at a glance.
~~Indicators~~
~RSI: Relative strength index
~W%R: Williams percent range
~Stochastic
~MFI: Money flow index
~~Inputs~~
~indicator length (NB default is set to 12, NOT the standard 14)
~choose 2x HTFs, show/hide HTF plots
~choose number of bars to show (current timeframe only; HTF plots show only 6 bars)
~horizontal position: offset (bars); shift plots right or left. Can be negative
~vertical position: top/middle/bottom
~other formatting options (color, line thickness, show/hide labels, 70/30 lines, 80/20 lines)
~~tips~~
~should be relatively easy to add further indicators, so long as they are 0-100 based; by editing lines 9 and 11
~change the vertical compression of the plots by playing around with the numbers (+100, -400, etc) in lines 24 and 25

OHLC MTFThe script allows you to plot the opening, highest, lowest and closing (ohlc) values of a previous candle.
Settings :
- "Time Frame" : allows you to choose the reference time frame;
- "Offset" : sets which candle to select the data from.
Ex : If you select "1 day" as the time frame and "1" as the offset, the OHLC values of yesterday's daily candle will be displayed (regardless of your current time frame).

ChannelMomentumBreakerChannelMomentumBreaker
This indicator is based on an original idea which is derived from Dow Theory: "Asset prices incorporate all available information". The driving influence behind this indicator is to consider only Meaningful changes in behaviour in a time independent system.
The way it works is simple and as follows:
The indicator decides on a singular price point called the Pivot Price which will be used as a baseline/calibration point
It then generates its own OHLC candles based on a 1-1 mapping from the real time candles to the "virtual" candles
The ratio between the top tails and bottom tails of these virtual candles will determine if there is a meaningful change in behaviour
The result is reflected in the histogram for conveniency.
The indicator can be considered as time-frame agnostic but works most optimally when derived from smaller time-frames (e.g. its detection of meaningful changes will be better when used in a 1-minute candle time-frame as opposed to a 3-minute time-frame).
Colour scheme:
------------------
The virtual candles follow a two-colour convention:
Gray - Considered a safe zone for entry
Red - Considered less safe
These virtual candles must be analysed in conjunction with the histogram.
Histogram colour scheme:
Red - Signifies less than mid-level change in behaviour
Yellow - Signifies change in behaviour that is not strong enough or too late with respect to when the "up" trend began
Gray - Signifies no meaningful change in behaviour has occurred for a long time
Lime - Signifies meaningful change in behaviour has occurred recently
White - Signifies a meaningful change in behaviour has occurred recently and quickly
Blue - Signifies risky change in behaviour
Teal - Signifies a virtual bar open is greater than the previous virtual bar
In general, the upper half of the histogram is considered as a preferred zone for long entry and vice versa for the bottom half.
Crossover background colour scheme:
Red - Transition from positive behaviour -> negative behaviour (This is triggered when consecutive bars are crossing a certain low threshold )
Green - Transition from negative behaviour -> positive behaviour (This is triggered when consecutive bars are crossing a certain high threshold )
Input parameters:
Fast Acceleration Length and Slow Acceleration Length are used to control the sensitivity of the crossover mechanism on the histogram.
How to use:
The picture depicts the virtual (gray/red) candles and histogram.
The Blue rectangle shows the virtual bars and a full transition from negative behaviour to positive behaviour.
The Red rectangle shows when meaningful negative behaviour is occurring, where it may be suitable to begin preparing for an upwards trend (reversal of behaviour).
The Green rectangle shows when meaningful positive behaviour has occurred, and you can get ready to enter a trade.
A confirmed green bar in histogram is a sign that meaningful positive behaviour has occurred and the trade can be taken above the high confirmed bar.
In the below snapshot - The Green cross hair shows the recommended entry point for a long trade.
snapshot:
Input Parameters
Fast MA Length - Fast threshold for crossing Meaningful changes in behaviour
Slow MA Length - Slow threshold for crossing Meaningful changes in behaviour
Display Imaginary bars - Toggle On/Off for displaying virtual candles
Regression Length - Histogram sensitivity (The Shorter value the more sensitive for changes )
Virtual Bars Smoothing Length - Length threshold for virtual bars smoothing (Increasing/Decreasing the value will impact when we consider Meaningful changes in behaviour)
Limitations:
In some cases when stock is not making a Meaningful change in behaviour for long time both the virtual bars and the histogram will be flat.
In such cases, consider changing to a higher time frame or changing the sensitivity settings.

+ Multi-timeframe Multiple Moving Average LinesThis is a pretty simple script that plots lines for various moving averages (what I think are the most commonly used across all markets) of varying lengths of timeframes of the user's choosing. Timeframes range from 5 minutes up to one month, so regardless if you're a scalper or a swing trader there should be something here for you.
There are 8 lines (that can be turned on/off individually), which may seem like a lot, but if you use two averages and want to display four different timeframes for each, you can do that. The nice thing is that because the lines start plotting from the current bar they won't clutter up the screen. And obviously having moving averages from different timeframes on your chart makes price action more difficult to read (I mean sure, you can make them invisible, but who wants to do that all the time).
For each line there are two labels. One with the moving average type, and the other with its specific timeframe. I can't include the moving average length because it's not a string input. If anyone has a workaround for this, let me know, otherwise I would simply recommend setting different colors depending on the length, or if you only use one or two lengths and one or two moving averages this shouldn't be an issue. I had to use two labels because for the label text I couldn't include more than one string input, this is why there is an input for the 'moving average type label distance.'' You will want to adjust this depending on if you are trading crypto, futures, or forex because in some cases there may still be label overlap.
Pretty much everything else is self-explanatory.
I've added alerts. I might need to modify them if I can, because it would be nice for them to state the name and timeframe of the moving average. But I think this will do for now.
Enjoy!

Magnifying Glass (LTF Candles) by SiddWolf█ OVERVIEW
This indicator displays The Lower TimeFrame Candles in current chart, Like Zooming in on the Candle to see it's Lower TimeFrame Structure. It plots intrabar OHLC data inside a Label along with the volume structure of LTF candle in an eloquent format.
█ QUICK GUIDE
Just apply it to the chart, Hover the mouse on the Label and ta-da you have a Lower Timeframe OHLC candles on your screen. Move the indicator to the top and shrink it all the way up, because all the useful data is inside the label.
Inside the label: The OHLC ltf candles are pretty straightforward. Volume strength of ltf candles is shown at bottom and Volume Profile on the left. Read the Details below for more information.
In the settings, you will find the option to change the UI and can play around with Lower TimeFrame Settings.
█ DETAILS
First of all, I would like to thank the @TradingView team for providing the function to get access to the lower timeframe data. It is because of them that this magical indicator came into existence.
Magnifying Glass indicator displays a Candle's Lower TimeFrame data in Higher timeframe chart. It displays the LTF candles inside a label. It also shows the Volume structure of the lower timeframe candles. Range percentage shown at the bottom is the percentage change between high and low of the current timeframe candle. LTF candle's timeframe is also shown at the bottom on the label.
This indicator is gonna be most useful to the price action traders, which is like every profitable trader.
How this indicator works:
I didn't find any better way to display ltf candles other than labels. Labels are not build for such a complex behaviour, it's a workaround to display this important information.
It gets the lower timeframe information of the candle and uses emojis to display information. The area that is shown, is the range of the current timeframe candle. Range is a difference between high and low of the candle. Range percentage is also shown at the bottom in the label.
I've divided the range area into 20 parts because there are limitation to display data in the labels. Then the code checks out, in what area does the ltf candle body or wick lies, then displays the information using emojis.
The code uses matrix elements for each block and relies heavily on string manipulation. But what I've found most difficult, is managing to fit everything correctly and beautifully so that the view doesn't break.
Volume Structure:
Strength of the Lower TimeFrame Candles is shown at the bottom inside the label. The Higher Volume is shown with the dark shade color and Lower Volume is shown with the light shade. The volume of candles are also ranked, with 1 being the highest volume, so you can see which candle have the maximum to minimum volume. This is pretty important to make a price action analysis of the lower timeframe candles.
Inside the label on the left side you will see the volume profile. As the volume on the bottom shows the strength of each ltf candles, Volume profile on the left shows strength in a particular zone. The Darker the color, the higher the volume in the zone. The Highest volume on the left represents Point of Control (Volume Profile POC) of the candle.
Lower TimeFrame Settings:
There is a limitation for the lowest timeframe you can show for a chart, because there is only so much data you can fit inside a label. A label can show upto 20 blocks of emojis (candle blocks) per row. Magnifying Glass utilizes this behaviour of labels. 16 blocks are used to display ltf candles, 1 for volume profile and two for Open and Close Highlighter.
So for any chart timeframe, ltf candles can be 16th part of htf candle. So 4 hours chart can show as low as 15 minutes of ltf data. I didn't provide the open settings for changing the lower timeframe, as it would give errors in a lot of ways. You can change the timeframe for each chart time from the settings provided.
Limitations:
Like I mentioned earlier, this indicator is a workaround to display ltf candles inside a label. This indicator does not work well on smaller screens. So if you are not able to see the label, zoom out on your browser a bit. Move the indicator to either top or bottom of all indicators and shrink it's space because all details are inside the label.
█ How I use MAGNIFYING GLASS:
This indicator provides you an edge, on top of your existing trading strategy. How you use Magnifying Glass is entirely dependent on your strategy.
I use this indicator to get a broad picture, before getting into a trade. For example I see a Doji or Engulfing or any other famous candlestick pattern on important levels, I hover the mouse on Magnifying Glass, to look for the price action the ltf candles have been through, to make that pattern. I also use it with my "Wick Pressure" indicator, to check price action at wick zones. Whenever I see price touching important supply and demand zones, I check last few candles to read chart like a beautiful price action story.
Also volume is pretty important too. This is what makes Magnifying Glass even better than actual lower timeframe candles. The increasing volume along with up/down trend price shows upward/downward momentum. The sudden burst (peak) in the volume suggests volume climax.
Volume profile on the left can be interpreted as the strength/weakness zones inside a candle. The low volume in a price zone suggests weakness and High volume suggests strength. The Highest volume on the left act as POC for that candle.
Before making any trade, I read the structure of last three or four candles to get the complete price action picture.
█ Conclusion
Magnifying Glass is a well crafted indicator that can be used to track lower timeframe price action. This indicator gives you an edge with the Multi Timeframe Analysis, which I believe is the most important aspect of profitable trading.
~ @SiddWolf

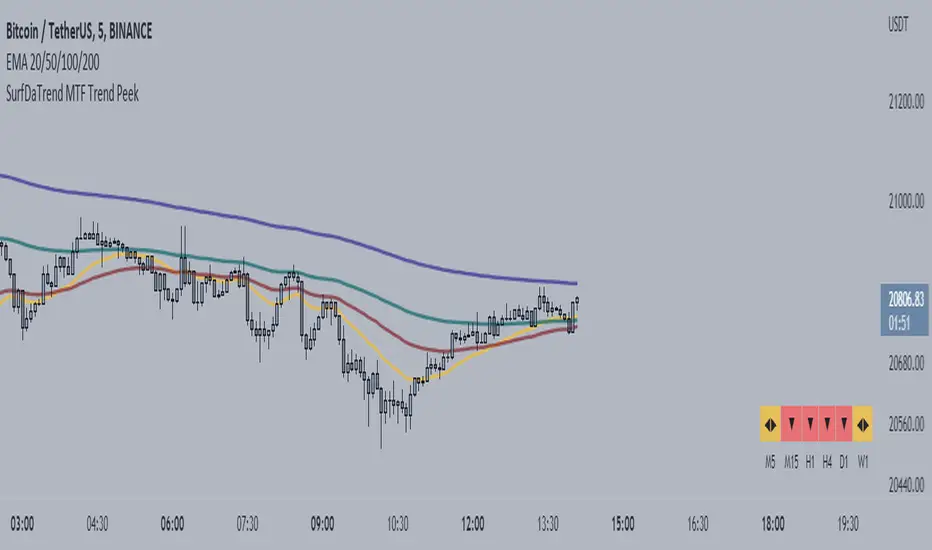
SurfDaTrend MTF Trend PeekThis script displays whether the EMA's align on Multiple-Timeframes. The user will set the EMA periods to use to determine the trend. This is useful for Multi-timeframe analysis and ensuring you are not trading against the HTF trend. This script also benefits users who use only a single screen as it is troublesome to switch to multiple timeframes to check EMA alignment.
***note: This is only useful for traders who trade on the lower timeframes. Not recommended for long-term traders.
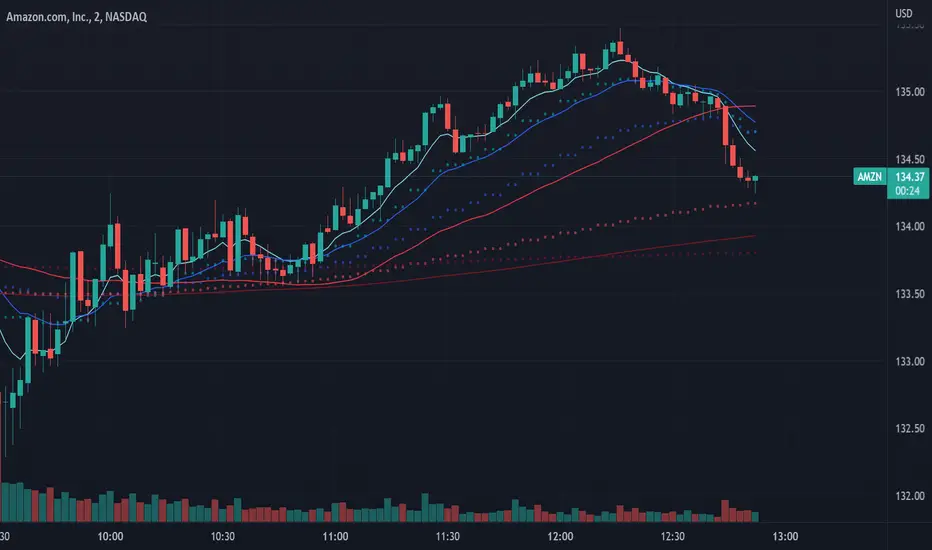
Multi-timeframe MomentumThe Multi-timeframe momentum indicator is similar in concept to a velocity indicator like rate-of-change, but visualizes smoothed price changes by applying an EMA and linear regression to price difference at every bar. Momentums from 1 minute to 1 quarter are plotted on a single chart using the request.security function. Standard and Fibonacci timeframes are available as well as the ability to hide high-timeframes to keep the chart clean. Like any oscillator, divergence in the momentums can be used to identify price reversals in conjunction with support and resistance. When linear regression is applied, high and low inflection points are used to identify reversals in a manner similar to MACD.
Much love to DumpCap! The script is presented sans secret sauce.

Multi-timeframe EMAThe Multi-timeframe exponential moving average (EMA) indicator visualizes EMAs from 1 minute to 1 quarter on a single chart using the request.security function. Standard and Fibonacci timeframes are available as well as the ability to hide high-timeframe EMAs to keep the chart clean. Cross-overs and arrangement of the EMAs indicate sentiment.
Much love to DumpCap! The script is presented sans secret sauce.
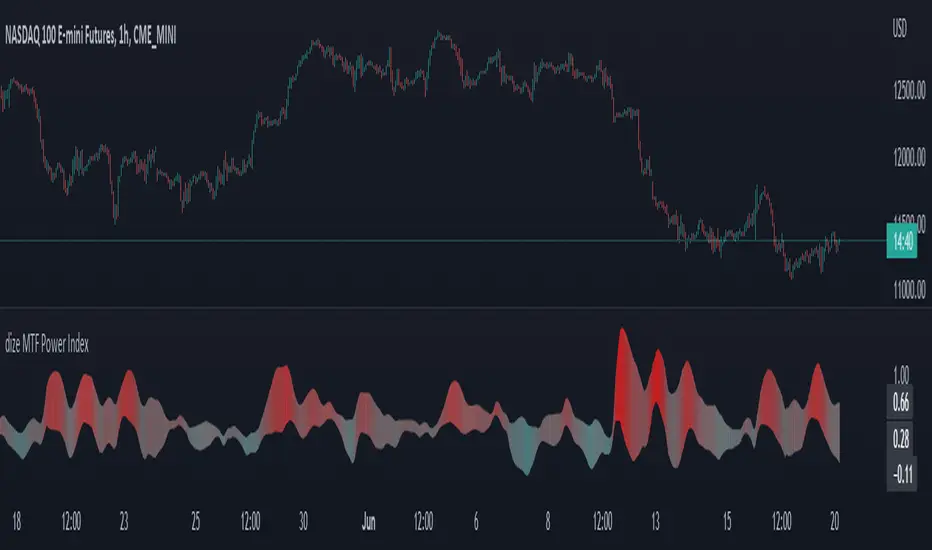
dize Multi-Timeframe Power IndexHi Trader,
the "Power Index" indicator is one part of our holistic approach to identifying trading setups. It is one of many indcators of our dize indicator package and should always be used in conjunction with the other dize indicators.
💡 What is the Power Index?
The "Power Index" indicator is our approach to measuring the volatility of an asset. It comes with multi-timeframe support, which helps to filter out bad trades. The indicator has a "Sensitivity" parameter that specifies how many historic candles should be looked at when calculating. The graph is a cloud colored according to historical volatility. This makes it possible to estimate at a glance how much risk and volatility currently prevail in the market.
💡 How to use it?
By using the integrated settings you will be able to configure the power index for your market. Firstly, you should find the "Sensitivity" which best reflects your markets volatility. If you wish, you can also use the indicator on a different timeframe, than the one displayed on your chart. That can help to filter out noise and get a better perspective on what is happening on a bigger timeframe.
Let's have a look how we can use the Power Index to filter out noise on a lower timeframe:
In the above picture, both chart and power index run on the same timeframe. The Power Index calculates according to the selected timeframe and gives solid information.
If we zoom out on the power index by selecting a higher timeframe, we get the big picture and can easily identify low volatility, which might increase our chances on finding a good trading setup.
The above example is one of many use cases for the power index indicator.
🔓 To gain access to this indicator, please read the signature field.
dize Multi-Timeframe TrendHi Trader,
the "Multi-Timeframe Trend" indicator is one part of our holistic approach to identifying trading setups. It is one of many indcators of our dize indicator package and should always be used in conjunction with the other dize indicators.
💡 What is the MTF Trend indicator?
Our "Multi-Timeframe Trend" indicator allows to view the trend on different timeframes. The multi-timeframe approach helps us to filter out noise from the market and to find the overarching trend. In addition to the trend, the indicator also shows the percentage change for each up and down movement, which is an expression of the trend strength. We use a proprietary approach to identifying turning points, which will be used for trend recognition.
Furthermore, we connect the most recent dominating highs and lows to create two trendlines at the most right side of the chart.
💡 How to use it?
Using the "Multi-Timeframe Trend" indicator is pretty straight forward. After applying it to your chart you will have to adjust the "Resolution" parameter in the settings. Please be aware, that the selected resolution should always be higher than the displayed chart timeframe. Once that is done, the indicator will show the up- and downmovements of the higher timeframe on your chart.
To fine-tune the trendlines, you should first activate the "Show Trendlines" checkbox. After that we will use the "Trendlines Depth" parameter to detect the most optimal trendlines out of the latest "n" up and down turning points.
Let's have a look:
In the above example you can see a daily Bitcoin chart with a weekly MTF Trend configuration. Initially it shows an uptrend. You will notice how the up- and downswing percentages change over time and move into favor of the bears. The red numbers (downmovement) increase, while the green number (upmovement) decrease. It's easy to identify the sentiment shift. Lastly, the indicator shows two trendlines, which both indicate the current direction of the market.
🔓 To gain access to this indicator, please read the signature field.

MTF High LowThis is a Multi-Time Frame High Low Indicator that plots the highest and lowest price levels of the chart timeframe and a user selected higher timeframe.
The length can be optimized by the user from settings (default value is 6 candles) and table position can also be adjusted.
The calculation does not takes into account the last candle price data to form a view using the current close price as described below:
If Close > mid value of High + Low, view is Bullish
If Close < mid value of High + Low, view is Bearish
The above is also calculated for the higher timeframe and view for both timeframe is updated in the chart.
The color coding is dynamic based upon the current close price levels and comparisons with High, Low and Mid values.
The mid values level plot is hidden by default and can be enabled and saved as default if the user likes so.

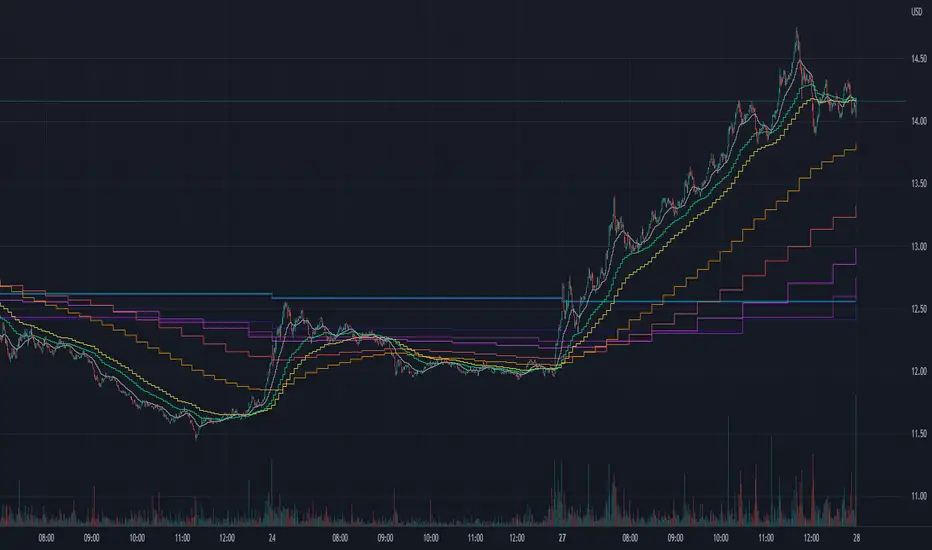
Tracert Trend[s3]Variable Moving Average(VMA) with a view of the trend based on the VMA on multiple timeframes. The Variable Moving Average (VMA) is a study that uses an Exponential Moving Average being able to automatically adjust its smoothing factor according to the market volatility . The timeframes of the indicator must be set to a higher timeframe than whatever timeframe your chart is set to to work properly. Example(default): Trading on the 15m timeframe so have the timeframes set to: 1) Chart 2) 30m 3) 45m 4) 60m
Green line of VMA = uptrend in price action
Red line of VMA = downtrend in price action
White line of VMA = indecision in price action
Green candles = uptrend and above VMA
Red candles = downtrend and below VMA
White candles = indecision or chop in price action
Green symbol below candle = all six timeframes are above the VMA
Red symbol above candle = all six timeframes are above the VMA
No symbol above or below candle = indecision amongst the six timeframes

[BM] HTF Candle Evolution█ OVERVIEW
This script shows how a higher timeframe candle evolves over time.
It was created as a visual aid to #TheStrat and provides a new way of looking at Timeframe Continuity.
█ FEATURES
General
HTF: Higher Timeframe selection with dropdown and ability to manually input a timeframe that is not present in the dropdown.
Label: Show a label with the selected higher timeframe.
Marker: Shows a marker symbol at the start of each new higher timeframe.
Align: Aligns the candles around a selected center line.
The Strat
Multi-timeframe analysis is used extensively in #TheStrat (created by Rob Smith), so the ability to add #TheStrat coloring has been made available.
Scenario: Define the colors for the strat scenario's.
Coloring of: Choose which part of the candles you want the selected strat scenario colors to be applied to.
Band: Display a band that shows the active strat scenario color of the selected higher timeframe.
All features are completely customizable.

2TimeFrame Candles by EsIstTurnt//Not my original idea, Ive pretty much just doubled the code to have 2 Candles .All Credit goes to the creator of "Multi-Time Period Charts" as I have it saved in my library. I cant find it anymore and searching the script doesn't appear it seems so if its you let me know (and ill credit you). Why did I opt to plot 2 candles you say? 2*candles=(info)*2. 3 if we count the regular plot. Anything more than that and its too busy/blurring to really visualize trends but this was a bit of a game changer no more switching timeframes back and forth .
