Project Monday Strategy [AlgoAI System]Overview
Project Monday is a sophisticated trading strategy designed for active market participants. This strategy can be used alongside other forms of technical analysis, providing traders with additional tools to enhance their market insights. While it offers a flexible approach for identifying and exploiting market inefficiencies, Project Monday does not fit every market condition and requires adjustments. Its core principles include technical analysis and risk management, all aimed at making informed trading decisions and managing risk effectively.
Features
Project Monday Strategy works in any market and includes many features:
Efficient Trading Presets: Offers ready-to-use presets that allow traders to start efficient trading with one click.
Confirmation Signals: Provides signals to help traders validate trends, emphasizing informed decision-making (not to be followed blindly).
Reversal Signals: Identifies signals to alert traders to potential reversals, encouraging careful analysis (not to be followed blindly).
Adaptability: Can be adjusted to fit different market conditions, ensuring ongoing effectiveness.
Multi-Market Application: Suitable for use across various asset classes including stocks, forex, commodities, and cryptocurrencies.
Integration: Can be used alongside other technical analysis tools for enhanced decision-making.
Position Sizing: Allows traders to determine optimal trade size using backtesting and trading performance dashboard.
Backtesting: Supports historical testing to refine and validate the strategy.
Continuous Monitoring: Includes features for ongoing performance evaluation and strategy adjustments.
Unique Project Monday Strategy Features on TradingView:
Adaptive Position Sizing: Dynamically adjusts the size of each position based on market conditions and predefined risk management criteria, ensuring optimal trade sizing and risk exposure.
Preliminary Position Opening: Allows traders to enter a position in anticipation of a signal confirmation, enabling them to capture early market movements and improve entry points.
Preliminary Position Closing: Enables traders to exit a position before a signal reversal, helping to lock in profits and minimize potential losses during volatile market conditions.
Adjusting Strategy Parameters:
Price Band Inputs:
Project Monday Strategy uses a set of configurable inputs to tailor its behavior according to the trader's preferences. The following are the key inputs for the price band calculations. Signals are not generated when the price remains within these bands.
“Length of Calculation” determines how many historical data points are used in the trend calculation. A shorter “Length of Calculation” will make the Price Band more responsive to recent price changes but may also increase the noise and the likelihood of false signals. A longer “Length of Calculation” will make the Price Band smoother, with less noise, but may cause more lag in reacting to price changes.
“Offset” determines the position of the Gaussian filter, which is used to weight the data points in the trend calculation. The offset is expressed as a fraction of the “Length of Calculation”, with a value between 0 and 1. A higher “Offset” will shift the Gaussian filter closer to the more recent data points, making the Price Band more responsive to recent price changes but potentially increasing noise. A lower “Offset” will shift the Gaussian filter closer to the centre of the window, resulting in a smoother Price Band but potentially introducing more lag.
“Sigma” refers to the standard deviation used in the Gaussian distribution function. This parameter determines the smoothness of the curve and the degree to which data points close to the centre of the “Length of Calculation” are weighted more heavily than those further away. A smaller “Sigma” will result in a narrower Gaussian filter, leading to a more responsive Price Band but with a higher chance of noise and false signals. A larger “Sigma” will result in a wider Gaussian filter, creating a smoother Price Band but with more lag.
Adjust the “Source” inputs to specify which type of price data should be used for strategy calculations and signal generation.
“Width of Band” input determines the multiplier for the band width. A higher value of “Width of Band” makes the price band wider, which generates fewer signals due to the lower probability of the price moving outside the band. Conversely, a lower multiplier makes the band narrower, generating more signals but also increasing the likelihood of false signals.
Direction input:
The Project Monday strategy includes an input to specify the direction of trades, allowing traders to control whether the strategy should consider long positions, short positions, or both. The following input parameter is used for this purpose:
This input parameter allows traders to define the type of positions the strategy will take. It has three options:
Only Long: The strategy will generate signals exclusively for buying or closing short positions, focusing on potential uptrends.
Only Short: The strategy will generate signals exclusively for selling or closing long positions, focusing on potential downtrends.
Both: The strategy will generate signals for both buying (long positions) and selling (short positions), allowing for a more comprehensive trading approach that captures opportunities in both rising and falling markets.
Signals Filter:
The Project Monday strategy includes inputs to filter signals based on higher timeframes and the length of the data used for filtering. These inputs help traders refine the strategy's performance by considering broader market trends and smoothing out short-term fluctuations.
Filter Timeframe input specifies the timeframe used for filtering signals. By choosing a higher timeframe, traders can filter out noise from shorter timeframes and focus on more significant trends. The options range from intraday minutes (e.g., 1, 5, 15 minutes) to daily (1D, 2D, etc.), weekly (1W, 2W, etc.), and monthly (1M) timeframes. This allows traders to align their strategy with their preferred trading horizon and market perspective.
Filter Length input defines the number of data points used for filtering signals on the selected timeframe. A longer filter length will smooth out the data more, helping to identify sustained trends and reduce the impact of short-term fluctuations. Conversely, a shorter filter length will make the filter more responsive to recent price changes, potentially generating more signals but also increasing sensitivity to market noise.
Adaptive Position Size:
The Project Monday strategy incorporates inputs for unique feature Adaptive Position Sizing (APS), which dynamically adjusts the size of trades based on market conditions and specified parameters. This feature helps optimize risk management and trading performance.
Enable Adaptive Position Size: Users can check or uncheck this box to enable or disable the Adaptive Position Size feature. When checked, the strategy dynamically adjusts position sizes based on the defined parameters. This allows traders to scale their positions according to market volatility and other factors, enhancing risk management and potentially improving returns. When unchecked, the strategy will not adjust position sizes adaptively, and positions will remain fixed as per other settings.
“Timeframe for Adaptive Position Size “input specifies the timeframe used for calculating the position size. Options range from intraday minutes (e.g., 30, 60 minutes) to daily (1D, 3D), weekly (1W), and monthly (1M) timeframes. Selecting an appropriate timeframe helps align position sizing calculations with the trader’s overall strategy and market perspective, ensuring that position sizes are adjusted based on relevant market data.
“APS Length” input defines the number of data points used to calculate the adaptive position size. A longer APS length will result in higher position sizes. Conversely, a shorter APS length will result in smaller position sizes.
Anticipatory Trading:
Project Monday Strategy includes inputs for unique feature Anticipatory Trading, allowing traders to open and close positions preliminarily based on certain conditions. This feature aims to provide an edge by taking action before traditional signals confirm.
Enable Preliminary Position Opening: Users can check or uncheck this box to enable or disable Preliminary Position Opening. When enabled, the strategy will open positions based on preliminary conditions before the standard signals are confirmed. This can help traders capitalize on early trend movements and potentially gain a better entry point.
Enable Preliminary Position Closing: Users can check or uncheck this box to enable or disable Preliminary Position Closing. When enabled, the strategy will close positions based on preliminary conditions before the standard exit signals are confirmed. This can help traders lock in profits or limit losses by exiting positions at the early signs of trend reversals.
“Position Size in %” input specifies the position size as a percentage of the trading capital. By setting this value, traders can control the amount of capital allocated to each trade. For example, a risk value of 40% means that 40% of the available trading capital will be used for each anticipatory trade. This helps in managing risk and ensuring that the position size aligns with the trader's risk tolerance and overall strategy.
Usage:
Signal Generation
Long signal indicates a potential uptrend, suggesting either buying or closing a short position. Short signal indicates a potential downtrend, suggesting either selling or closing a long position. Signals are generated on your chart when the price moves beyond a calculated price band based on the current trend.
Signal Filtering
The strategy includes a filtering mechanism based on the current or another timeframe. Filtering works best with higher timeframes. This component calculates the trend on a higher timeframe and predicts the trend, ensuring trades on the current timeframe are only opened if they align with the higher timeframe trend. Setting the right filter timeframe is crucial for obtaining the best signals.
Position Direction
Users can choose the direction of positions to open via the settings box. Options include only long positions, only short positions, or both.
Adaptive Position Size (APS)
Users can enable the Adaptive Position Size feature to adjust position sizes based on trend strength. The strategy evaluates the strength of the current trend based on a higher timeframe. The stronger the trend, the larger the position size for opening a position.
Anticipatory Trading
Users can activate this unique feature to enhance trading decisions. The strategy assesses the likelihood of receiving a main signal. If the opportunity appears strong, it opens a partial position, as specified in the settings box. As the probability of the signal strengthens, the strategy gradually increases the position size.
Exit Strategy
The strategy exits positions based on receiving a reverse signal. Positions opened through “Anticipatory trading” are exited incrementally as each preliminary signal reverses.
By following these steps, traders can implement the strategy to navigate various market scenarios, manage risk, and adjust trading performance over time. Adjusting parameters and monitoring signals diligently are key to adapting the strategy to individual trading styles and market conditions.
You will get
By purchasing the Project Monday strategy, you not only gain access to a cutting-edge system but also receive ready-to-use presets designed to help you start trading immediately and achieve optimal results. Additionally, you benefit from comprehensive support and the option to request custom presets for your desired financial instruments through our dedicated support team, ensuring you have the tools and assistance needed for successful trading.
Risk Disclaimer
This information is not a personalized investment recommendation, and the financial instruments or transactions mentioned in it may not be appropriate for your financial situation, investment objective(s), risk tolerance, and/or expected return. AlgoAI shall not be liable for any losses incurred in the event of transactions or investments in financial instruments mentioned in this information.
Moving Averages

TradeBuilderOverview
TradeBuilder is an ever-growing toolbox that lets you combine and compound any number of bundled indicators and algorithms to create a compound strategy. At launch, we're including two Moving Averages (SMA, EMA), RSI, and Stochastic Oscillator, with many more to come. You can use any combination of indicators, be it just one, two, or all.
Key Concepts
Indicator Integration: Tradebuilder allows the use of Moving Averages, RSI, and Stochastic Oscillators, with customizable parameters for each. More indicators to come.
Mode Selection : Choose between Confirm Trend Mode (using indicators to confirm trends) and Momentum Mode (using indicators to spot reversals).
Trade Flexibility : Offers options for both long and short trades, enabling diverse trading strategies.
Customizable Inputs : Easily toggle indicators on or off and adjust specific settings like periods and thresholds.
Signal Generation : Combines multiple conditions to generate entry and exit signals.
Input Parameters:
Moving Average (MA):
use_ma : Enable this to include the Moving Average in your strategy.
ma_cross_type : Choose between "Close/MA" (price crossing the MA) or "MA/MA" (one MA crossing another).
ma_length : Set the period for the primary MA.
ma_type : Choose between "SMA" (Simple Moving Average) or "EMA" (Exponential Moving Average).
ma_length2 : Set the period for the secondary MA if using the "MA/MA" cross type.
ma_type2 : Set the type for the secondary MA.
Relative Strength Index (RSI):
use_rsi : Enable this to include RSI in your strategy.
rsi_length : Set the period for RSI calculation.
rsi_overbought : Define the overbought level.
rsi_oversold : Define the oversold level.
Stochastic Oscillator:
use_stoch : Enable this to include the Stochastic Oscillator in your strategy.
stoch_k : Set the %K period.
stoch_d : Set the %D period.
stoch_smooth : Define the smoothing factor.
stoch_overbought : Set the overbought level.
stoch_oversold : Set the oversold level.
Confirmation or Momentum Mode:
confirm_trend : Set this to true to use RSI and Stochastic Oscillator to confirm trends (long when above overbought, short when below oversold). Set to false to trade on momentum (short when above overbought, long when below oversold).
Tip: When set to false and used with just momentum oscillators like Stochastic or RSI, it's geared toward scalping as it essentially becomes momentum trading.
Trade Directions:
trade_long : Enable to allow long trades.
trade_short : Enable to allow short trades.
Example Strategy on E-mini S&P 500 Index Futures ( CME_MINI:ES1! ), 1-minute Chart
Let’s say you want to create a strategy to go long when:
A 5-period SMA crosses above a 100-period EMA.
RSI is above 20.
The Stochastic Oscillator is above 95.
Trend Confirmation Mode is on.
For short:
A 5-period SMA crosses below a 100-period EMA.
RSI is below 45.
The Stochastic Oscillator is below 5.
Trend Confirmation Mode is on.
Here’s how you would set it up in Tradebuilder:
use_ma = true
ma_cross_type = "MA/MA"
ma_length = 5
ma_type = "SMA"
ma_length2 = 100
ma_type2 = "EMA"
use_rsi = true
rsi_length = 14
rsi_overbought = 20
rsi_oversold = 45
use_stoch = true
stoch_k = 8
stoch_d = 1
stoch_smooth = 1
stoch_overbought = 95
stoch_oversold = 5
confirm_trend = true
trade_long = true
trade_short = false
Alerts
Here is how to set TradeBuilder alerts: open a TradingView chart, attach TradeBuilder, right-click on chart -> Add Alert. Condition: Symbol (e.g. NQ) >> TradeBuilder >> Open-Ended Alert >> Once Per Bar Close.
Development Roadmap
We plan to add many more compoundable indicators to TradeBuilder over the coming months from all walks of technical analysis, including Volume, Volatility, Trend Detection/Validation, Momentum, Divergences, Chart Patterns, Support/Resistance Analysis. etc.

Chandelier Exit Strategy with 200 EMA FilterStrategy Name and Purpose
Chandelier Exit Strategy with 200EMA Filter
This strategy uses the Chandelier Exit indicator in combination with a 200-period Exponential Moving Average (EMA) to generate trend-based trading signals. The main purpose of this strategy is to help traders identify high-probability entry points by leveraging the Chandelier Exit for stop loss levels and the EMA for trend confirmation. This strategy aims to provide clear rules for entries and exits, improving overall trading discipline and performance.
Originality and Usefulness
This script integrates two powerful indicators to create a cohesive and effective trading strategy:
Chandelier Exit : This indicator is based on the Average True Range (ATR) and identifies potential stop loss levels. The Chandelier Exit helps manage risk by setting stop loss levels at a distance from the highest high or lowest low over a specified period, multiplied by the ATR. This ensures that the stop loss adapts to market volatility.
200-period Exponential Moving Average (EMA) : The EMA acts as a trend filter. By ensuring trades are only taken in the direction of the overall trend, the strategy improves the probability of success. For long entries, the close price must be above the 200 EMA, indicating a bullish trend. For short entries, the close price must be below the 200 EMA, indicating a bearish trend.
Combining these indicators adds layers of confirmation and risk management, enhancing the strategy's effectiveness. The Chandelier Exit provides dynamic stop loss levels based on market volatility, while the EMA ensures trades align with the prevailing trend.
Entry Conditions
Long Entry
A buy signal is generated by the Chandelier Exit.
The close price is above the 200 EMA, indicating a strong bullish trend.
Short Entry
A sell signal is generated by the Chandelier Exit.
The close price is below the 200 EMA, indicating a strong bearish trend.
Exit Conditions
For long positions: The position is closed when a sell signal is generated by the Chandelier Exit.
For short positions: The position is closed when a buy signal is generated by the Chandelier Exit.
Risk Management
Account Size: 1,000,00 yen
Commission and Slippage: 17 pips commission and 1 pip slippage per trade
Risk per Trade: 10% of account equity
Stop Loss: For long trades, the stop loss is placed slightly below the candle that generated the buy signal. For short trades, the stop loss is placed slightly above the candle that generated the sell signal. The stop loss levels are dynamically adjusted based on the ATR.
Settings Options
ATR Period: Set the period for calculating the ATR to determine the Chandelier Exit levels.
ATR Multiplier: Set the multiplier for ATR to define the distance of stop loss levels from the highest high or lowest low.
Use Close Price for Extremums: Choose whether to use the close price for calculating the extremums.
EMA Period: Set the period for the EMA to adjust the trend filter sensitivity.
Show Buy/Sell Labels: Choose whether to display buy and sell labels on the chart for visual confirmation.
Highlight State: Choose whether to highlight the bullish or bearish state on the chart.
Sufficient Sample Size
The strategy has been backtested with a sufficient sample size to evaluate its performance accurately. This ensures that the strategy's results are statistically significant and reliable.
Notes
This strategy is based on historical data and does not guarantee future results.
Thoroughly backtest and validate results before using in live trading.
Market volatility and other external factors can affect performance and may not yield expected results.
Acknowledgment
This strategy uses the Chandelier Exit indicator. Special thanks to the original contributors for their work on the Chandelier Exit concept.
Clean Chart Explanation
The script is published with a clean chart to ensure that its output is readily identifiable and easy to understand. No other scripts are included on the chart, and any drawings or images used are specifically to illustrate how the script works.

Moving Average Crossover Swing StrategyMoving Average Crossover Swing Strategy
**Overview:**
The basic concept of this strategy is to generate a signal when a faster/shorter length moving average crosses over (for Longs) or crosses under (for Shorts) a medium/longer length moving average. All of which are customizable. This strategy can work on any timeframe, however the daily is the timeframe used for the default settings and screenshots, as it was designed to be a multi-day swing strategy. Once a signal has been confirmed with a candle close, based on user options, the strategy will enter the trade on the open of the next candle.
The crossover strategy is nothing new to trading, but what can make this strategy unique and helpful, is the addition of further confirmation points, ATR based stop loss and take profit targets, optional early exit criteria, customizable to your needs and style, and just about everything visual can be toggled on/off. This strategy is based on a Trend (MA) indicator and a Momentum (MACD) indicator. While a Volume-based indicator is not shown here, one could consider using their favorite from that category to further compliment the signal idea.
It should be noted that depending on the time frame, direction(s) chosen, the signal options, confirmation options, and exit options selected, that a ticker may not produce more than 100 trades on the back test. Depending on your style and frequency, one could consider adjusting options and/or testing multiple tickers. It should also be noted that this strategy simply tests the underlying stock prices, not options contracts. And of course, testing this strategy against historical data does not assume that the same results will occur in future price action.
Shoutout given to Ripster's Clouds Indicator as pieces of that code were taken and modified to create both the Cloud visualization effects, and the Moving Average Pair Plots that are implemented in this strategy.
BASIC DEFAULTS
All can be changed as normal
Initial capital = 10,000
Order Sizing = 25% of equity (use the "Inputs" tab to modify this)
Pyramiding = 0
Commission = 0.65 USD per order
Price Verification = 1 tick
Slippage = 1 tick
RISK MANAGMENT
You will notice two different percentage options and ATR multipliers. This strategy will adjust position sizing by not exceeding either one of those % values based on the ATR (Average True Range) of the symbol and the multipliers selected, should the stock hit the stop loss price.
For Example, lets assume these values are true:
Account size = $10,000,
Max Risk = 1% of account size
Max Position Size = 25% of the account size
Stock Price = 23.45
ATR = 3.5
ATR Stop Loss Multiplier = 1.4
Then the formulas would be:
ACCT_SIZE * MaxRisk_% = 10000 * .01 = $100 (MaxCashRisk)
-----
MaxCashRisk / (ATR * ATR_SL_MULTIPLIER) = 100 / (3.5 * 1.4) = 20.4 Shares based on Max Cash Risk
-----
(ACCT_SIZE * MaxEquity_%) / STOCK_PRICE = (10000 * .25) / 23.45 = 106.61 Shares based on Max Equity Allocation
The minimum value of each of those options is then used, which in this case would be to purchase 20 shares so as not to exceed the max dollar risk should the stock reach the stop loss target. Likewise, if the ATR were to be much lower, say 0.48 cents, and all else the same, then the strategy would purchase the 106 shares based on Max Equity Allocation because the Max Cash Risk would require 149.25 shares.
MOVING AVERAGE OPTIONS
Select between and change the length & type of up to 5 pairs (10 total) of moving averages
The "Show Cloud-x" option will display a fill color between the "a" and "b" pairs
All moving averages lines can be toggled on/off in the "Style" tab, as well as adjusting their colors.
Visualization features do not affect calculations, meaning you could have all or nothing on the chart and the strategy will still produce results
SIGNAL CHOICES
Choose the fast/shorter length MA and the medium/longer length MA to determine the entry signal
CONFIRMATION OPTIONS
Both of these have customizable values and can be toggled on/off
A candle close over a slower/much longer length moving average
An additional cross-over (cross-under for Shorts) on the MACD indicator using default MACD values. While the MACD indicator is not necessary to have on the chart, it can help to add that for visualization. The calculations will perform whether the indicator is on the chart or not.
EARLY EXIT CRITERIA
Both can be toggled on/off with customizable values
MA Cross Exit will exit the trade early if the select moving averages cross-under (for longs) or cross-over (for shorts), indicating a potential reversal.
Max Bars in Trades will act as a last-resort exit by simply calculating the amount of full bars the trade has been open, and exiting on the opening of the next bar. For example: the default value is 8 bars, so after 8 full bars in the trade, if no other exit has been triggered (Stop Loss, Take Profit, or MA Cross(if enabled)), then the trade will exit at the opening of the 9th bar.
Finally, there is a table displaying the amount of trades taken for each side, and the amount & percent of both early exits. This table can be turned off in the "Style" tab
ADDITIONAL PLOTS
MACD (Moving Average Convergence/Divergence):
- The MACD is an optional confirmation indicator for this strategy.
- Plotting the indicator is not necessary for the strategy to work, but it can be helpful to visually see the status and position of the MACD if this feature is enabled in the strategy
- This helps to identify if there is also momentum behind the entry signal

AlgoBuilder [Mean-Reversion] | FractalystWhat's the strategy's purpose and functionality?
This strategy is designed for both traders and investors looking to rely and trade based on historical and backtested data using automation.
The main goal is to build profitable mean-reversion strategies that outperform the underlying asset in terms of returns while minimizing drawdown.
For example, as for a benchmark, if the S&P 500 (SPX) has achieved an estimated 10% annual return with a maximum drawdown of -57% over the past 20 years, using this strategy with different entry and exit techniques, users can potentially seek ways to achieve a higher Compound Annual Growth Rate (CAGR) while maintaining a lower maximum drawdown.
Although the strategy can be applied to all markets and timeframes, it is most effective on stocks, indices, future markets, cryptocurrencies, and commodities and JPY currency pairs given their trending behaviors.
In trending market conditions, the strategy employs a combination of moving averages and diverse entry models to identify and capitalize on upward market movements. It integrates market structure-based moving averages and bands mechanisms across different timeframes and provides exit techniques, including percentage-based and risk-reward (RR) based take profit levels.
Additionally, the strategy has also a feature that includes a built-in probability function for traders who want to implement probabilities right into their trading strategies.
Performance summary, weekly, and monthly tables enable quick visualization of performance metrics like net profit, maximum drawdown, profit factor, average trade, average risk-reward ratio (RR), and more.
This aids optimization to meet specific goals and risk tolerance levels effectively.
-----
How does the strategy perform for both investors and traders?
The strategy has two main modes, tailored for different market participants: Traders and Investors.
Trading:
1. Trading:
- Designed for traders looking to capitalize on bullish trending markets.
- Utilizes a percentage risk per trade to manage risk and optimize returns.
- Suitable for active trading with a focus on mean-reversion and risk per trade approach.
◓: Mode | %: Risk percentage per trade
3. Investing:
- Geared towards investors who aim to capitalize on bullish trending markets without using leverage while mitigating the asset's maximum drawdown.
- Utilizes pre-define percentage of the equity to buy, hold, and manage the asset.
- Focuses on long-term growth and capital appreciation by fully investing in the asset during bullish conditions.
- ◓: Mode | %: Risk not applied (In investing mode, the strategy uses 10% of equity to buy the asset)
-----
What's is FRMA? How does the triple bands work? What are the underlying calculations?
Middle Band (FRMA):
The middle band is the core of the FRMA system. It represents the Fractalyst Moving Average, calculated by identifying the most recent external swing highs and lows in the market structure.
By determining these external swing pivot points, which act as significant highs and lows within the market range, the FRMA provides a unique moving average that adapts to market structure changes.
Upper Band:
The upper band shows the average price of the most recent external swing highs.
External swing highs are identified as the highest points between pivot points in the market structure.
This band helps traders identify potential overbought conditions when prices approach or exceed this upper band.
Lower Band:
The lower band shows the average price of the most recent external swing lows.
External swing lows are identified as the lowest points between pivot points in the market structure.
The script utilizes this band to identify potential oversold conditions, triggering entry signals as prices approach or drop below the lower band.
Adjustments Based on User Inputs:
Users can adjust how the upper and lower bands are calculated based on their preferences:
Upper/Lower: This method calculates the average bands using the prices of external swing highs and lows identified in the market.
Percentage Deviation from FRMA: Alternatively, users can opt to calculate the bands based on a percentage deviation from the middle FRMA. This approach provides flexibility to adjust the width of the bands relative to market conditions and volatility.
-----
What's the purpose of using moving averages in this strategy? What are the underlying calculations?
Using moving averages is a widely-used technique to trade with the trend.
The main purpose of using moving averages in this strategy is to filter out bearish price action and to only take trades when the price is trading ABOVE specified moving averages.
The script uses different types of moving averages with user-adjustable timeframes and periods/lengths, allowing traders to try out different variations to maximize strategy performance and minimize drawdowns.
By applying these calculations, the strategy effectively identifies bullish trends and avoids market conditions that are not conducive to profitable trades.
The MA filter allows traders to choose whether they want a specific moving average above or below another one as their entry condition.
This comparison filter can be turned on (>) or off.
For example, you can set the filter so that MA#1 > MA#2, meaning the first moving average must be above the second one before the script looks for entry conditions. This adds an extra layer of trend confirmation, ensuring that trades are only taken in more favorable market conditions.
⍺: MA Period | Σ: MA Timeframe
-----
What entry modes are used in this strategy? What are the underlying calculations?
The strategy by default uses two different techniques for the entry criteria with user-adjustable left and right bars: Breakout and Fractal.
1. Breakout Entries :
- The strategy looks for pivot high points with a default period of 3.
- It stores the most recent high level in a variable.
- When the price crosses above this most recent level, the strategy checks if all conditions are met and the bar is closed before taking the buy entry.
◧: Pivot high left bars period | ◨: Pivot high right bars period
2. Fractal Entries :
- The strategy looks for pivot low points with a default period of 3.
- When a pivot low is detected, the strategy checks if all conditions are met and the bar is closed before taking the buy entry.
◧: Pivot low left bars period | ◨: Pivot low right bars period
2. Hunt Entries :
- The strategy identifies a candle that wicks through the lower FRMA band.
- It waits for the next candle to close above the low of the wick candle.
- When this condition is met and the bar is closed, the strategy takes the buy entry.
By utilizing these entry modes, the strategy aims to capitalize on bullish price movements while ensuring that the necessary conditions are met to validate the entry points.
-----
What type of stop-loss identification method are used in this strategy? What are the underlying calculations?
Initial Stop-Loss:
1. ATR Based:
The Average True Range (ATR) is a method used in technical analysis to measure volatility. It is not used to indicate the direction of price but to measure volatility, especially volatility caused by price gaps or limit moves.
Calculation:
- To calculate the ATR, the True Range (TR) first needs to be identified. The TR takes into account the most current period high/low range as well as the previous period close.
The True Range is the largest of the following:
- Current Period High minus Current Period Low
- Absolute Value of Current Period High minus Previous Period Close
- Absolute Value of Current Period Low minus Previous Period Close
- The ATR is then calculated as the moving average of the TR over a specified period. (The default period is 14).
Example - ATR (14) * 2
⍺: ATR period | Σ: ATR Multiplier
2. ADR Based:
The Average Day Range (ADR) is an indicator that measures the volatility of an asset by showing the average movement of the price between the high and the low over the last several days.
Calculation:
- To calculate the ADR for a particular day:
- Calculate the average of the high prices over a specified number of days.
- Calculate the average of the low prices over the same number of days.
- Find the difference between these average values.
- The default period for calculating the ADR is 14 days. A shorter period may introduce more noise, while a longer period may be slower to react to new market movements.
Example - ADR (20) * 2
⍺: ADR period | Σ: ADR Multiplier
3. PL Based:
This method places the stop-loss at the low of the previous candle.
If the current entry is based on the hunt entry strategy, the stop-loss will be placed at the low of the candle that wicks through the lower FRMA band.
Example:
If the previous candle's low is 100, then the stop-loss will be set at 100.
This method ensures the stop-loss is placed just below the most recent significant low, providing a logical and immediate level for risk management.
Application in Strategy (ATR/ADR):
- The strategy calculates the current bar's ADR/ATR with a user-defined period.
- It then multiplies the ADR/ATR by a user-defined multiplier to determine the initial stop-loss level.
By using these methods, the strategy dynamically adjusts the initial stop-loss based on market volatility, helping to protect against adverse price movements while allowing for enough room for trades to develop.
Each market behaves differently across various timeframes, and it is essential to test different parameters and optimizations to find out which trailing stop-loss method gives you the desired results and performance.
-----
What type of break-even and take profit identification methods are used in this strategy? What are the underlying calculations?
For Break-Even:
Percentage (%) Based:
Moves the initial stop-loss to the entry price when the price reaches a certain percentage above the entry.
Calculation:
Break-even level = Entry Price * (1 + Percentage / 100)
Example:
If the entry price is $100 and the break-even percentage is 5%, the break-even level is $100 * 1.05 = $105.
Risk-to-Reward (RR) Based:
Moves the initial stop-loss to the entry price when the price reaches a certain RR ratio.
Calculation:
Break-even level = Entry Price + (Initial Risk * RR Ratio)
Example:
If the entry price is $100, the initial risk is $10, and the RR ratio is 2, the break-even level is $100 + ($10 * 2) = $120.
FRMA Based:
Moves the stop-loss to break-even when the price hits the FRMA level at which the entry was taken.
Calculation:
Break-even level = FRMA level at the entry
Example:
If the FRMA level at entry is $102, the break-even level is set to $102 when the price reaches $102.
For TP1 (Take Profit 1):
- You can choose to set a take profit level at which your position gets fully closed or 50% if the TP2 boolean is enabled.
- Similar to break-even, you can select either a percentage (%) or risk-to-reward (RR) based take profit level, allowing you to set your TP1 level as a percentage amount above the entry price or based on RR.
For TP2 (Take Profit 2):
- You can choose to set a take profit level at which your position gets fully closed.
- As with break-even and TP1, you can select either a percentage (%) or risk-to-reward (RR) based take profit level, allowing you to set your TP2 level as a percentage amount above the entry price or based on RR.
When Both Percentage (%) Based and RR Based Take Profit Levels Are Off:
The script will adjust the take profit level to the higher FRMA band set within user inputs.
Calculation:
Take profit level = Higher FRMA band length/timeframe specified by the user.
This ensures that when neither percentage-based nor risk-to-reward-based take profit methods are enabled, the strategy defaults to using the higher FRMA band as the take profit level, providing a consistent and structured approach to profit-taking.
For TP1 and TP2, it's specifying the price levels at which the position is partially or fully closed based on the chosen method (percentage or RR) above the entry price.
These calculations are crucial for managing risk and optimizing profitability in the strategy.
⍺: BE/TP type (%/RR) | Σ: how many RR/% above the current price
-----
What's the ADR filter? What does it do? What are the underlying calculations?
The Average Day Range (ADR) measures the volatility of an asset by showing the average movement of the price between the high and the low over the last several days.
The period of the ADR filter used in this strategy is tied to the same period you've used for your initial stop-loss.
Users can define the minimum ADR they want to be met before the script looks for entry conditions.
ADR Bias Filter:
- Compares the current bar ADR with the ADR (Defined by user):
- If the current ADR is higher, it indicates that volatility has increased compared to ADR (DbU).(⬆)
- If the current ADR is lower, it indicates that volatility has decreased compared to ADR (DbU).(⬇)
Calculations:
1. Calculate ADR:
- Average the high prices over the specified period.
- Average the low prices over the same period.
- Find the difference between these average values in %.
2. Current ADR vs. ADR (DbU):
- Calculate the ADR for the current bar.
- Calculate the ADR (DbU).
- Compare the two values to determine if volatility has increased or decreased.
By using the ADR filter, the strategy ensures that trades are only taken in favorable market conditions where volatility meets the user's defined threshold, thus optimizing entry conditions and potentially improving the overall performance of the strategy.
>: Minimum required ADR for entry | %: Current ADR comparison to ADR of 14 days ago.
-----
What's the probability filter? What are the underlying calculations?
The probability filter is designed to enhance trade entries by using buyside liquidity and probability analysis to filter out unfavorable conditions.
This filter helps in identifying optimal entry points where the likelihood of a profitable trade is higher.
Calculations:
1. Understanding Swing highs and Swing Lows
Swing High: A Swing High is formed when there is a high with 2 lower highs to the left and right.
Swing Low: A Swing Low is formed when there is a low with 2 higher lows to the left and right.
2. Understanding the purpose and the underlying calculations behind Buyside, Sellside and Equilibrium levels.
3. Understanding probability calculations
1. Upon the formation of a new range, the script waits for the price to reach and tap into equilibrium or the 50% level. Status: "⏸" - Inactive
2. Once equilibrium is tapped into, the equilibrium status becomes activated and it waits for either liquidity side to be hit. Status: "▶" - Active
3. If the buyside liquidity is hit, the script adds to the count of successful buyside liquidity occurrences. Similarly, if the sellside is tapped, it records successful sellside liquidity occurrences.
5. Finally, the number of successful occurrences for each side is divided by the overall count individually to calculate the range probabilities.
Note: The calculations are performed independently for each directional range. A range is considered bearish if the previous breakout was through a sellside liquidity. Conversely, a range is considered bullish if the most recent breakout was through a buyside liquidity.
Example - BSL > 55%
-----
What's the range length Filter? What are the underlying calculations?
The range length filter identifies the price distance between buyside and sellside liquidity levels in percentage terms. When enabled, the script only looks for entries when the minimum range length is met. This helps ensure that trades are taken in markets with sufficient price movement.
Calculations:
Range Length (%) = ( ( Buyside Level − Sellside Level ) / Current Price ) ×100
Range Bias Identification:
Bullish Bias: The current range price has broken above the previous external swing high.
Bearish Bias: The current range price has broken below the previous external swing low.
Example - Range length filter is enabled | Range must be above 1%
>: Minimum required range length for entry | %: Current range length percentage in a (Bullish/Bearish) range
-----
What's the day filter Filter, what does it do?
The day filter allows users to customize the session time and choose the specific days they want to include in the strategy session. This helps traders tailor their strategies to particular trading sessions or days of the week when they believe the market conditions are more favorable for their trading style.
Customize Session Time:
Users can define the start and end times for the trading session.
This allows the strategy to only consider trades within the specified time window, focusing on periods of higher market activity or preferred trading hours.
Select Days:
Users can select which days of the week to include in the strategy.
This feature is useful for excluding days with historically lower volatility or unfavorable trading conditions (e.g., Mondays or Fridays).
Benefits:
Focus on Optimal Trading Periods:
By customizing session times and days, traders can focus on periods when the market is more likely to present profitable opportunities.
Avoid Unfavorable Conditions:
Excluding specific days or times can help avoid trading during periods of low liquidity or high unpredictability, such as major news events or holidays.
Increased Flexibility: The filter provides increased flexibility, allowing traders to adapt the strategy to their specific needs and preferences.
Example - Day filter | Session Filter
θ: Session time | Exchange time-zone
-----
What tables are available in this script?
Table Type:
- Summary: Provides a general overview, displaying key performance parameters such as Net Profit, Profit Factor, Max Drawdown, Average Trade, Closed Trades and more.
Avg Trade: The sum of money gained or lost by the average trade generated by a strategy. Calculated by dividing the Net Profit by the overall number of closed trades. An important value since it must be large enough to cover the commission and slippage costs of trading the strategy and still bring a profit.
MaxDD: Displays the largest drawdown of losses, i.e., the maximum possible loss that the strategy could have incurred among all of the trades it has made. This value is calculated separately for every bar that the strategy spends with an open position.
Profit Factor: The amount of money a trading strategy made for every unit of money it lost (in the selected currency). This value is calculated by dividing gross profits by gross losses.
Avg RR: This is calculated by dividing the average winning trade by the average losing trade. This field is not a very meaningful value by itself because it does not take into account the ratio of the number of winning vs losing trades, and strategies can have different approaches to profitability. A strategy may trade at every possibility in order to capture many small profits, yet have an average losing trade greater than the average winning trade. The higher this value is, the better, but it should be considered together with the percentage of winning trades and the net profit.
Winrate: The percentage of winning trades generated by a strategy. Calculated by dividing the number of winning trades by the total number of closed trades generated by a strategy. Percent profitable is not a very reliable measure by itself. A strategy could have many small winning trades, making the percent profitable high with a small average winning trade, or a few big winning trades accounting for a low percent profitable and a big average winning trade. Most mean-reversion successful strategies have a percent profitability of 40-80% but are profitable due to risk management control.
BE Trades: Number of break-even trades, excluding commission/slippage.
Losing Trades: The total number of losing trades generated by the strategy.
Winning Trades: The total number of winning trades generated by the strategy.
Total Trades: Total number of taken traders visible your charts.
Net Profit: The overall profit or loss (in the selected currency) achieved by the trading strategy in the test period. The value is the sum of all values from the Profit column (on the List of Trades tab), taking into account the sign.
- Monthly: Displays performance data on a month-by-month basis, allowing users to analyze performance trends over each month.
- Weekly: Displays performance data on a week-by-week basis, helping users to understand weekly performance variations.
- OFF: Hides the performance table.
Profit Color:
- Allows users to set the color for representing profit in the performance table, helping to quickly distinguish profitable periods.
Loss Color:
- Allows users to set the color for representing loss in the performance table, helping to quickly identify loss-making periods.
These customizable tables provide traders with flexible and detailed performance analysis, aiding in better strategy evaluation and optimization.
-----
User-input styles and customizations:
To facilitate studying historical data, all conditions and rules can be applied to your charts. By plotting background colors on your charts, you'll be able to identify what worked and what didn't in certain market conditions.
Please note that all background colors in the style are disabled by default to enhance visualization.
-----
How to Use This Algobuilder to Create a Profitable Edge and System:
Choose Your Strategy mode:
- Decide whether you are creating an investing strategy or a trading strategy.
Select a Market:
- Choose a one-sided market such as stocks, indices, or cryptocurrencies.
Historical Data:
- Ensure the historical data covers at least 10 years of price action for robust backtesting.
Timeframe Selection:
- Choose the timeframe you are comfortable trading with. It is strongly recommended to use a timeframe above 15 minutes to minimize the impact of commissions/slippage on your profits.
Set Commission and Slippage:
- Properly set the commission and slippage in the strategy properties according to your broker or prop firm specifications.
Parameter Optimization:
- Use trial and error to test different parameters until you find the performance results you are looking for in the summary table or, preferably, through deep backtesting using the strategy tester.
Trade Count:
- Ensure the number of trades is 100 or more; the higher, the better for statistical significance.
Positive Average Trade:
- Make sure the average trade value is above zero.
(An important value since it must be large enough to cover the commission and slippage costs of trading the strategy and still bring a profit.)
Performance Metrics:
- Look for a high profit factor, and net profit with minimum drawdown.
- Ideally, aim for a drawdown under 20-30%, depending on your risk tolerance.
Refinement and Optimization:
- Try out different markets and timeframes.
- Continue working on refining your edge using the available filters and components to further optimize your strategy.
Automation:
- Once you’re confident in your strategy, you can use the automation section to connect the algorithm to your broker or prop firm.
- Trade a fully automated and backtested trading strategy, allowing for hands-free execution and management.
-----
What makes this strategy original?
1. Incorporating direct integration of probabilities into the strategy.
2. Utilizing built-in market structure-based moving averages across various timeframes.
4. Offering both investing and trading strategies, facilitating optimization from different perspectives.
5. Automation for efficient execution.
6. Providing a summary table for instant access to key parameters of the strategy.
-----
How to use automation?
For Traders:
1. Ensure the strategy parameters are properly set based on your optimized parameters.
2. Enter your PineConnector License ID in the designated field.
3. Specify the desired risk level.
4. Provide the Metatrader symbol.
5. Check for chart updates to ensure the automation table appears on the top right corner, displaying your License ID, risk, and symbol.
6. Set up an alert with the strategy selected as Condition and the Message as {{strategy.order.alert_message}}.
7. Activate the Webhook URL in the Notifications section, setting it as the official PineConnector webhook address.
8. Double-check all settings on PineConnector to ensure the connection is successful.
9. Create the alert for entry/exit automation.
For Investors:
1. Ensure the strategy parameters are properly set based on your optimized parameters.
2. Choose "Investing" in the user-input settings.
3. Create an alert with a specified name.
4. Customize the notifications tab to receive alerts via email.
5. Buying/selling alerts will be triggered instantly upon entry or exit order execution.
-----
Terms and Conditions | Disclaimer
Our charting tools are provided for informational and educational purposes only and should not be construed as financial, investment, or trading advice. They are not intended to forecast market movements or offer specific recommendations. Users should understand that past performance does not guarantee future results and should not base financial decisions solely on historical data.
Built-in components, features, and functionalities of our charting tools are the intellectual property of @Fractalyst Unauthorized use, reproduction, or distribution of these proprietary elements is prohibited.
By continuing to use our charting tools, the user acknowledges and accepts the Terms and Conditions outlined in this legal disclaimer and agrees to respect our intellectual property rights and comply with all applicable laws and regulations.

Strategy SEMA SDI WebhookPurpose of the Code:
The strategy utilizes Exponential Moving Averages (EMA) and Smoothed Directional Indicators (SDI) to generate buy and sell signals. It includes features like leverage, take profit, stop loss, and trailing stops. The strategy is intended for backtesting and automating trades based on the specified indicators and conditions.
Key Components and Functionalities:
1.Strategy Settings:
Overlay: The strategy will overlay on the price chart.
Slippage: Set to 1.
Commission Value: Set to 0.035.
Default Quantity Type: Percent of equity.
Default Quantity Value: 50% of equity.
Initial Capital: Set to 1000 units.
Calculation on Order Fills: Enabled.
Process Orders on Close: Enabled.
2.Date and Time Filters:
Inputs for enabling/disabling start and end dates.
Filters to execute strategy only within specified date range.
3.Leverage and Quantity:
Leverage: Adjustable leverage input (default 3).
USD Percentage: Adjustable percentage of equity to use for trades (default 50%).
Initial Capital: Calculated based on leverage and percentage of equity.
4.Take Profit, Stop Loss, and Trailing Stop:
Inputs for enabling/disabling take profit, stop loss, and trailing stop.
Adjustable parameters for take profit percentage (default 25%), stop loss percentage (default 4.8%), and trailing stop percentage (default 1.9%).
Calculations for take profit, stop loss, trailing price, and maximum profit tracking.
5.EMA Calculations:
Fast and slow EMAs.
Smoothed versions of the fast and slow EMAs.
6.SDI Calculations:
Directional movement calculation for positive and negative directional indicators.
Difference between the positive and negative directional indicators, smoothed.
7.Buy/Sell Conditions:
Long (Buy) Condition: Positive DI is greater than negative DI, and fast EMA is greater than slow EMA.
Short (Sell) Condition: Negative DI is greater than positive DI, and fast EMA is less than slow EMA.
8.Strategy Execution:
If buy conditions are met, close any short positions and enter a long position.
If sell conditions are met, close any long positions and enter a short position.
Exit conditions for long and short positions based on take profit, stop loss, and trailing stop levels.
Close all positions if outside the specified date range.
Usage:
This strategy is used to automate trading based on the specified conditions involving EMAs and SDI. It allows backtesting to evaluate performance based on historical data. The strategy includes risk management through take profit, stop loss, and trailing stops to protect gains and limit losses. Traders can customize the parameters to fit their specific trading preferences and risk tolerance. Differently, it can perform leverage analysis and use it as a template.
By using this strategy, traders can systematically execute trades based on technical indicators, helping to remove emotional bias and improve consistency in trading decisions.
Important Note:
This script is provided for educational and template purposes and does not constitute financial advice. Traders and investors should conduct their research and analysis before making any trading decisions.

Smoothed Heiken Ashi Strategy Long OnlyThis is a trend-following approach that uses a modified version of Heiken Ashi candles with additional smoothing. Here are the key components and features:
1. Heiken Ashi Modification: The strategy starts by calculating Heiken Ashi candles, which are known for better trend visualization. However, it modifies the traditional Heiken Ashi by using Exponential Moving Averages (EMAs) of the open, high, low, and close prices.
2. Double Smoothing: The strategy applies two layers of smoothing. First, it uses EMAs to calculate the Heiken Ashi values. Then, it applies another EMA to the Heiken Ashi open and close prices. This double smoothing aims to reduce noise and provide clearer trend signals.
3. Long-Only Approach: As the name suggests, this strategy only takes long positions. It doesn't short the market during downtrends but instead exits existing long positions when the sell signal is triggered.
4. Entry and Exit Conditions:
- Entry (Buy): When the smoothed Heiken Ashi candle color changes from red to green (indicating a potential start of an uptrend).
- Exit (Sell): When the smoothed Heiken Ashi candle color changes from green to red (indicating a potential end of an uptrend).
5. Position Sizing: The strategy uses a percentage of equity for position sizing, defaulting to 100% of available equity per trade. This should be tailored to each persons unique approach. Responsible trading would use less than 5% for each trade. The starting capital used is a responsible and conservative $1000, reflecting the average trader.
This strategy aims to provide a smooth, trend-following approach that may be particularly useful in markets with clear, sustained trends. However, it may lag in choppy or ranging markets due to its heavy smoothing. As with any strategy, it's important to thoroughly backtest and forward test before using it with real capital, and to consider using it in conjunction with other analysis tools and risk management techniques.
This has been created mainly to provide data to judge what time frame is most profitable for any single asset, as the volatility of each asset is different. This can bee seen using it on AUXUSD, which has a higher profitable result on the daily time frame, whereas other currencies need a higher or lower time frame. The user can toggle between each time frame and watch for the higher profit results within the strategy tester window.
Other smoothed Heiken Ashi indicators also do not provide buy and sell signals, and only show the change in color to dictate a change in trend. By adding buy and sell signals after the close of the candle in which the candle changes color, alerts can be programmed, which helps this be a more hands off protocol to experiment with. Other smoothed Heiken Ashi indicators do not allow for alarms to be set.
This is a unique HODL strategy which helps identify a change in trend, without the noise of day to day volatility. By switching to a line chart, it removes the candles altogether to avoid even more noise. The goal is to HODL a coin while the color is bullish in an uptrend, but once the indicator gives a sell signal, to sell the holdings back to a stable coin and let the chart ride down. Once the chart gives the next buy signal, use that same capital to buy back into the asset. In essence this removes potential losses, and helps buy back in cheaper, gaining more quantitity fo the asset, and therefore reducing your average initial buy in price.
Most HODL strategies ride the price up, miss selling at the top, then riding the price back down in anticipation that it will go back up to sell. This strategy will not hit the absolute tops, but it will greatly reduce potential losses.

FVG Positioning Average with 200EMA Auto Trading [Pakun]Description
Strategy Name and Purpose
FVG Positioning Average with 200EMA Auto Trading
This strategy uses Fair Value Gaps (FVG) combined with a 200-period Exponential Moving Average (EMA) and Average True Range (ATR) to generate trend-based trading signals. It is designed to help traders identify high-probability entry points by leveraging the gaps between fair value prices and current market prices.
Originality and Usefulness
This script combines multiple indicators to create a cohesive trading strategy that is greater than the sum of its parts. While FVG is a powerful tool on its own, combining it with the EMA and ATR adds layers of confirmation and risk management, enhancing its effectiveness. Here’s how the components work together:
Fair Value Gap (FVG): Identifies gaps in the market where price action has not fully filled, indicating potential reversal or continuation points.
200-period Exponential Moving Average (EMA): Acts as a trend filter to ensure trades are taken in the direction of the overall trend, improving the probability of success.
Average True Range (ATR): Used to filter out insignificant gaps and set dynamic stop-loss levels based on market volatility, enhancing risk management.
Entry Conditions
Long Entry
The close price crosses above the downtrend FVG.
The close price, FVG up average, and down average are all above the 200 EMA, indicating a strong bullish trend.
Short Entry
The close price crosses below the uptrend FVG.
The close price, FVG up average, and down average are all below the 200 EMA, indicating a strong bearish trend.
Exit Conditions
For long positions, the stop loss is set at the recent low, and the take profit is set at a point with a risk-reward ratio of 1:1.5.
For short positions, the stop loss is set at the recent high, and the take profit is set at a point with a risk-reward ratio of 1:1.5.
Risk Management
Account Size: 1,000,000 yen
Commission and Slippage: 2 pips commission and 1 pip slippage per trade
Risk per Trade: 10% of account equity
The stop loss is based on the recent low or recent high, ensuring trades are exited when the market moves against the position.
Settings Options
FVG Lookback: Set the lookback period for calculating FVGs.
Lookback Type: Choose the type of lookback (Bar Count or FVG Count).
ATR Multiplier: Set the multiplier for ATR to filter significant gaps.
EMA Period: Set the period for the EMA to adjust the trend filter sensitivity.
Show FVGs on Chart: Choose whether to display FVGs on the chart for visual confirmation.
Bullish/Bearish Color: Set the color for bullish and bearish FVGs to distinguish them easily.
Show Gradient Areas: Choose whether to display gradient areas to highlight the zones of interest.
Sufficient Sample Size
The strategy has been backtested with 113 trades, providing a sufficient sample size to evaluate its performance.
Notes
This strategy is based on historical data and does not guarantee future results.
Thoroughly backtest and validate results before using in live trading.
Market volatility and other external factors can affect performance and may not yield expected results.
Acknowledgment
This strategy uses the FVG Positioning Average Strategy indicator. Thanks to for their contribution.
Clean Chart Explanation
The script is published with a clean chart to ensure that its output is readily identifiable and easy to understand. No other scripts are included on the chart, and any drawings or images used are specifically to illustrate how the script works.

HMA Crossover 1H with RSI, Stochastic RSI, and Trailing StopThe strategy script provided is a trading algorithm designed to help traders make informed buy and sell decisions based on certain technical indicators. Here’s a breakdown of what each part of the script does and how the strategy works:
Key Components:
Hull Moving Averages (HMA):
HMA 5: This is a Hull Moving Average calculated over 5 periods. HMAs are used to smooth out price data and identify trends more quickly than traditional moving averages.
HMA 20: This is another HMA but calculated over 20 periods, providing a broader view of the trend.
Relative Strength Index (RSI):
RSI 14: This is a momentum oscillator that measures the speed and change of price movements over a 14-period timeframe. It helps identify overbought or oversold conditions in the market.
Stochastic RSI:
%K: This is the main line of the Stochastic RSI, which combines the RSI and the Stochastic Oscillator to provide a more sensitive measure of overbought and oversold conditions. It is smoothed with a 3-period simple moving average.
Trading Signals:
Buy Signal:
Generated when the 5-period HMA crosses above the 20-period HMA, indicating a potential upward trend.
Additionally, the RSI must be below 45, suggesting that the market is not overbought.
The Stochastic RSI %K must also be below 39, confirming the oversold condition.
Sell Signal:
Generated when the 5-period HMA crosses below the 20-period HMA, indicating a potential downward trend.
The RSI must be above 60, suggesting that the market is not oversold.
The Stochastic RSI %K must also be above 63, confirming the overbought condition.
Trailing Stop Loss:
This feature helps protect profits by automatically selling the position if the price moves against the trade by 5%.
For sell positions, an additional trailing stop of 100 points is included.

MA MACD BB BackTesterOverview:
This Pine Script™ code provides a comprehensive backtesting tool that combines Moving Average (MA), Moving Average Convergence Divergence (MACD), and Bollinger Bands (BB). It is designed to help traders analyze market trends and make informed trading decisions by testing various strategies over historical data.
Key Features:
1. Customizable Indicators:
Moving Average (MA): Smooths out price data for clearer trend direction.
MACD: Measures trend momentum through MACD Line, Signal Line, and Histogram.
Bollinger Bands (BB): Identifies overbought or oversold conditions with upper and lower bands.
2. Flexible Trading Direction: Choose between long or short positions to adapt to different market conditions.
3. Risk Management: Efficiently allocate your capital with customizable position sizes.
4. Signal Generation:
Buy Signals: Triggered by crossovers for MACD, MA, and BB.
Sell Signals: Triggered by crossunders for MACD, MA, and BB.
5. Automated Trading: Automatically enter and exit trades based on signal conditions and strategy parameters.
How It Works:
1. Indicator Selection: Select your preferred indicator (MA, MACD, BB) and trading direction (Long/Short).
2. Risk Management Configuration: Set the percentage of capital to allocate per position to manage risk effectively.
3.Signal Detection: The algorithm identifies and plots buy/sell signals directly on the chart based on the chosen indicator.
4. Trade Execution: The strategy automatically enters and exits trades based on signal conditions and configured strategy parameters.
Use Cases:
- Backtesting: Evaluate the effectiveness of trading strategies using historical data to understand potential performance.
- Strategy Development: Customize and expand the strategy to incorporate additional indicators or conditions to fit specific trading styles.
ADDONS That Affect Strategy:
1. Indicator Parameters:
Adjustments to the settings of MACD (e.g., fast length, slow length), MA (e.g., length), and BB (e.g., length, multiplier) will directly impact the detection of signals and the strategy's performance.
2. Trading Direction:
Changing the trading direction (Long/Short) will alter the entry and exit conditions based on the detected signals.
3. Risk Management Settings:
Modifying the position size percentage affects capital allocation and overall risk exposure per trade.
ADDONS That Do Not Affect Strategy:
1. Visual Customizations:
Changes to the color, shape, and style of the plotted lines and signals do not impact the core functionality of the strategy but enhance visual clarity.
2. Text and Labels:
Modifying text labels for the signals (such as renaming "Buy MACD" to "MACD Buy Signal") is purely cosmetic and does not influence the strategy’s logic or outcomes.
Notes:
- Customization: The indicator is highly customizable to fit various trading styles and market conditions.
- Risk Management: Adjust position sizes and risk parameters according to your risk tolerance and account size.
- Optimization: Regularly backtest and optimize parameters to adapt to changing market dynamics for better performance.
Getting Started:
-Add the script to your chart.
-Adjust the input parameters to suit your analysis preferences.
-Observe the marked buy and sell signals on your chart to make informed trading decisions.

Uptrick:Intensity IndexPurpose:
The "Uptrick: Intensity Index" strategy is designed to provide traders with insights into the trend intensity of security by combining multiple moving averages and their relative positions. This versatile tool can be used effectively by both short-term and long-term traders to identify potential buy and sell signals based on specific conditions.
Explanation:
Input Parameters and Customization:
Moving Averages Lengths:
Adjust MA1, MA2, and MA3 lengths to change the calculation periods for the moving averages.
Trend Intensity Index SMA Length:
Adjust the length of the SMA applied to the TII.
Plot Colors:
Change the colors of the TII and TII MA plots for better visualization.
Background Colors and Transparency:
Set different colors for positive and negative TII MA values.
Control the transparency of the background color.
---------------------------------------------------------------------------
MA1 (Length 10): Short-term moving average, useful for capturing short-term market trends.
MA2 (Length 20): Medium-term moving average, providing a balanced view of market trends.
MA3 (Length 50): Long-term moving average, offering insights into long-term market trends.
The script calculates the relative positions of the closing price to each moving average (rel1, rel2, rel3) to determine how far the current price deviates from each average.
Trend Intensity Index (TII):
The TII is calculated as the average of the relative positions (rel1, rel2, rel3), multiplied by 100 to convert it into a percentage. This index reflects the overall intensity of the trend, considering short-term, medium-term, and long-term perspectives.
The TII is plotted in blue, providing a visual representation of trend intensity.
SMA of TII:
An additional SMA is applied to the TII (matii) to smooth out fluctuations and provide a clearer long-term trend signal.
The SMA of TII is plotted in orange, offering a reference for long-term trend analysis.
Determining Potential Price Movements:
For Short-Term Traders:
When the blue TII line crosses above the orange SMA of TII line, it indicates a potential buy signal.
When the blue TII line crosses below the orange SMA of TII line, it indicates a potential sell signal.
For Long-Term Traders:
When the orange SMA of TII line crosses above the highlighted 0 line, it indicates a potential buy signal.
When the orange SMA of TII line crosses below the highlighted 0 line, it indicates a potential sell signal.
Plotting and Visualization:
The TII and its SMA are plotted with distinct colors for easy identification.
A horizontal line at 0 is plotted in gray to serve as a reference point for long-term trend signals.
The background color changes based on the value of the SMA of TII (matii):
Green background for matii values above 0, indicating bullish conditions.
Red background for matii values below 0, indicating bearish conditions.
Utility and Potential Usage:
The "Uptrick: Intensity Index" indicator is a powerful tool for both short-term and long-term traders, offering clear buy and sell signals based on the crossover of the TII and its SMA, as well as the position of the SMA relative to the zero line.
By consolidating multiple moving averages and their relative positions into a single indicator, traders can gain comprehensive insights into market trends and intensity.
The ability to adjust all inputs and toggle visibility options enhances the flexibility and utility of the indicator, making it suitable for various trading styles and market conditions.
Through its versatile design and advanced features, the "Uptrick: Intensity Index" indicator equips traders with actionable insights into trend intensity and potential price movements. By integrating this robust tool into their trading strategies, traders can navigate the markets with greater precision and confidence, thereby enhancing their trading outcomes.
WHAT SETTINGS TO HAVE FOR THE MOVING AVERAGE:
Short-term traders (day traders) might prefer a shorter SMA length (e.g., 5-20 periods) as they are looking for quick signals and react to price changes more rapidly.
Medium-term traders (swing traders) might opt for a medium SMA length (e.g., 20-50 periods) which can filter out some noise and provide a clearer signal on the trend.
Long-term traders (position traders) might choose a longer SMA length (e.g., 50-200 periods) to get a broader view of the market trend and avoid reacting to short-term fluctuations.

Versatile Moving Average StrategyVersatile Moving Average Strategy (VMAS)
Overview:
The Versatile Moving Average Strategy (VMAS) is designed to provide traders with a flexible approach to trend-following, utilizing multiple types of moving averages. This strategy allows for customization in choosing the moving average type and length, catering to various market conditions and trading styles.
Key Features:
- Multiple Moving Average Types: Choose from SMA, EMA, SMMA (RMA), WMA, VWMA, HULL, LSMA, and ALMA to best suit your trading needs.
- Customizable Inputs: Adjust the moving average length, source of price data, and stop-loss source to fine-tune the strategy.
- Target Percent: Set the percentage difference between successive profit targets to manage your risk and rewards effectively.
- Position Management: Enable or disable long and short positions, allowing for versatility in different market conditions.
- Commission and Slippage: The strategy includes realistic commission settings to ensure accurate backtesting results.
Strategy Logic:
1. Moving Average Calculation: The selected moving average is calculated based on user-defined parameters.
2. Entry Conditions:
- A long position is entered when the entry source crosses over the moving average, if long positions are enabled.
- A short position is entered when the entry source crosses under the moving average, if short positions are enabled.
3. Stop-Loss: Positions are closed if the stop-loss source crosses the moving average in the opposite direction.
4. Profit Targets: Multiple profit targets are defined, with each target set at an incremental percentage above (for long positions) or below (for short positions) the entry price.
Default Properties:
- Account Size: $10000
- Commission: 0.01% per trade
- Risk Management: Positions are sized to risk 80% of the equity per trade, because we get very tight stoploss when position is open.
- Sample Size: Backtesting has been conducted to ensure a sufficient sample size of trades, ideally more than 100 trades.
How to Use:
1. Configure Inputs: Set your preferred moving average type, length, and other input parameters.
2. Enable Positions: Choose whether to enable long, short, or both types of positions.
3. Backtest and Analyze: Run backtests with realistic settings and analyze the results to ensure the strategy aligns with your trading goals.
4. Deploy and Monitor: Once satisfied with the backtesting results, deploy the strategy in a live environment and monitor its performance.
This strategy is suitable for traders looking to leverage moving averages in a versatile and customizable manner. Adjust the parameters to match your trading style and market conditions for optimal results.
Note: Ensure the strategy settings used for publication are the same as those described here. Always conduct thorough backtesting before deploying any strategy in a live trading environment.

IsAlgo - Support & Resistance Strategy► Overview:
The Support & Resistance Strategy is designed to identify critical support and resistance levels and execute trades when the price crosses these levels. Utilizing a combination of a moving average, ATR indicator, and the highest and lowest prices, this strategy aims to accurately pinpoint entry and exit points for trades based on market movements.
► Description:
The Support & Resistance Strategy leverages the ATR (Average True Range) and a moving average to identify key support and resistance levels. The strategy calculates these levels by measuring the distance between the current market price and the moving average. This distance is continuously compared with each new candle to provide an estimate of the support and resistance levels.
The ATR is utilized to determine the width of these levels, ensuring they adjust to market volatility. To validate these levels, the strategy counts how often a candle’s low or high touches the estimated support or resistance and then bounces back. A higher frequency of such touches indicates a stronger, more reliable level.
Once the levels are confirmed, the strategy waits for a candle to close above the resistance level or below the support level. A candle closing above the resistance triggers a long entry, while a candle closing below the support triggers a short entry.
The strategy incorporates multiple stop-loss options to manage risk effectively. These options include setting stop-loss levels based on fixed pips, ATR calculations, or the highest/lowest prices of previous candles. Up to three take-profit levels can be set using fixed pips, ATR, or risk-to-reward ratios. A trailing stop feature adjusts the stop loss as the trade moves into profit, and a break-even feature moves the stop loss to the entry price once a certain profit level is reached.
Additionally, the strategy can close trades if the price crosses the opposite support or resistance level or if a candle moves significantly against the trade direction.
↑ Long Entry Example:
↓ Short Entry Example:
► Features & Settings:
⚙︎ Levels: Configure the length, width, and ATR period for support and resistance levels.
⚙︎ Moving Average: Use an Exponential Moving Average (EMA) to confirm trend direction. This can be enabled or disabled.
⚙︎ Entry Candle: Define the minimum and maximum body size and the body-to-candle size ratio for entry candles.
⚙︎ Trading Session: Specify the trading hours during which the strategy operates.
⚙︎ Trading Days: Select which days of the week the strategy is active.
⚙︎ Backtesting: Set a backtesting period with start and end dates. This feature can be deactivated.
⚙︎ Trades: Customize trade direction (long, short, or both), position sizing (fixed or percentage-based), maximum open trades, and daily trade limits.
⚙︎ Trades Exit: Choose from various exit methods, including profit/loss limits, trade duration, or crossing the opposite support/resistance level.
⚙︎ Stop Loss: Set stop-loss levels using fixed pips, ATR-based calculations, or the highest/lowest price within a specified number of previous candles.
⚙︎ Break Even: Adjust the stop loss to break-even once certain profit conditions are met.
⚙︎ Trailing Stop: Automatically adjust the stop loss as the trade moves into profit.
⚙︎ Take Profit: Define up to three take-profit levels using fixed pips, ATR, or risk-to-reward ratios based on the stop loss.
⚙︎ Alerts: Receive alerts for significant actions such as trade openings and closings, with support for dynamic values.
⚙︎ Dashboard: A visual display on the chart providing detailed information about ongoing and past trades.
► Backtesting Details:
Timeframe: 1-hour US30 chart
Initial Balance: $10,000
Order Size: 5 Units
Commission: $0.5 per contract
Slippage: 5 ticks
Stop Loss: Based on the opposite support/resistance level or break-even adjustments

IsAlgo - Reverse Candle Strategy► Overview:
The Reverse Candle Strategy leverages a customizable moving average to identify the start of a trend. It utilizes the highest and lowest prices to define the trend and its corrections, executing trades based on custom candlestick patterns to capitalize on the main trend's continuation.
► Description:
The Reverse Candle Strategy is designed to effectively identify and trade market trends by combining moving averages and custom candlestick patterns. The core of the strategy is a single, customizable moving average, which helps determine the trend direction. When the market price crosses above the moving average, this signifies the beginning of an uptrend. The strategy then tracks the highest price reached during the uptrend and waits for a correction. A specific custom candlestick pattern signals the end of the correction, at which point the strategy executes a long trade.
In the case of a downtrend, the market price crossing below the moving average marks the trend’s start. The strategy monitors the lowest price during the downtrend and awaits a correction. The end of this correction is identified by another custom candlestick pattern, prompting the strategy to execute a short trade. This combination of a moving average with precise candlestick patterns ensures that trades are made at optimal moments, improving the likelihood of successful trades.
The integration of the moving average and candlestick patterns is critical. The moving average smooths out price data to highlight the trend direction, while the custom candlestick patterns provide specific entry signals after a correction, ensuring the trend’s resumption is genuine. This synergy enhances the strategy’s ability to filter out false signals and improve trade accuracy.
↑ Long Entry Example:
When the price is moving above the moving average and the highest price has been detected, the strategy will wait for the entry candle to execute the long trade.
↓ Short Entry Example:
When the price is moving below the moving average and the lowest price has been detected, the strategy will wait for the entry candle to execute the short trade.
✕ Exit Conditions:
To manage risk effectively, the strategy provides multiple stop-loss options. Traders can set stop-loss levels using fixed pips, ATR-based calculations, or the higher/lower price of past candles. Additionally, trades can be closed if a candle moves against the trade direction. Up to three take-profit levels can be set using fixed pips, ATR, or risk-to-reward ratios, allowing traders to secure profits at different stages. The trailing stop feature adjusts the stop loss as the trade moves into profit, locking in gains while allowing for continued potential upside. Furthermore, a break-even feature moves the stop loss to the entry price once a certain profit level is reached, protecting against losses. Trades can also be closed when the price crosses the moving average.
► Features & Settings:
⚙︎ Moving Average: Users can choose between various types of moving averages (e.g., SMA, EMA) to confirm the trend direction.
⚙︎ Trend & Corrections: Set minimum and maximum pips for trends and corrections, with an option to define correction percentages relative to the trend.
⚙︎ Entry Candle: Define the entry candle by specifying the minimum and maximum size of the candle's body and the ratio of the body to the entire candle size, ensuring significant breakouts trigger trades.
⚙︎ Trading Session: This feature allows users to define specific trading hours during which the strategy should operate, ensuring trades are executed only during preferred market periods.
⚙︎ Trading Days: Users can specify which days the strategy should be active, offering the flexibility to avoid trading on specific days of the week.
⚙︎ Backtesting: Enables a backtesting period during which the strategy can be tested over a selected start and end date. This feature can be deactivated if not needed.
⚙︎ Trades: Configure trade direction (long, short, or both), position sizing (fixed or percentage-based), maximum number of open trades, and daily trade limits.
⚙︎ Trades Exit: Various exit methods, such as setting profit or loss limits, trade duration, or closing trades on moving average crossings.
⚙︎ Stop Loss: Various stop-loss methods are available, including a fixed number of pips, ATR-based, or using the highest or lowest price points within a specified number of previous candles. Additionally, trades can be closed after a specific number of candles move in the opposite direction of the trade.
⚙︎ Break Even: This feature adjusts the stop loss to a break-even point once certain conditions are met, such as reaching predefined profit levels, to protect gains.
⚙︎ Trailing Stop: The trailing stop feature adjusts the stop loss as the trade moves into profit, securing gains while potentially capturing further upside.
⚙︎ Take Profit: up to three take-profit levels using fixed pips, ATR, or risk-to-reward ratios based on the stop loss. Alternatively, specify a set number of candles moving in the trade direction.
⚙︎ Alerts: The strategy includes a comprehensive alert system that informs the user of all significant actions, such as trade openings and closings. It supports placeholders for dynamic values like take-profit levels and stop-loss prices.
⚙︎ Dashboard: Visual display providing detailed information about ongoing and past trades on the chart, helping users monitor performance and make informed decisions.
► Backtesting Details:
Timeframe: 30-minute NAS100 chart
Initial Balance: $10,000
Order Size: 5 Units
Commission: $0.5 per contract
Slippage: 5 ticks
Stop Loss: MA Crossing or by break even

AlgoBuilder [Trend-Following] | FractalystWhat's the strategy's purpose and functionality?
This strategy is designed for both traders and investors looking to rely on and trade based on historical and backtested data using automation. The main goal is to build profitable trend-following strategies that outperform the underlying asset in terms of returns while minimizing drawdown. For example, as for a benchmark, if the S&P 500 (SPX) has achieved an estimated 10% annual return with a maximum drawdown of -57% over the past 20 years, using this strategy with different entry and exit techniques, users can potentially seek ways to achieve a higher Compound Annual Growth Rate (CAGR) while maintaining a lower maximum drawdown.
Although the strategy can be applied to all markets and timeframes, it is most effective on stocks, indices, future markets, cryptocurrencies, and commodities and JPY currency pairs given their trending behaviors.
In trending market conditions, the strategy employs a combination of moving averages and diverse entry models to identify and capitalize on upward market movements. It integrates market structure-based trailing stop-loss mechanisms across different timeframes and provides exit techniques, including percentage-based and risk-reward (RR) based take profit levels.
Additionally, the strategy has also a feature that includes a built-in probability and sentiment function for traders who want to implement probabilities and market sentiment right into their trading strategies.
Performance summary, weekly, and monthly tables enable quick visualization of performance metrics like net profit, maximum drawdown, compound annual growth rate (CAGR), profit factor, average trade, average risk-reward ratio (RR), and more. This aids optimization to meet specific goals and risk tolerance levels effectively.
-----
How does the strategy perform for both investors and traders?
The strategy has two main modes, tailored for different market participants: Traders and Investors.
Trading:
1. Trading (1x):
- Designed for traders looking to capitalize on bullish trending markets.
- Utilizes a percentage risk per trade to manage risk and optimize returns.
- Suitable for active trading with a focus on trend-following and risk management.
- (1x) This mode ensures no stacking of positions, allowing for only one running position or trade at a time.
◓: Mode | %: Risk percentage per trade
2. Trading (2x):
Similar to the 1x mode but allows for two pyramiding entries.
This approach enables traders to increase their position size as the trade moves in their favor, potentially enhancing profits during strong bullish trends.
◓: Mode | %: Risk percentage per trade
3. Investing:
- Geared towards investors who aim to capitalize on bullish trending markets without using leverage while mitigating the asset's maximum drawdown.
- Utilizes 100% of the equity to buy, hold, and manage the asset.
- Focuses on long-term growth and capital appreciation by fully investing in the asset during bullish conditions.
- ◓: Mode | %: Risk not applied (In investing mode, the strategy uses 100% of equity to buy the asset)
-----
What's the purpose of using moving averages in this strategy? What are the underlying calculations?
Using moving averages is a widely-used technique to trade with the trend.
The main purpose of using moving averages in this strategy is to filter out bearish price action and to only take trades when the price is trading ABOVE specified moving averages.
The script uses different types of moving averages with user-adjustable timeframes and periods/lengths, allowing traders to try out different variations to maximize strategy performance and minimize drawdowns.
By applying these calculations, the strategy effectively identifies bullish trends and avoids market conditions that are not conducive to profitable trades.
The MA filter allows traders to choose whether they want a specific moving average above or below another one as their entry condition.
This comparison filter can be turned on (>/<) or off.
For example, you can set the filter so that MA#1 > MA#2, meaning the first moving average must be above the second one before the script looks for entry conditions. This adds an extra layer of trend confirmation, ensuring that trades are only taken in more favorable market conditions.
MA #1: Fast MA | MA #2: Medium MA | MA #3: Slow MA
⍺: MA Period | Σ: MA Timeframe
-----
What entry modes are used in this strategy? What are the underlying calculations?
The strategy by default uses two different techniques for the entry criteria with user-adjustable left and right bars: Breakout and Fractal.
1. Breakout Entries :
- The strategy looks for pivot high points with a default period of 3.
- It stores the most recent high level in a variable.
- When the price crosses above this most recent level, the strategy checks if all conditions are met and the bar is closed before taking the buy entry.
◧: Pivot high left bars period | ◨: Pivot high right bars period
2. Fractal Entries :
- The strategy looks for pivot low points with a default period of 3.
- When a pivot low is detected, the strategy checks if all conditions are met and the bar is closed before taking the buy entry.
◧: Pivot low left bars period | ◨: Pivot low right bars period
By utilizing these entry modes, the strategy aims to capitalize on bullish price movements while ensuring that the necessary conditions are met to validate the entry points.
-----
What type of stop-loss identification method are used in this strategy? What are the underlying calculations?
Initial Stop-Loss:
1. ATR Based:
The Average True Range (ATR) is a method used in technical analysis to measure volatility. It is not used to indicate the direction of price but to measure volatility, especially volatility caused by price gaps or limit moves.
Calculation:
- To calculate the ATR, the True Range (TR) first needs to be identified. The TR takes into account the most current period high/low range as well as the previous period close.
The True Range is the largest of the following:
- Current Period High minus Current Period Low
- Absolute Value of Current Period High minus Previous Period Close
- Absolute Value of Current Period Low minus Previous Period Close
- The ATR is then calculated as the moving average of the TR over a specified period. (The default period is 14).
Example - ATR (14) * 1.5
⍺: ATR period | Σ: ATR Multiplier
2. ADR Based:
The Average Day Range (ADR) is an indicator that measures the volatility of an asset by showing the average movement of the price between the high and the low over the last several days.
Calculation:
- To calculate the ADR for a particular day:
- Calculate the average of the high prices over a specified number of days.
- Calculate the average of the low prices over the same number of days.
- Find the difference between these average values.
- The default period for calculating the ADR is 14 days. A shorter period may introduce more noise, while a longer period may be slower to react to new market movements.
Example - ADR (14) * 1.5
⍺: ADR period | Σ: ADR Multiplier
Application in Strategy:
- The strategy calculates the current bar's ADR/ATR with a user-defined period.
- It then multiplies the ADR/ATR by a user-defined multiplier to determine the initial stop-loss level.
By using these methods, the strategy dynamically adjusts the initial stop-loss based on market volatility, helping to protect against adverse price movements while allowing for enough room for trades to develop.
Trailing Stop-Loss:
One of the key elements of this strategy is its ability to detec buyside and sellside liquidity levels across multiple timeframes to trail the stop-loss once the trade is in running profits.
By utilizing this approach, the strategy allows enough room for price to run.
There are two built-in trailing stop-loss (SL) options you can choose from while in a trade:
1. External Trailing Stop-Loss:
- Uses sell-side liquidity to trail your stop-loss, allowing price to consolidate before continuation. This method is less aggressive and provides more room for price fluctuations.
Example - External - Wick below the trailing SL - 12H trailing timeframe
⍺: Exit type | Σ: Trailing stop-loss timeframe
2. Internal Trailing Stop-Loss:
- Uses the most recent swing low with a period of 2 to trail your stop-loss. This method is more aggressive compared to the external trailing stop-loss, as it tightens the stop-loss closer to the current price action.
Example - Internal - Close below the trailing SL - 6H trailing timeframe
⍺: Exit type | Σ: Trailing stop-loss timeframe
Each market behaves differently across various timeframes, and it is essential to test different parameters and optimizations to find out which trailing stop-loss method gives you the desired results and performance.
-----
What type of break-even and take profit identification methods are used in this strategy? What are the underlying calculations?
For Break-Even:
- You can choose to set a break-even level at which your initial stop-loss moves to the entry price as soon as it hits, and your trailing stop-loss gets activated (if enabled).
- You can select either a percentage (%) or risk-to-reward (RR) based break-even, allowing you to set your break-even level as a percentage amount above the entry price or based on RR.
For TP1 (Take Profit 1):
- You can choose to set a take profit level at which your position gets fully closed or 50% if the TP2 boolean is enabled.
- Similar to break-even, you can select either a percentage (%) or risk-to-reward (RR) based take profit level, allowing you to set your TP1 level as a percentage amount above the entry price or based on RR.
For TP2 (Take Profit 2):
- You can choose to set a take profit level at which your position gets fully closed.
- As with break-even and TP1, you can select either a percentage (%) or risk-to-reward (RR) based take profit level, allowing you to set your TP2 level as a percentage amount above the entry price or based on RR.
The underlying calculations involve determining the price levels at which these actions are triggered. For break-even, it moves the initial stop-loss to the entry price and activate the trailing stop-loss once the break-even level is reached.
For TP1 and TP2, it's specifying the price levels at which the position is partially or fully closed based on the chosen method (percentage or RR) above the entry price.
These calculations are crucial for managing risk and optimizing profitability in the strategy.
⍺: BE/TP type (%/RR) | Σ: how many RR/% above the current price
-----
What's the ADR filter? What does it do? What are the underlying calculations?
The Average Day Range (ADR) measures the volatility of an asset by showing the average movement of the price between the high and the low over the last several days.
The period of the ADR filter used in this strategy is tied to the same period you've used for your initial stop-loss.
Users can define the minimum ADR they want to be met before the script looks for entry conditions.
ADR Bias Filter:
- Compares the current bar ADR with the ADR (Defined by user):
- If the current ADR is higher, it indicates that volatility has increased compared to ADR (DbU).(⬆)
- If the current ADR is lower, it indicates that volatility has decreased compared to ADR (DbU).(⬇)
Calculations:
1. Calculate ADR:
- Average the high prices over the specified period.
- Average the low prices over the same period.
- Find the difference between these average values in %.
2. Current ADR vs. ADR (DbU):
- Calculate the ADR for the current bar.
- Calculate the ADR (DbU).
- Compare the two values to determine if volatility has increased or decreased.
By using the ADR filter, the strategy ensures that trades are only taken in favorable market conditions where volatility meets the user's defined threshold, thus optimizing entry conditions and potentially improving the overall performance of the strategy.
>: Minimum required ADR for entry | %: Current ADR comparison to ADR of 14 days ago.
-----
What's the probability filter? What are the underlying calculations?
The probability filter is designed to enhance trade entries by using buyside liquidity and probability analysis to filter out unfavorable conditions.
This filter helps in identifying optimal entry points where the likelihood of a profitable trade is higher.
Calculations:
1. Understanding Swing highs and Swing Lows
Swing High: A Swing High is formed when there is a high with 2 lower highs to the left and right.
Swing Low: A Swing Low is formed when there is a low with 2 higher lows to the left and right.
2. Understanding the purpose and the underlying calculations behind Buyside, Sellside and Equilibrium levels.
3. Understanding probability calculations
1. Upon the formation of a new range, the script waits for the price to reach and tap into equilibrium or the 50% level. Status: "⏸" - Inactive
2. Once equilibrium is tapped into, the equilibrium status becomes activated and it waits for either liquidity side to be hit. Status: "▶" - Active
3. If the buyside liquidity is hit, the script adds to the count of successful buyside liquidity occurrences. Similarly, if the sellside is tapped, it records successful sellside liquidity occurrences.
5. Finally, the number of successful occurrences for each side is divided by the overall count individually to calculate the range probabilities.
Note: The calculations are performed independently for each directional range. A range is considered bearish if the previous breakout was through a sellside liquidity. Conversely, a range is considered bullish if the most recent breakout was through a buyside liquidity.
Example - BSL > 50%
-----
What's the sentiment Filter? What are the underlying calculations?
Sentiment filter aims to calculate the percentage level of bullish or bearish fluctuations within equally divided price sections, in the latest price range.
Calculations:
This filter calculates the current sentiment by identifying the highest swing high and the lowest swing low, then evenly dividing the distance between them into percentage amounts. If the price is above the 50% mark, it indicates bullishness, whereas if it's below 50%, it suggests bearishness.
Sentiment Bias Identification:
Bullish Bias: The current price is trading above the 50% daily range.
Bearish Bias: The current price is trading below the 50% daily range.
Example - Sentiment Enabled | Bullish degree above 50% | Bullish sentimental bias
>: Minimum required sentiment for entry | %: Current sentimental degree in a (Bullish/Bearish) sentimental bias
-----
What's the range length Filter? What are the underlying calculations?
The range length filter identifies the price distance between buyside and sellside liquidity levels in percentage terms. When enabled, the script only looks for entries when the minimum range length is met. This helps ensure that trades are taken in markets with sufficient price movement.
Calculations:
Range Length (%) = ( ( Buyside Level − Sellside Level ) / Current Price ) ×100
Range Bias Identification:
Bullish Bias: The current range price has broken above the previous external swing high.
Bearish Bias: The current range price has broken below the previous external swing low.
Example - Range length filter is enabled | Range must be above 5% | Price must be in a bearish range
>: Minimum required range length for entry | %: Current range length percentage in a (Bullish/Bearish) range
-----
What's the day filter Filter, what does it do?
The day filter allows users to customize the session time and choose the specific days they want to include in the strategy session. This helps traders tailor their strategies to particular trading sessions or days of the week when they believe the market conditions are more favorable for their trading style.
Customize Session Time:
Users can define the start and end times for the trading session.
This allows the strategy to only consider trades within the specified time window, focusing on periods of higher market activity or preferred trading hours.
Select Days:
Users can select which days of the week to include in the strategy.
This feature is useful for excluding days with historically lower volatility or unfavorable trading conditions (e.g., Mondays or Fridays).
Benefits:
Focus on Optimal Trading Periods:
By customizing session times and days, traders can focus on periods when the market is more likely to present profitable opportunities.
Avoid Unfavorable Conditions:
Excluding specific days or times can help avoid trading during periods of low liquidity or high unpredictability, such as major news events or holidays.
Increased Flexibility: The filter provides increased flexibility, allowing traders to adapt the strategy to their specific needs and preferences.
Example - Day filter | Session Filter
θ: Session time | Exchange time-zone
-----
What tables are available in this script?
Table Type:
- Summary: Provides a general overview, displaying key performance parameters such as Net Profit, Profit Factor, Max Drawdown, Average Trade, Closed Trades, Compound Annual Growth Rate (CAGR), MAR and more.
CAGR: It calculates the 'Compound Annual Growth Rate' first and last taken trades on your chart. The CAGR is a notional, annualized growth rate that assumes all profits are reinvested. It only takes into account the prices of the two end points — not drawdowns, so it does not calculate risk. It can be used as a yardstick to compare the performance of two strategies. Since it annualizes values, it requires a minimum 4H timeframe to display the CAGR value. annualizing returns over smaller periods of times doesn't produce very meaningful figures.
MAR: Measure of return adjusted for risk: CAGR divided by Max Drawdown. Indicates how comfortable the system might be to trade. Higher than 0.5 is ideal, 1.0 and above is very good, and anything above 3.0 should be considered suspicious and you need to make sure the total number of trades are high enough by running a Deep Backtest in strategy tester. (available for TradingView Premium users.)
Avg Trade: The sum of money gained or lost by the average trade generated by a strategy. Calculated by dividing the Net Profit by the overall number of closed trades. An important value since it must be large enough to cover the commission and slippage costs of trading the strategy and still bring a profit.
MaxDD: Displays the largest drawdown of losses, i.e., the maximum possible loss that the strategy could have incurred among all of the trades it has made. This value is calculated separately for every bar that the strategy spends with an open position.
Profit Factor: The amount of money a trading strategy made for every unit of money it lost (in the selected currency). This value is calculated by dividing gross profits by gross losses.
Avg RR: This is calculated by dividing the average winning trade by the average losing trade. This field is not a very meaningful value by itself because it does not take into account the ratio of the number of winning vs losing trades, and strategies can have different approaches to profitability. A strategy may trade at every possibility in order to capture many small profits, yet have an average losing trade greater than the average winning trade. The higher this value is, the better, but it should be considered together with the percentage of winning trades and the net profit.
Winrate: The percentage of winning trades generated by a strategy. Calculated by dividing the number of winning trades by the total number of closed trades generated by a strategy. Percent profitable is not a very reliable measure by itself. A strategy could have many small winning trades, making the percent profitable high with a small average winning trade, or a few big winning trades accounting for a low percent profitable and a big average winning trade. Most trend-following successful strategies have a percent profitability of 15-40% but are profitable due to risk management control.
BE Trades: Number of break-even trades, excluding commission/slippage.
Losing Trades: The total number of losing trades generated by the strategy.
Winning Trades: The total number of winning trades generated by the strategy.
Total Trades: Total number of taken traders visible your charts.
Net Profit: The overall profit or loss (in the selected currency) achieved by the trading strategy in the test period. The value is the sum of all values from the Profit column (on the List of Trades tab), taking into account the sign.
- Monthly: Displays performance data on a month-by-month basis, allowing users to analyze performance trends over each month.
- Weekly: Displays performance data on a week-by-week basis, helping users to understand weekly performance variations.
- OFF: Hides the performance table.
Labels:
- OFF: Hides labels in the performance table.
- PnL: Shows the profit and loss of each trade individually, providing detailed insights into the performance of each trade.
- Range: Shows the range length and Average Day Range (ADR), offering additional context about market conditions during each trade.
Profit Color:
- Allows users to set the color for representing profit in the performance table, helping to quickly distinguish profitable periods.
Loss Color:
- Allows users to set the color for representing loss in the performance table, helping to quickly identify loss-making periods.
These customizable tables provide traders with flexible and detailed performance analysis, aiding in better strategy evaluation and optimization.
-----
User-input styles and customizations:
To facilitate studying historical data, all conditions and rules can be applied to your charts. By plotting background colors on your charts, you'll be able to identify what worked and what didn't in certain market conditions.
Please note that all background colors in the style are disabled by default to enhance visualization.
-----
How to Use This Algobuilder to Create a Profitable Edge and System:
Choose Your Strategy mode:
- Decide whether you are creating an investing strategy or a trading strategy.
Select a Market:
- Choose a one-sided market such as stocks, indices, or cryptocurrencies.
Historical Data:
- Ensure the historical data covers at least 10 years of price action for robust backtesting.
Timeframe Selection:
- Choose the timeframe you are comfortable trading with. It is strongly recommended to use a timeframe above 15 minutes to minimize the impact of commissions on your profits.
Set Commission and Slippage:
- Properly set the commission and slippage in the strategy properties according to your broker or prop firm specifications.
Parameter Optimization:
- Use trial and error to test different parameters until you find the performance results you are looking for in the summary table or, preferably, through deep backtesting using the strategy tester.
Trade Count:
- Ensure the number of trades is 100 or more; the higher, the better for statistical significance.
Positive Average Trade:
- Make sure the average trade value is above zero.
(An important value since it must be large enough to cover the commission and slippage costs of trading the strategy and still bring a profit.)
Performance Metrics:
- Look for a high profit factor, MAR (Mar Ratio), CAGR (Compound Annual Growth Rate), and net profit with minimum drawdown. Ideally, aim for a drawdown under 20-30%, depending on your risk tolerance.
Refinement and Optimization:
- Try out different markets and timeframes.
- Continue working on refining your edge using the available filters and components to further optimize your strategy.
Automation:
- Once you’re confident in your strategy, you can use the automation section to connect the algorithm to your broker or prop firm.
- Trade a fully automated and backtested trading strategy, allowing for hands-free execution and management.
-----
What makes this strategy original?
1. Incorporating direct integration of probabilities into the strategy.
2. Leveraging market sentiment to construct a profitable approach.
3. Utilizing built-in market structure-based trailing stop-loss mechanisms across various timeframes.
4. Offering both investing and trading strategies, facilitating optimization from different perspectives.
5. Automation for efficient execution.
6. Providing a summary table for instant access to key parameters of the strategy.
-----
How to use automation?
For Traders:
1. Ensure the strategy parameters are properly set based on your optimized parameters.
2. Enter your PineConnector License ID in the designated field.
3. Specify the desired risk level.
4. Provide the Metatrader symbol.
5. Check for chart updates to ensure the automation table appears on the top right corner, displaying your License ID, risk, and symbol.
6. Set up an alert with the strategy selected as Condition and the Message as {{strategy.order.alert_message}}.
7. Activate the Webhook URL in the Notifications section, setting it as the official PineConnector webhook address.
8. Double-check all settings on PineConnector to ensure the connection is successful.
9. Create the alert for entry/exit automation.
For Investors:
1. Ensure the strategy parameters are properly set based on your optimized parameters.
2. Choose "Investing" in the user-input settings.
3. Create an alert with a specified name.
4. Customize the notifications tab to receive alerts via email.
5. Buying/selling alerts will be triggered instantly upon entry or exit order execution.
----
Strategy Properties
This script backtest is done on 4H COINBASE:BTCUSD , using the following backtesting properties:
Balance: $5000
Order Size: 10% of the equity
Risk % per trade: 1%
Commission: 0.04% (Default commission percentage according to TradingView competitions rules)
Slippage: 75 ticks
Pyramiding: 2
-----
Terms and Conditions | Disclaimer
Our charting tools are provided for informational and educational purposes only and should not be construed as financial, investment, or trading advice. They are not intended to forecast market movements or offer specific recommendations. Users should understand that past performance does not guarantee future results and should not base financial decisions solely on historical data.
Built-in components, features, and functionalities of our charting tools are the intellectual property of @Fractalyst Unauthorized use, reproduction, or distribution of these proprietary elements is prohibited.
By continuing to use our charting tools, the user acknowledges and accepts the Terms and Conditions outlined in this legal disclaimer and agrees to respect our intellectual property rights and comply with all applicable laws and regulations.

IsAlgo - Ultra Trend Strategy► Overview:
The Ultra Trend strategy is designed to identify trend lines based on average price movement and execute trades when the price crosses the middle line, confirmed by an entry candle. This strategy combines ATR, Moving Averages, and customizable candlestick patterns to provide a versatile and robust trading approach.
► Description:
The Ultra Trend strategy employs a multi-faceted approach to accurately gauge market trends and execute trades. It combines the Average True Range (ATR) with trendline analysis and Moving Averages, providing a comprehensive view of market conditions. The strategy uses ATR to measure market volatility and the average price movement, helping to set dynamic thresholds for trend detection and adapting to changing market conditions. The slope of the trend is calculated based on the angle of price movement, which aids in identifying the strength and direction of the trend.
Additionally, a Moving Average is used to filter trades, ensuring alignment with the broader market direction and reducing false signals, thereby enhancing trade accuracy.
Traders can configure the strategy to enter trades in the direction of the trend, against the trend, or both. This feature enhances the adaptability of the Ultra Trend strategy, making it suitable for various trading styles and market environments.
↑ Long Entry:
A long trade is executed when the entry candle crosses and closes above the trend line. This indicates a bullish market condition, signaling an opportunity to enter a buy position.
↓ Short Entry:
A short trade is executed when the entry candle crosses and closes below the trend line. This indicates a bearish market condition, signaling an opportunity to enter a sell position.
✕ Exit Conditions:
The strategy offers multiple stop-loss options to manage risk effectively. Traders can set stop-loss levels using fixed pips, ATR-based calculations, the higher/lower price of past candles, or close a trade if a candle moves against the trade direction.
Up to three take profit levels can be set using methods such as fixed pips, ATR, and risk-to-reward ratios. This allows traders to secure profits at various stages of the trade.
A trailing stop feature adjusts the stop loss as the trade moves into profit, locking in gains while allowing the trade to continue capturing potential upside. Additionally, a break-even feature moves the stop loss to the entry price once a certain profit level is reached, protecting against losses.
Trades can also be closed when a trend change is detected or when a candle closes outside a predefined channel, ensuring that positions are exited promptly in response to changing market conditions.
► Features and Settings:
⚙︎ Trend: Users can configure the trend direction, length, factor, and slope, allowing for precise control over how trends are identified and followed.
⚙︎ Moving Average: An Exponential Moving Average (EMA) can be employed to confirm the trend direction indicated by the trend lines. This provides further assurance that the trend line breakout is not a false signal. The EMA can be enabled or disabled based on user preference.
⚙︎ Entry Candle: The entry candle is the candle that breaks the trend line, signaling an entry opportunity. Users can specify the minimum and maximum size of the candle's body and the ratio of the body to the entire candle size. This ensures that only significant breakouts trigger trades.
⚙︎ Trading Session: This feature allows users to define specific trading hours during which the strategy should operate, ensuring trades are executed only during preferred market periods.
⚙︎ Trading Days: Users can specify which days the strategy should be active, offering the flexibility to avoid trading on specific days of the week.
⚙︎ Backtesting: Enables a backtesting period during which the strategy can be tested over a selected start and end date. This feature can be deactivated if not needed.
⚙︎ Trades: This includes configuring the direction of trades (long, short, or both), position sizing (fixed or percentage-based), the maximum number of open trades, and limitations on the number of trades per day or based on trend.
⚙︎ Trades Exit: The strategy offers various exit methods, such as setting profit or loss limits, specifying the duration a trade should remain open, or closing trades based on trend reversal.
⚙︎ Stop Loss: Various stop-loss methods are available, including a fixed number of pips, ATR-based, or using the highest or lowest price points within a specified number of previous candles. Additionally, trades can be closed after a specific number of candles move in the opposite direction of the trade.
⚙︎ Break Even: This feature adjusts the stop loss to a break-even point once certain conditions are met, such as reaching predefined profit levels, to protect gains.
⚙︎ Trailing Stop: The trailing stop feature adjusts the stop loss as the trade moves into profit, securing gains while potentially capturing further upside.
⚙︎ Take Profit: Up to three take-profit levels can be set using various methods, such as a fixed amount of pips, ATR, or risk-to-reward ratios based on the stop loss. Alternatively, users can specify a set number of candles moving in the direction of the trade.
⚙︎ Alerts: The strategy includes a comprehensive alert system that informs the user of all significant actions, such as trade openings and closings. It supports placeholders for dynamic values like take-profit levels and stop-loss prices.
⚙︎ Dashboard: A visual display provides detailed information about ongoing and past trades on the chart, helping users monitor the strategy's performance and make informed decisions.
► Backtesting Details:
Timeframe: 5-minute US30 chart
Initial Balance: $10,000
Order Size: 4% of equity per trade
Commission: $0.05 per contract
Slippage: 5 ticks
Stop Loss: ATR-based

Ultimate Trading StrategyDescription:
In this TradingView Pine Script publication, we introduce a powerful tool designed to enhance your trading strategies by combining the Exponential Moving Average (EMA) and the Relative Strength Index (RSI). This strategy is specifically tailored for the EGLD/USDT.P pair on Binance, using a 5-minute interval to capture timely trading opportunities in a volatile market.
Key Features:
Combining EMA and RSI for Robust Signals
This script combines the EMA, which helps identify the overall trend direction, with the RSI, which measures the speed and change of price movements to identify overbought and oversold conditions.
The combination ensures that you get high-probability signals by leveraging both trend-following and momentum-based indicators.
Multiple Timeframe Analysis
Analyze the EMA and RSI across different timeframes to gain a comprehensive view of market conditions and make more informed trading decisions.
Reversing and Extending Signals
Reverse signals generated by indicators to adapt to various market conditions.
Extend signals by specifying conditions such as "RSI cross AND EMA cross WITHIN 2 bars" to capture more nuanced trading opportunities.
Backtesting and Risk Management
Evaluate the performance of your strategies by feeding the results into a backtesting engine.
The strategy risks a maximum of 10% of the account on a single trade to maintain sustainable risk levels.
Available Indicators:
EMA (Exponential Moving Average)
Helps identify the overall trend direction.
Signals:
Long Entry: When the price closes above the EMA.
Short Entry: When the price closes below the EMA.
RSI (Relative Strength Index)
Measures the speed and change of price movements.
Signals:
Long Entry: When RSI is below the oversold level (30).
Short Entry: When RSI is above the overbought level (70).
How It Works:
Long Entry: A buy signal is generated when the price closes above the EMA and the RSI is below the oversold level (30). This indicates that the price is in an upward trend and temporarily oversold, presenting a potential buying opportunity.
Short Entry: A sell signal is generated when the price closes below the EMA and the RSI is above the overbought level (70). This indicates that the price is in a downward trend and temporarily overbought, presenting a potential selling opportunity.
Close Long Position: The script closes long positions when the conditions for a short entry are met.
Close Short Position: The script closes short positions when the conditions for a long entry are met.
Parameters:
EMA Length: 20 (default)
RSI Length: 14 (default)
RSI Overbought Level: 70 (default)
RSI Oversold Level: 30 (default)
Initial Capital: 10,000 USDT (default) – Realistic starting capital for an average trader.
Commission: 0.1% (default) – Reflects typical trading commissions.
Slippage: 0.5 ticks (default) – Accounts for market conditions and potential price slippage during order execution.
Backtesting:
Trading Range: – Ensure that the dataset used covers a significant period to generate a sufficient number of trades.
Dataset Limitation: Due to TradingView Premium's limitation of backtesting only 20,000 candles, it may not be possible to generate more than 100 trades. This limitation affects the statistical relevance of the backtesting results, but the strategy has been tested to provide meaningful insights within these constraints.
Use Case:
This strategy combines the EMA and RSI to identify potential trading opportunities by detecting trend direction and overbought/oversold conditions. It is particularly effective in volatile markets where quick trend reversals are common.
How to Use:
Set the parameters according to your preference or use the default values.
Run the script on the EGLD/USDT.P pair with a 5-minute interval.
Monitor the signals and adjust your trades accordingly.

Entry Fragger - Strategy
For basic instructions please visit my other script "Entry Fragger".
The Signal Logic is explained there.
v1.4:
- Added advanced backtesting with fully customizable entries.
- Fully automated Buy Signals (profitable).
- Adjustable timeframes for signal logic. (requested)
Every setting affects the accuracy and profitability greatly now, based on settings applied.
The strategy performs best on high timeframes with larger capital and no leverage.
Useless for Forex, but absolutely smashes stocks and crypto on mid to high timeframes.
Please read through my other scripts description.
Set values as preferred and try your assets.
It does NOT work on low timeframes and forex!
Hint: BTC 4H, Custom Timeframe 1h, Moon Mode and Show Sell Signals enabled, R2R: 2.

Kaufman Adaptive Moving Average (KAMA) Strategy [TradeDots]"The Kaufman Adaptive Moving Average (KAMA) Strategy" is a trend-following system that leverages the adaptive qualities of the Kaufman Adaptive Moving Average (KAMA). This strategy is distinguished by its ability to adjust dynamically to market volatility, enhancing trading accuracy by minimizing the effects of false and delayed signals often associated with the Simple Moving Average (SMA).
HOW IT WORKS
This strategy is centered around use of the Kaufman Adaptive Moving Average (KAMA) indicator, which refines the principles of the Exponential Moving Average (EMA) with a superior smoothing technique.
KAMA distinguishes itself by its responsiveness to changes in market prices through an "Efficiency Ratio (ER)." This ratio is computed by dividing the recent absolute net price change by the cumulative sum of the absolute price changes over a specified period. The resulting ER value ranges between 0 and 1, where 0 indicates high market noise and 1 reflects stronger market momentum.
Using ER, we could get the smoothing constant (SC) for the moving average derived using the following formula:
fastest = 2/(fastma_length + 1)
slowest = 2/(slowma_length + 1)
SC = math.pow((ER * (fastest-slowest) + slowest), 2)
The KAMA line is then calculated by applying the SC to the difference between the current price and the previous KAMA.
APPLICATION
For entering long positions, this strategy initializes when there is a sequence of 10 consecutive rising KAMA lines. Conversely, a sequence of 10 consecutive falling KAMA lines triggers sell orders for long positions. The same logic applies inversely for short positions.
DEFAULT SETUP
Commission: 0.01%
Initial Capital: $10,000
Equity per Trade: 80%
Users are advised to adjust and personalize this trading strategy to better match their individual trading preferences and style.
RISK DISCLAIMER
Trading entails substantial risk, and most day traders incur losses. All content, tools, scripts, articles, and education provided by TradeDots serve purely informational and educational purposes. Past performances are not definitive predictors of future results.

Golden Cross VWMA & EMA 4h PinescriptlabsThis strategy combines the 50-period Volume-Weighted Moving Average (VWMA) on the current timeframe with a 200-period Simple Moving Average (SMA) on the 4-hour timeframe. This combination of indicators with different characteristics and time horizons aims to identify strong and sustained trends across multiple timeframes.
The VWMA is a variant of the moving average that assigns greater weight to periods of higher volatility, helping to avoid misleading signals. On the other hand, the 4-hour SMA is used as an additional trend filter in a shorter-term horizon. By combining these two indicators, the strategy can leverage the strength of the VWMA to capture the main trend, but only when confirmed by the SMA in the lower timeframe.
Buy signals are generated when the VWMA crosses above the 4-hour SMA, indicating a potential bullish trend aligned in both timeframes. Sell signals occur on a bearish cross, suggesting a possible reversal of the main trend.
The default parameters are a 50-period VWMA and a 200-period 4-hour SMA. It is recommended to adjust these lengths according to the traded instrument and the desired timeframe. It is also crucial to use stop losses and profit targets to properly manage risk.
By combining indicators of different types and timeframes, this strategy aims to provide a more comprehensive view of trend strength.
Español:
Esta estrategia combina la Volume-Weighted Moving Average (VWMA) de 50 períodos en el timeframe actual con una Simple Moving Average (SMA) de 200 períodos en el timeframe de 4 horas. Esta combinación de indicadores de distinta naturaleza y horizontes temporales busca identificar tendencias fuertes y sostenidas en múltiples timeframes.
La VWMA es una variante de la media móvil que asigna mayor ponderación a los períodos de mayor volatilidad, lo que ayuda a evitar señales engañosas. Por otro lado, la SMA de 4 horas se utiliza como un filtro adicional de tendencia en un horizonte de corto plazo. Al combinar estos dos indicadores, la estrategia puede aprovechar la fortaleza de la VWMA para capturar la tendencia principal, pero sólo cuando es confirmada por la SMA en el timeframe menor.
Las señales de compra se generan cuando la VWMA cruza al alza la SMA de 4 horas, indicando una potencial tendencia alcista alineada en ambos horizontes temporales. Las señales de venta ocurren en el cruce bajista, sugiriendo una posible reversión de la tendencia principal.
Los parámetros predeterminados son: VWMA de 50 períodos y SMA de 4 horas de 200 períodos. Se recomienda ajustar estas longitudes según el instrumento operado y el horizonte temporal deseado. También es crucial utilizar stops y objetivos de ganancias para controlar adecuadamente el riesgo.
Al combinar indicadores de diferentes tipos y timeframes, esta estrategia busca brindar una visión más completa de la fuerza de la tendencia.
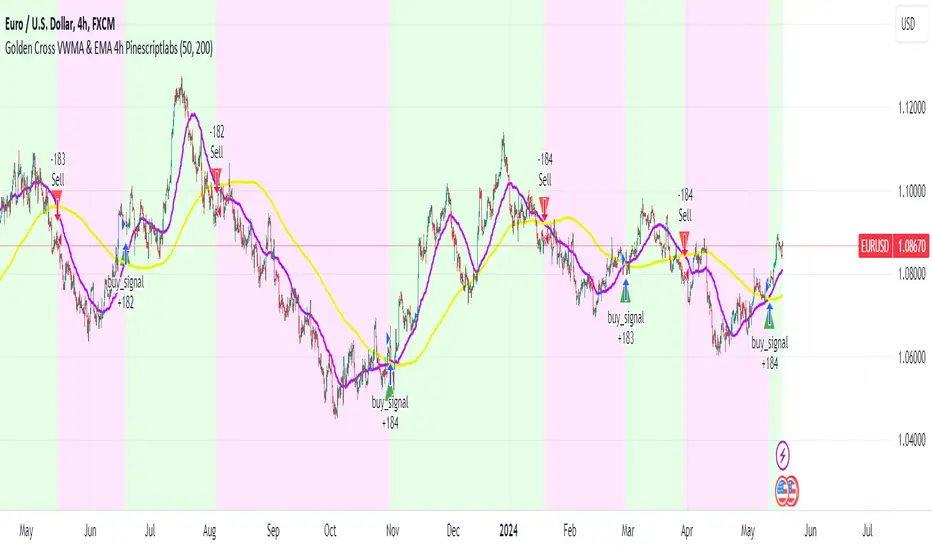
Trend Following Parabolic Buy Sell Strategy [TradeDots]The Trend Following Parabolic Buy-Sell Strategy leverages the Parabolic SAR in combination with moving average crossovers to deliver buy and sell signals within a trend-following framework.
This strategy synthesizes proven methodologies sourced from various trading tutorials available on platforms such as YouTube and blogs, enabling traders to conduct robust backtesting on their selected trading pairs to assess the strategy's effectiveness.
HOW IT WORKS
This strategy employs four key indicators to orchestrate its trading signals:
1. Trend Alignment: It first assesses the relationship between the price and the predominant trendline to determine the directional stance—taking long positions only when the price trends above the moving average, signaling an upward market trajectory.
2. Momentum Confirmation: Subsequent to trend alignment, the strategy looks for moving average crossovers as a confirmation that the price is gaining momentum in the direction of the intended trades.
3. Signal Finalization: Finally, buy or sell signals are validated using the Parabolic SAR indicator. A long order is validated when the closing price is above the Parabolic SAR dots, and similarly, conditions are reversed for short orders.
4. Risk Management: The strategy institutes a fixed stop-loss at the moving average trendline and a take-profit level determinable by a prefixed risk-reward ratio calculated from the moving average trendline. These parameters are customizable by the users within the strategy settings.
APPLICATION
Designed for assets exhibiting pronounced directional momentum, this strategy aims to capitalize on clear trend movements conducive to achieving set take-profit targets.
As a lagging strategy that waits for multiple confirmatory signals, entry into trades might occasionally lag beyond optimal timing.
Furthermore, in periods of consolidation or sideways movement, the strategy may generate several false signals, suggesting the potential need for additional market condition filters to enhance signal accuracy during volatile phases.
DEFAULT SETUP
Commission: 0.01%
Initial Capital: $10,000
Equity per Trade: 70%
Users are advised to adjust and personalize this trading strategy to better match their individual trading preferences and style.
RISK DISCLAIMER
Trading entails substantial risk, and most day traders incur losses. All content, tools, scripts, articles, and education provided by TradeDots serve purely informational and educational purposes. Past performances are not definitive predictors of future results.

IsAlgo - AI Trend Strategy► Overview:
The AI Trend Strategy employs a combination of technical indicators to guide trading decisions across various markets and timeframes. It uses a custom Super Trend indicator and an Exponential Moving Average (EMA) to analyze market trends and executes trades based on specific candlestick patterns. This strategy includes options for setting stop losses, take profit levels, and features an alert system for trade notifications.
► Description:
This strategy focuses on identifying the optimal "entry candle," which signals either a potential correction within the ongoing trend or the emergence of a new trend. The entry criteria for this candle are highly customizable, allowing traders to specify dimensions such as the candle's minimum and maximum size and body ratio. Additional settings include whether this candle should be the highest or lowest compared to recent candles and if a confirmation candle is necessary to validate the entry.
The Super Trend indicator is central to the strategy’s operation, dictating the direction of trades by identifying bullish or bearish trends. Traders have the option to configure trades to align with the direction of the trend identified by this indicator, or alternatively, to take positions counter to the trend for potential reversal strategies. This flexibility can be crucial during varying market conditions.
Additionally, the strategy incorporates an EMA alongside the Super Trend indicator to further analyze trend directions. This combined approach aims to reduce the occurrence of false signals and improve the strategy's overall trend analysis.
The learning algorithm is a standout feature of the AI Trend Strategy. After accumulating data from a predefined number of trades (e.g., after the first 100 trades), the algorithm begins to analyze past performances to identify patterns in wins and losses. It considers variables such as the distance from the current price to the trend line, the range between the highest and lowest prices during the trend, and the duration of the trend. This data informs the algorithm's predictions for future trades, aiming to improve accuracy and reduce losses by adapting to the evolving market conditions.
► Examples of Trade Execution:
1. In an Uptrend: The strategy might detect a suitable entry candle during a correction phase, which aligns with the continuing uptrend for a potential long trade.
2. In a Downtrend: Alternatively, the strategy might identify an entry candle at the end of a downtrend, suggesting a potential reversal or correction where a long trade could be initiated.
3. In an Uptrend: The strategy may also spot an entry candle at the end of an uptrend and execute a short trade, anticipating a reversal or significant pullback.
4. In a Downtrend: The strategy might find a suitable entry candle during a correction phase, indicating a continuation of the downtrend for a potential short trade.
These examples illustrate how the strategy identifies potential trading opportunities based on trend behavior and candlestick patterns.
► Features and Settings:
⚙︎ Trend: Utilizes a custom Super Trend indicator to identify the direction of the market trend. Users can configure the strategy to execute trades in alignment with this trend, take positions contrary to the trend, or completely ignore the trend information for their trading decisions.
⚙︎ Moving average: Employs an Exponential Moving Average (EMA) to further confirm the trend direction indicated by the Super Trend indicator. This setting can be used in conjunction with the Super Trend or disabled if preferred.
⚙︎ Entry candle: Defines the criteria for the candle that triggers a trade. Users can customize aspects such as the candle's size, body, and its relative position to previous candles to ensure it meets specific trading requirements before initiating a trade.
⚙︎ Learning algorithm: This component uses historical trade data to refine the strategy. It assesses various aspects of past trades, such as price trends and market conditions, to make more informed trading decisions in the future.
⚙︎ Trading session: Users can define specific trading hours during which the strategy should operate, allowing trades to be executed only during preferred market periods.
⚙︎ Trading days: This option enables users to specify which days the strategy should be active, providing the flexibility to avoid trading on certain days of the week if desired.
⚙︎ Backtesting: Enables a period during which the strategy can be tested over a selected start and end date, with an option to deactivate this feature if not needed.
⚙︎ Trades: Detailed configuration options include the direction of trades (long, short, or both), position sizing (fixed or percentage-based), the maximum number of open trades, and limitations on the number of trades per day or based on trend changes.
⚙︎ Trades Exit: Offers various strategies for exiting trades, such as setting limits on profits or losses, specifying the duration a trade should remain open, or closing trades based on trend reversal signals.
⚙︎ Stop loss: Various methods for setting stop losses are available, including fixed pips, based on Average True Range (ATR), or utilizing the highest or lowest price points within a designated number of previous candles. Another option allows for closing the trade after a specific number of candles moving in the opposite direction.
⚙︎ Break even: This feature adjusts the stop loss to a break-even point under certain conditions, such as reaching predefined profit levels, to protect gains.
⚙︎ Trailing stop: The trailing stop feature adjusts the stop loss as the trade moves into profit, aiming to secure gains while potentially capturing further upside.
⚙︎ Take profit: Up to three take profit levels can be established using various methods, such as a fixed amount of pips, risk-to-reward ratios based on the stop loss, ATR, or after a set number of candles that move in the direction of the trade.
⚙︎ Alerts: Includes a comprehensive alert system that informs the user of all significant actions taken by the strategy, such as trade openings and closings. It supports placeholders for dynamic values like take profit levels, stop loss prices, and more.
⚙︎ Dashboard: Provides a visual display of detailed information about ongoing and past trades on the chart, helping users monitor the strategy’s performance and make informed decisions.
► Backtesting Details:
Timeframe: 15-minute BTCUSD chart.
Initial Balance: $10,000.
Order Size: 4% of equity per trade.
Commission: 0.01%.
Slippage: 5 ticks.
Risk Management: Strategic stop loss settings are applied based on the most extreme price points within the last 18 candles.

Moving average strategyNAME : Moving average strategy
SUMMARY
Long when Short MA period > Long MA period
Exit when Short MA period < Long MA period
Long only strategy, but you can modify this script.
==============================
This strategy uses a moving average line.
It buys when the short-term moving average crosses the long-term moving average and sells when the long-term moving average crosses the short-term moving average.
You can use different moving average lines by setting the MA type.
You can use SMA, EMA, DEMA, TEMA, WMA, and VWMA.
You can also adjust the period of the moving average line.
Price Type sets the type of price that will be used for the moving average line. The options are Close price, Open price, High price, Low price, Typical price, and center price.
High MDD and long periods of sideways movement make it difficult to use in practice, even though the returns may seem high.
Hopefully, you can combine it with other indicators to create a good strategy.
Thank you.
