ชาร์ตรายเดือน

Weekly Monthly Yearly Open LevelsThis script displays the weekly, monthly, and yearly opens for the last few periods.
I added an option to extend the previous opens to the current period as well.

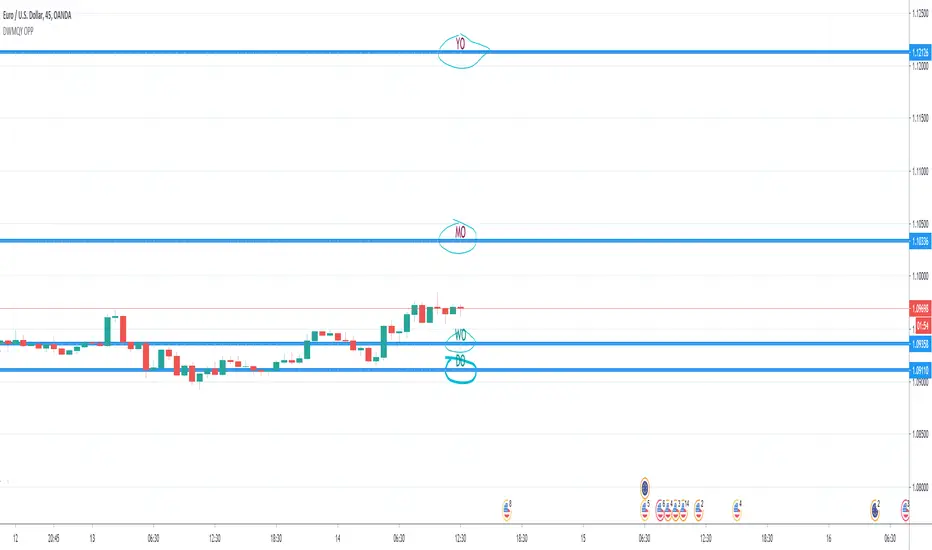
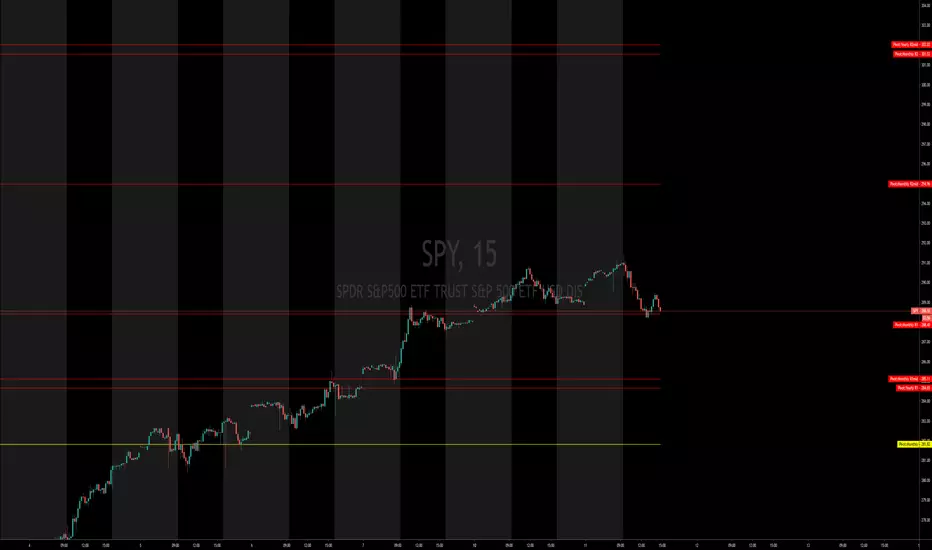
Day & Week & Month & Quarter & Year Open Price PointsPresent to your attention, basic “Day & Week & Month & Quarter & Year Open Price Points Indicator” !
You can determine support & resistance using Yearly, Quarterly, Monthly and Weekly open price points on a chart with any timeframe.
It is not a widely used technique, but according to different academic studies, levels are reliable. Google it! You can enhance your trading by adding that technique in your tool list.
At the current stage, Indicator shows Open Price Points.
Opening price points are extended into the future from the opening candle of each year, quarter, month and week and day.
By nature of that points, every level may be used as a support and as a resistance level at a similar time.
Initial setup:
1) Open the indicator Inputs settings, enable/disable additional Price Points.
2) Open the indicator Style settings, click on a style of each line and click on a “Price Line.”
How to use that?
With a lot of available strategies, there are two leading: Level convergence and Trend line convergence.
1) Level convergence involves locating two or more opening points that merge. This confluence can lead to greater accuracy and profitability.
2) Trend line convergence - The intersection of a trend line at a weekly, monthly, quarterly or even yearly opening level can produce fast and profitable reactions.
Try that!
As a stand-alone strategy, you can utilize that:
Price action under the WO (DO, MO, QO, YO) – Bearish
Price action above the WO (DO, MO, QO, YO) – Bullish
TIP: opening level not always good as a stand-alone tool!
Indicator Settings:
Show Daily Open (disabled by default)
Show Weekly Open (ON by default)
Show Monthly Open (ON by default)
Show Quarter Open (disabled by default)
Show Yearly Open (disabled by default)
Indicator Styling:
By default, each line is shown in the form of circles, line-width 1, silver colour.
Labels can be only in one of two states: Maroon (if open price less than ((open + high + low + close)/4) or Teal (if open price high than ((open + high + low + close)/4).
Alerts:
With the Indicator you can add a few different alerts:
DO Alert
WO Alert
MO Alert
QO Alert
YO Alert
Play with it:
Add a new alert with following condition: your SYMBOL crossing DWMQY OPP Weekly Open.
Options: Once per Bar.
Future of the Indicator:
The Indicator is a necessary part of more prominent Indicator which will include 8 modules in total:
2~ Arabian Wise Tunnels Module
3~ RH Waves Module (something like Vegas Waves)
4~ Trend Channels Module
5~ Opening Range Zoning Module
6~ Breakout Module
7~ BS Hemisphere Module
8~ Price Action Module
DISCLAIMER! RISK WARNING!
PAST PERFORMANCE IS NOT NECESSARILY INDICATIVE OF FUTURE RESULTS. TRADERS SHOULD NOT BASE THEIR DECISION ON INVESTING IN ANY TRADING PROGRAM SOLELY ON THE PAST PERFORMANCE PRESENTED, ADDITIONALLY, IN MAKING AN INVESTMENT DECISION, TRADERS MUST ALSO RELY ON THEIR OWN EXAMINATION OF THE PERSON OR ENTITY MAKING THE TRADING DECISIONS.
//Written by iambitboy request.
D/W/M/Y OpenThis is just a small Script
It show you:
Low and high of
Yesterday, last week, last month and last year
+
Open today

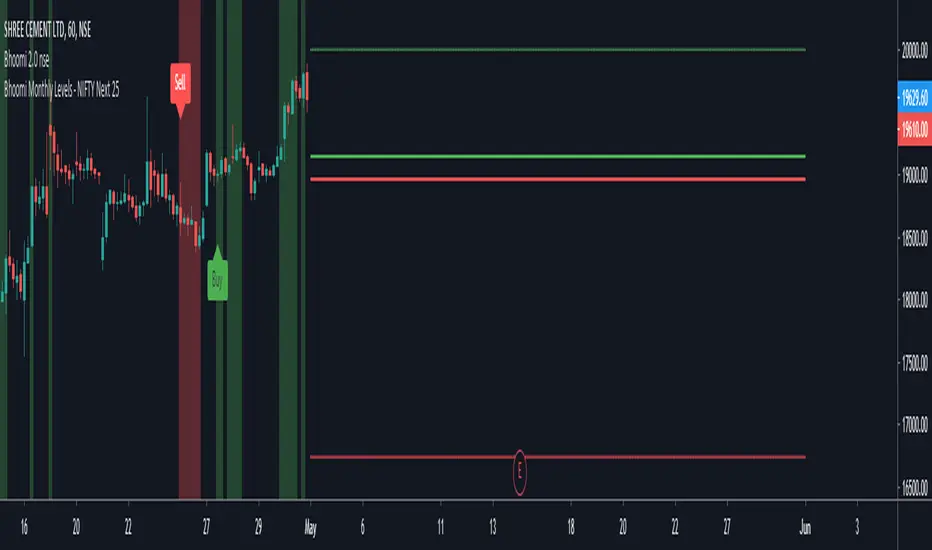
Bhoomi Monthly Levels - NIFTY Next 25This is a custom indicator which assists with monthly levels of Next25 stocks of NIFTY 50.
Bhoomi Monthly Levels - NIFTY 25This is a custom indicator which assists with monthly levels of first 25 stocks of NIFTY 50.

Yearly Weekly Monthly Monday Levels This script displays the Open, High, Low and Mid ranges for Yearly levels, Monthly levels, Weekly levels, and Monday range levels (useful support and resistance levels)
Opens are displayed in dashed lines, and mid-levels in dotted lines. Other lines (highs and lows) are in plain lines.
Each color represent a time horizon:
- Red: Yearly levels
- White: Monthly levels
- Yellow: Weekly levels
Colors are changeable (even though color inputs are not still available in Version 4 of TradingView PineScript).

Levels Compound v.2Daily, weekly, monthly support and resistance levels. Also paints 2 different daily WMAs and the daily weekly monthly avg.

Oasis Group - VWAP / OHLC (Daily / Weekly / Monthly)
5min with the Daily overlay
4hour with the Weekly overly
This Script was influenced be Chris Moody's OHLC Script.
I have created my version of the script and used it to Overlay Daily/Weekly/Monthly Candles over any chosen Intraday Time Frame.
**Important**
The "Stepline" Line style function in pine script is defective so anyone who wants to use this must change all line
styles to "Stepline" manually except for the VWAP Line.
This gives traders a great overall candle experience and also insight into the noise of the intraday.
Intraday traders can keep watch of the highs and Lows along with open and close levels for the larger time frames chosen.
Give us a Follow and Like. This can be used on any Asset class.
I personally use this on Intraday Trading.
Helps me Identify the Prior day Highs and Lows, Closing price compared to the next mornings Opening Price, and daily, weekly, or monthly ranges.
Also included is the powerful VWAP indicator for identifying bullish or bearish pysche.


Candle Range - Monthly - Open/High/Low/Close/Wicks (Oldinvestor)This candle range comparison is similar to my original script Candle Range Compare .
This script is to compares the size of open/close high/low and wick size side by side. This version of the script allows you to only show a chosen month of each year to compare. I hadn't even thought to try and vanish the part of the chart I'm not looking at. I'll consider that later (may never happen, I am limited on time).
I have also included check boxes to turn on/off certain candles. This part is pretty self explanatory. For example: if you wish to not see wicks in front of the open/close, go to the settings for the study and uncheck the box for "Show Wicks".
Warning: The script does not work so well on monthly candles? Some of the candles are missing...
Good luck
Oldinvestor
RVC-Weekly-Pivots-GANN-LevelsPurpose:
Weekly - Fibonacci pivot levels and Gann levels calculation and marking on Chart automatically.
Mainly expected to use for trading on NIFTY and BankNifty
Kindly share your comments and suggestions to improve

Yearly Weekly Monthly Monday LevelsThis script displays the Open, High, Low and Mid ranges for Yearly levels, Monthly levels, Weekly levels, and Monday range levels (useful support and resistance levels)
Opens are displayed in dashed lines, and mid-levels in dotted lines. Other lines (highs and lows) are in plain lines.
Colors are selectable (even though color inputs are not still available in Version 4 of TradingView PineScript).
Let me know your username in the comment below if you want to have access.
InfoPanel - SeasonalityThis panel will show which is the best month to buy a stock, index or ETF or even a cryptocurrency in the past 5 years.
Script to use only with MONTHLY timeframe.
Thanks to: RicardoSantos for his hard work.
Please use comment section for any feedback.

X0_Trading_levelsScript which marks out the trading ranges I often like to have mapped out on the charts:
Mondays Trading range - open, high, low
Daily open, high, low
Weekly open
Monthly open.
Can change all colours

Pivot Points Monthly & YearlyMonthly and Yearly only
What is a Pivot Point?
A pivot point is a technical analysis indicator, or calculations, used to determine the overall trend of the market over different time frames. The pivot point itself is simply the average of the high, low and closing prices from the previous trading day. On the subsequent day, trading above the pivot point is thought to indicate ongoing bullish sentiment, while trading below the pivot point indicates bearish sentiment.
The pivot point is the basis for the indicator, but it also includes other support and resistance levels that are projected based on the pivot point calculation. All these levels help traders see where the price could experience support or resistance. Similarly, if the price moves through these levels it lets the trader know the price is trending in that direction.
When the price of an asset is trading above the pivot point, it indicates the day is bullish or positive.
When the price of an asset is trading below the pivot point, it indicates the day is bearish or negative.
The indicator typically includes four additional levels: S1, S2, R1, and R2. These stand for support one and two, and resistance one and two.
Support and resistance one and two may cause reversals, but they may also be used to confirm the trend. For example, if the price is falling and moves below S1, it helps confirm the downtrend and indicate a possible continuation to S2.
This Script includes the Mid Pivot Points, Open and Close levels
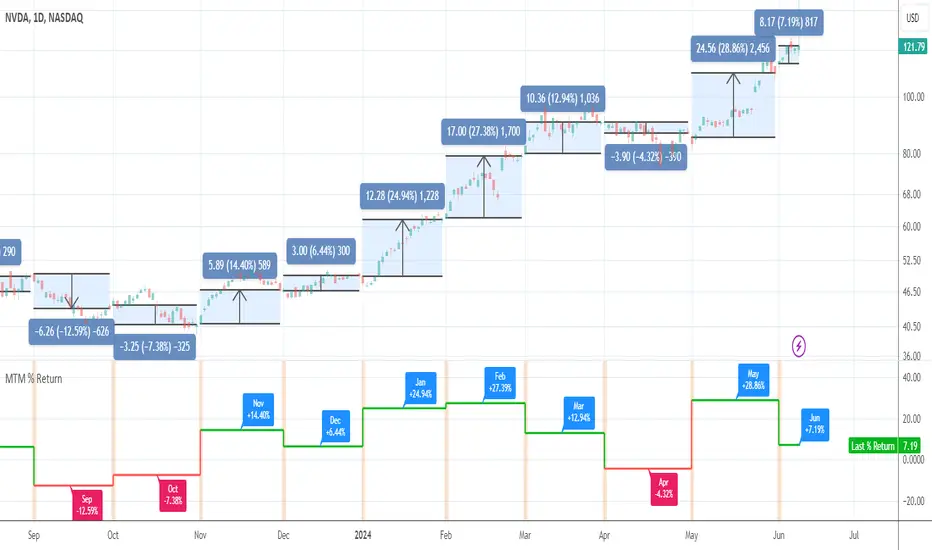
Month-to-Month % ReturnAn utility tool to see month-to-month performance of the asset and to eliminate the need in drawings. It works everywhere but better in use on the daily timeframe.
Monthly & Weekly LevelsShows and labels the previous monthly and weekly highs and lows, which are generally great areas to trade off. Loads quick and there's an option to hide the labels if they don't float your boat
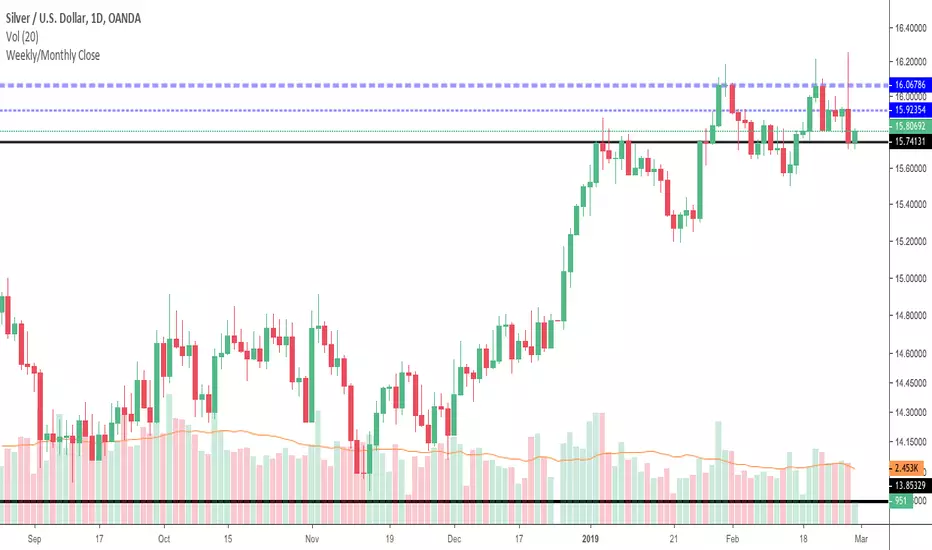
Weekly/Monthly CloseJust a simple support/resistance indicator that display weekly/monthly close price and it is configurable to work in two modes:
tracking mode - to display last week/month's close
history mode - to display weekly/monthly close prices
See how last month's close (ticker blue line) provides nice resistance and the price forms a double top then it consolidates under last week's close line (thiner blue line).
It also works on intraday charts and displays history close prices, see below how last month's close (ticker blue line) provides support over and over and also how price bounces off weekly close history prices (thiner blue line).
Weekly OHLC Plus 3 Weekly TF EMAsPlots weekly OHLC (with option to turn on monthly Open and Close) and 3 Weekly resolution EMAs (customizable).
This indicator is a combination of a few I've created/updated here on TV.
First part plots Weekly OHLC with an option to plot monthly open and close.
This indicator also plots on your chart 3 EMAs (customizable) from the Weekly timeframe (resolution).
The default settings (all EMAs)
200 - Orange
50 - Purple
20 - Black
There is no smoothing so the EMA line will appear jagged.

Monthly OHLCThis indicator displays the monthly Open, High, Low and Close price on a chart.
Very helpful indicator for starting your trading week (I use it every week in FOREX, Crypto, and Equities).
In conjunction using this on the Weekly & Daily timerfame with a 200, 10 and 5 EMA you can start your week off with a probable bull or bear bias.
Custom Timeframe Indicators(MA,EMA,BB) [CryptoProSignal]This is a combination of 3 types of indicators :
1) Simple Moving Average
2) Exponential Moving Average
3) Bollinger Band
Idea is to plot any of the above indicator with a particular period length from a different timeframe to the timeframe on which you are currently working.
eg : As shown in the chart we have indicator plots from daily timeframe plotted/shown on the current 4hr time frame .
Similarly, you can have indicator plots from 4hr timeframe to be shown on any other timeframe and so on.
Basically you can select plots from any timeframe to work with on any other timeframe of your liking .
Not a rocket science, just play around with it and you will understand :)
