ChannelMomentumBreakerChannelMomentumBreaker
This indicator is based on an original idea which is derived from Dow Theory: "Asset prices incorporate all available information". The driving influence behind this indicator is to consider only Meaningful changes in behaviour in a time independent system.
The way it works is simple and as follows:
The indicator decides on a singular price point called the Pivot Price which will be used as a baseline/calibration point
It then generates its own OHLC candles based on a 1-1 mapping from the real time candles to the "virtual" candles
The ratio between the top tails and bottom tails of these virtual candles will determine if there is a meaningful change in behaviour
The result is reflected in the histogram for conveniency.
The indicator can be considered as time-frame agnostic but works most optimally when derived from smaller time-frames (e.g. its detection of meaningful changes will be better when used in a 1-minute candle time-frame as opposed to a 3-minute time-frame).
Colour scheme:
------------------
The virtual candles follow a two-colour convention:
Gray - Considered a safe zone for entry
Red - Considered less safe
These virtual candles must be analysed in conjunction with the histogram.
Histogram colour scheme:
Red - Signifies less than mid-level change in behaviour
Yellow - Signifies change in behaviour that is not strong enough or too late with respect to when the "up" trend began
Gray - Signifies no meaningful change in behaviour has occurred for a long time
Lime - Signifies meaningful change in behaviour has occurred recently
White - Signifies a meaningful change in behaviour has occurred recently and quickly
Blue - Signifies risky change in behaviour
Teal - Signifies a virtual bar open is greater than the previous virtual bar
In general, the upper half of the histogram is considered as a preferred zone for long entry and vice versa for the bottom half.
Crossover background colour scheme:
Red - Transition from positive behaviour -> negative behaviour (This is triggered when consecutive bars are crossing a certain low threshold )
Green - Transition from negative behaviour -> positive behaviour (This is triggered when consecutive bars are crossing a certain high threshold )
Input parameters:
Fast Acceleration Length and Slow Acceleration Length are used to control the sensitivity of the crossover mechanism on the histogram.
How to use:
The picture depicts the virtual (gray/red) candles and histogram.
The Blue rectangle shows the virtual bars and a full transition from negative behaviour to positive behaviour.
The Red rectangle shows when meaningful negative behaviour is occurring, where it may be suitable to begin preparing for an upwards trend (reversal of behaviour).
The Green rectangle shows when meaningful positive behaviour has occurred, and you can get ready to enter a trade.
A confirmed green bar in histogram is a sign that meaningful positive behaviour has occurred and the trade can be taken above the high confirmed bar.
In the below snapshot - The Green cross hair shows the recommended entry point for a long trade.
snapshot:
Input Parameters
Fast MA Length - Fast threshold for crossing Meaningful changes in behaviour
Slow MA Length - Slow threshold for crossing Meaningful changes in behaviour
Display Imaginary bars - Toggle On/Off for displaying virtual candles
Regression Length - Histogram sensitivity (The Shorter value the more sensitive for changes )
Virtual Bars Smoothing Length - Length threshold for virtual bars smoothing (Increasing/Decreasing the value will impact when we consider Meaningful changes in behaviour)
Limitations:
In some cases when stock is not making a Meaningful change in behaviour for long time both the virtual bars and the histogram will be flat.
In such cases, consider changing to a higher time frame or changing the sensitivity settings.
Momentumstrategy

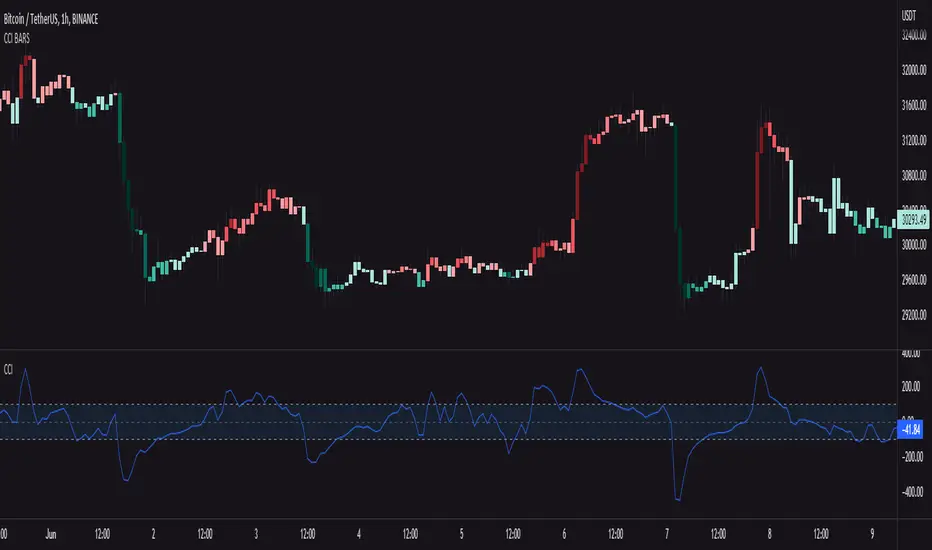
CCI BARSCandlesticks with color of the current CCI value
This script works following: It measures CCI value from -250 to 250 => the lower the value, the darker green candlesticks will be.. it works the same in the opposite direction, but with red color
You can also edit colors of candlesticks and length and source of the CCI indicator
Momentum Scalping & Swing Signals With AlertsThis Momentum indicator shows a green or red ribbon when smoothed momentum is bullish or bearish. It also includes a long moving average for overall trend confirmation. Wait until the ribbon holds above or below the long moving average and take positions in that direction.
To get an easier to read momentum indicator, I smoothed the momentum out and paired it next to a short term RMA. These two together form the ribbon that will show you early reversals and trend direction. The long moving average is used as an overall trend detector and confirmation for longer term trends.
***HOW TO USE***
Scalping: Enter longs when the ribbon turns green and enter shorts when the ribbon turns red. Exit positions when the ribbon turns the opposite color or crosses the long moving average.
Swing Trading: When the ribbon holds above the long moving average or breaks out and retests it, look for long positions and exit when the ribbon turns red or crosses the long moving average. When the ribbon holds below the long moving average or breaks down and retests it, look for short positions and exit when the ribbon turns green or crosses the long moving average.
***DETAILS***
This indicator gives early reversal signals very well and waiting for the momentum ribbon to cross the long moving average helps to get you into positions when the market is ready to really move while filtering out some of the noise.
The ribbon and background will change to green or red depending on whether it is currently bullish or bearish.
There is also a label that changes colors and tells you if momentum is bullish or bearish and also whether the momentum ribbon is above or below the long moving average.
Green or red circles will appear on the indicator when there is a bullish or bearish cross of the momentum ribbon and the long moving average.
It includes alerts that trigger when momentum is turning bullish/bearish or when the momentum ribbon is crossing the long moving average.
***CUSTOMIZATION***
Each piece of this indicator can be customized to suit your preferences including the momentum source, length, smoothing length, short moving average length and long moving average length. You can also turn off the labels, signals and long moving average. All of these settings can be managed within the indicator settings input tab.
***MARKETS***
This indicator can be used as a signal on all markets, including stocks, crypto, futures and forex.
***TIMEFRAMES***
This Momentum Scalping & Swing Signals indicator can be used on all timeframes.
***TIPS***
Try using numerous indicators of ours on your chart so you can instantly see the bullish or bearish trend of multiple indicators in real time without having to analyze the data. Some of our favorites are Trend Friend Scalp & Swing Trade Signals, Volume Spike Scanner, Buy & Sell Pressure Volume Profile, and RSI Scalper in combination with this momentum indicator. They all have real time Bullish and Bearish labels as well so you can immediately understand each indicator's trend.

LNL Squeeze ArrowsIf you struggle with the entries, low % win rate or trading the squeeze setup overall, this indicator is for you!
If you look closely at your losing trades, chances are the losers have one thing in common = inverse momentum. I created this tool after I found out that Stacked EMAs and picture perfect trend is not the only thing you need for a squeeze setup. Squeeze arrows pinpoint the exact moment where the squeeze momentum change happens (momentum change is absolutely crucial for the squeeze setup). These arrows will help you stay out of "everything was aligned but still failed" type of setups.
Squeeze Arrows:
1. Momentum Arrows (cyan blue/red) - Showing the best possible moment for an entry during the squeeze (after you see one, you can expect the squeeze to fire soon).
2. Slingshot Arrows (yellow) - Even though you can trade off of them, these arrows work mostly as a confirmation & caution tool. If an inverse slingshot arrow is plotted during a squeeze that means caution = you should wait because momentum is not on your side thus there there is a quite high probability that the squeeze can fire the other direction.
Squeeze Dots Trigger:
Represents the number of red dots (squeeze) after which the arrows should plot. Default = 5 (only after 5 red dots, arrows will appear), some traders like to set it on 3 or even 1.
Tips & Tricks:
1.Breakout or Bailout Mentality
- The big advantage of the arrows is the fact that they either work straight away or they don't. This is where you can apply the breakout or bailout mentality and really focus exclusively on the breakout part of the whole squeeze move. You can minimize the risk by putting mental stops just a few points below the last low of the candle where the arrows appeared. That way you can be stopped out even during the squeeze = won't hurt as much as when the squeeze fire the opposite direction. Reward may be the same but the risk is lower.
2. Yellow Flags
- Use the slingshot arrows as a caution tool. Even if all your squeeze criteria are met. Yellow inverse arrow = caution (wait for the true momentum change). Once the slingshot arrow appears in the conext of the trend, you are good to go.
3. Last Arrow Rule
- Sometimes you will see a lot of arrows during the longer squeezes. This is where the last arrow rule come in handy. The last arrow you see on chart can be canceled anytime by a new one. The last arrow is the valid one!
Hope you can squeeze from these squeeze arrows as much as there is to squeeze so you can finally trade the squeeze with ease.
Hope it helps.

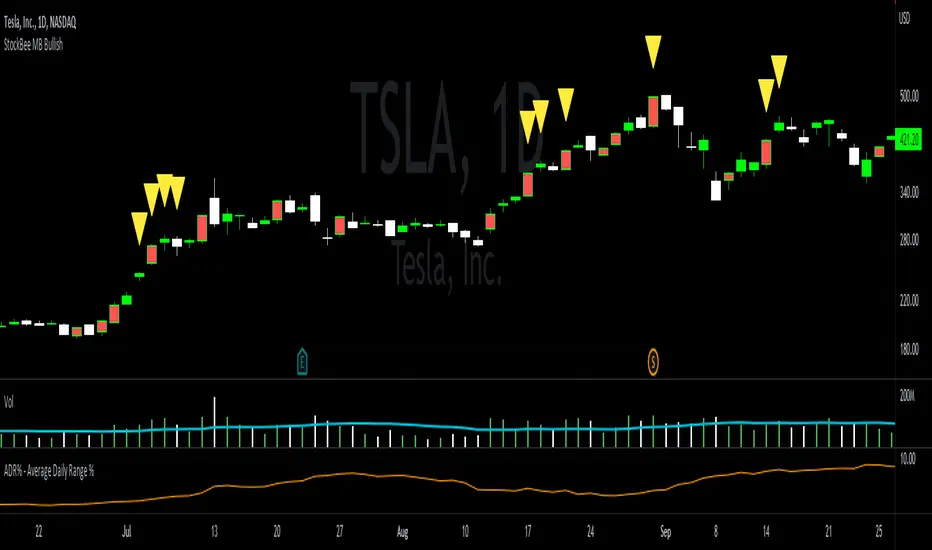
StockBee MB BullishStockBee Bullish Momentum Burst & 20% Plus Study Tool
The Stockbee bullish momentum burst study tool is helpful for practitioners of the momentum burst method who want to easily find historical momentum bursts and/or 20% plus gainers using Trading View. This script finds three specific breakouts that meet the below criteria:
4% Breakouts (Colors Candle Body)
1. Volume of the candle is greater than the previous candle volume.
2. The percent change of candle's price is greater than 4% from the previous candle close.
3. Current candle close is less than 30% from candle's high.
**Users can toggle 4% Breakouts on/off and also change candle body color in settings**
Dollar Breakouts (Colors Candle Body)
1. The change of candle's price is greater than $0.90 from the previous candle close.
2. Current candle close is less than 30% from candle's high.
** Dollar Breakout does not take volume into consideration **
**Users can toggle Dollar Breakouts on/off and also change candle body color in settings**
20% Plus Gainers (Displays Yellow Triangle Icon)
1. The change over five candles is greater than 20%.
**Users can toggle 20% plus label on/off, cannot change the label color**
This script also filters out any candle that gaps up and breaks down with a close above 4% the previous candle (Eliminates gap-ups that fade). This tool is meant to find and filter possible candidates. Not every marked candle is a great momentum burst trade. Users can look at 4% Breakouts, Dollar Breakouts, 20% Plus Gainers individually or any combination of the three.
This is helpful for Trading View users trading this specific setup.
Accelerating Dual Momentum ScoreThis is a score metric used by the Accelerating Dual Momentum strategy.
According to the website you referenced when you created, the strategy is as follows:
Strategy Rules
This strategy allocates 100% of of the portfolio to one asset each month.
1. On the last trading day of each month, calculate the “momentum score” for the S&P 500 ( SPY ) and the international small cap equities (SCZ). The momentum score is the average of the 1, 3, and 6-month total return for each asset.
2. If the momentum score of SCZ > SPY and is greater than 0, invest in SCZ.
3. If the momentum score of SPY > SCZ and is greater than 0, invest in SPY .
4. If neither momentum score is greater than 0, calculate the 1-month total return for long-term US Treasuries ( TLT ) and US TIPS (TIP). Invest in whichever has the higher return.
Source: portfoliodb.co

StockBee 4% BreakoutThe Stockbee 4% Breakout script is a study tool for users who wants to do a deep dive on StockBee's 4% Breakout momentum burst method. This script will assist a specific group of traders who trade this method easily find historical momentum bursts. This script finds and colors red any candle body that meets the following criteria:
1. Volume of the candle is greater than the previous candle volume.
2. The percent change of candle's price is greater than 4% from the previous candle close.
3. Current candle close is less than 30% from candle's high.
This script also filters out any candle that gaps up and breaks down with a close above 4% the previous candle (Eliminates gap-ups that fade). This tool is meant to find and filter possible candidates. Not every marked candle is a great momentum burst trade.
This is very helpful for Trading View users trading this specific setup.

MFI + RSI + MOM With Bull & Bear Trend LabelMOMENTUM + MONEY FLOW INDEX + RELATIVE STRENGTH INDEX WITH BULL & BEAR LABELS
This is a combination of 3 popular indicators. Momentum(MOM), Money Flow Index(MFI) and Relative Strength Index(RSI) along with color changing labels that tell you each indicator's current trend.
The middle white line shows the level that each indicator needs to stay above to be bullish and below for bearish. Watch for all three indicators to cross and hold above or below the mid line for big moves.
It is important to note that these indicators do not need to be going up to be bullish or down to be bearish. They just need to hold above or below the mid line to understand the overall trend.
The momentum indicator is the most relevant in my opinion. If it is holding above the mid line steadily, usually the overall trend will continue upwards so look to buy the dips if the momentum cloud is staying above the white line and vice versa.
It is also important to note that the default settings for this indicator are the 100 period as I find it to be super relevant across most charts but these numbers can be changed in the indicator settings.
Since momentum swings wildly past the normal 0-100 range, it is important to note that the momentum line has been “normalized” to stay within this same range as the rsi and mfi. So if you look at a normal momentum indicator side by side with this indicator it will not look the same however, I find it to be a very good indicator of overall direction so I know the current market sentiment even when price is diverging from the indicator directions.
All of the colors, sources and lengths can be easily customized in the indicator settings input tab.
***HOW TO USE***
When Momentum is above the mid line, it is bullish. When Momentum is below the mid line, it is bearish.
A label on the right side will update in real time to tell you if momentum is Bullish or Bearish for faster recognition of the trend.
When RSI is above the mid line, it is bullish. When Momentum is below the mid line it is bearish.
A label on the right side will update in real time to tell you if RSI is Bullish or Bearish for faster recognition of the trend.
When MFI is above the mid line, it is bullish. When MFI is below the mid line it is bearish.
A label on the right side will update in real time to tell you if MFI is Bullish or Bearish for faster recognition of the trend.
This indicator was built to help you quickly identify the Bullish or Bearish nature of the current trend with a live color changing label so you can glance at the label and understand it's direction without analyzing the indicator data.
***MARKETS***
This indicator can be used as a signal on all markets, including stocks, crypto, futures and forex.
***TIMEFRAMES***
This mom + mfi + rsi indicator can be used on all timeframes.
***TIPS***
Try using numerous indicators of ours on your chart so you can instantly see the bullish or bearish trend of multiple indicators in real time without having to analyze the data. Some of our favorites are our Auto Fibonacci, Directional Movement Index, Volume Profile, Auto Support And Resistance and Money Flow Index in combination with this indicator. They all have real time Bullish and Bearish labels as well so you can immediately understand each indicator's trend.

Momentum With Bullish & Bearish LabelMOMENTUM WITH BULLISH AND BEARISH SIGNALS
This is a momentum oscillator that paints red or green depending on whether Momentum is above or below the zero line. It includes a label on the right hand side that will reflect the bullish or bearish direction of the current momentum by changing colors to red or green and text telling you Bullish or Bearish.
***HOW TO USE***
When Momentum is above zero, it is bullish. When Momentum is below zero it is bearish.
A label on the right side will update in real time to tell you if momentum is Bullish or Bearish for faster recognition of the trend.
When momentum is above the zero line(Bullish) but trending downward, a second label will show up in purple to notify you of a change in momentum direction.
When momentum is below the zero line(Bearish) but trending upward, a second label will show up in purple to notify you of a change in momentum direction.
This indicator was built to help you quickly identify the Bullish or Bearish nature of the current Momentum using colors as well as a live color changing label so you can glance at the label and understand it's direction without analyzing the indicator data.
***MARKETS***
This indicator can be used as a signal on all markets, including stocks, crypto, futures and forex.
***TIMEFRAMES***
This momentum indicator can be used on all timeframes.
***TIPS***
Try using numerous indicators of ours on your chart so you can instantly see the bullish or bearish trend of multiple indicators in real time without having to analyze the data. Some of our favorites are our Auto Fibonacci, Directional Movement Index, Volume Profile, Auto Support And Resistance and Money Flow Index in combination with this Momentum Oscillator. They all have real time Bullish and Bearish labels as well so you can immediately understand each indicator's trend.

WhaleCrew VisionVision is an advanced momentum oscillator that visualizes momentum strength with overbought and oversold readings.
Features
Momentum Waves
Divergence Detection (regular and hidden divergences)
Detection for momentum shifts (detects higher lows/lower highs on the oscillator)
Detection for momentum stagnation
Moneyflow
Most important: Our Custom Strategy Builder
Custom Strategy Builder
The custom strategy builder is a framework that allows you to easily create custom strategies.
1. Configure long/short conditions
Pre-defined conditions for custom timeframes, under which you're looking to potentially enter a trade.
2. Configure trigger
Select a trigger (e.g. "Wave Cross" or "Wave Lower High") to generate labels/alerts for potential entries, whenever long/short conditions are met.
3. Configure Take Profit Conditions
Potential Take Profits are triggered by momentum stagnation.
4. Backtest your strategy
By using our open-source backtester script (published on our profile).
5. Trade responsibly
Manually review each signal/alert before taking any actions.
Note: The "Strategy Backtest" input section can also help you develop your strategy.
Usage
You can use this indicator to follow the trend, detect momentum shifts or memorize patterns.
Take a systematic approach by using our strategy builder.
Access to this indicator can be obtained through our website.

Dynamic Momentum EcosystemTo make emotions obsolete in trading/investing, traders must able to understand the overall trend and disregard with the short term fluctuations of the green and red candles formation. Generally, the moving averages identify the trend, while the MACD-Histogram and Volume measures momentum. As a result, the Impulse System combines trend following and momentum to identify tradable impulses. This unique indicator combination is color coded into the price bars for easy reference.
I've created a script that able help traders to do as such by removing noises and focusing on the momentum + trend. In this Momentum + Trend Following ecosystem, there are 4 colors:
Lime = Price closed higher + volume transacted higher than average + MACD Histogram increases + 13 EMA increases
Green = Price closed higher + MACD Histogram increases + 13 EMA increases
Red = Price closed lower + MACD Histogram decreases + 13 EMA decreases
Blue = Either MACD Histogram increases/decreases + 13 EMA increases/decreases
Lime candle is viewed as a robust bullish sign as price increases, supported by the rising MACD Histogram, 13EMA, and higher than average volumes transacted. Perfect for dip buying near the 20/50 MAs.
Green candle is viewed as bullish with the rising of MACD Histogram and EMA. Good for dip buying near the 20/50 MAs.
Red candle is viewed as bearish with the declining of MACD Histogram and EMA. Good for short entry. Can also be the early sign to take profits, as it could be the preliminary signal for trend reversal.
Blue candle is viewed as neutral.
The upper dotted purple line is the 52candles high.
The vertical grey line appears when the price > MA50 crosses above MA200, which is a golden crossover.
Traders are advised to time their entry using the impulse coloring system for stocks that are trading near the dotted line, following the grey line formation.
Another example, Zoom on daily timeframe (based on its 2020 great bullrun)
Another example, Hartalega on daily timeframe (based on its 2020 great bullrun)

Volume and Moving average,will this model working in real-trade?i`ve recently made this script through few month,understand me if there are some incorrect grammar or something.
basically this script is based on moving average strategy and the bollinger bands
if the buy volume is bigger than sell volume,also buy volume is bigger then daily average volume than it`s defined current market is bullish and entered(of course there is some other conditions)
the exit condition is find the highest price after entered,keep refresh the highest price through time and then,if the current price is ?%lower then highest price,it will closed the position.
my question is this : 1 this model will working in real-trade?
2 why the winning rate is 100%?
- i`ve coded if the position margin over -10%,close the position this code isn`t work? or the other profit line is prevent that happened?
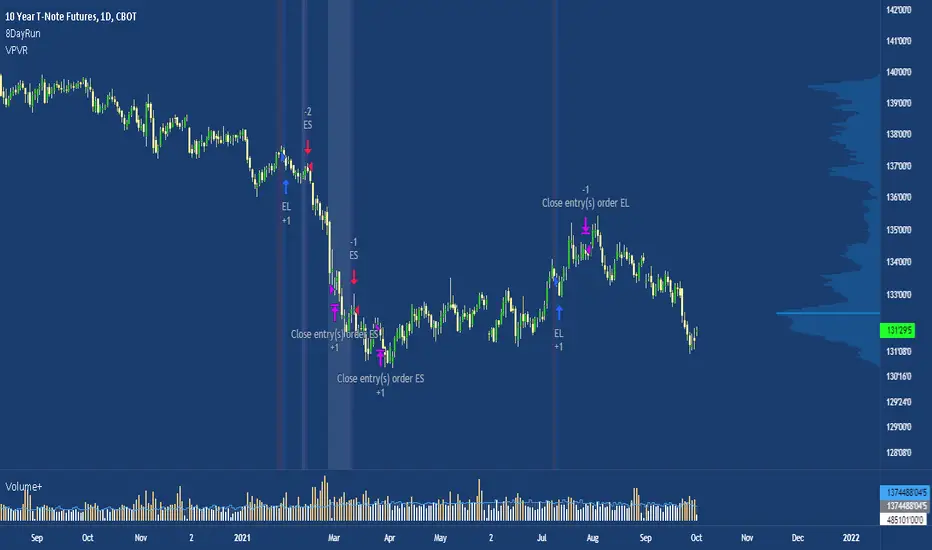
8 Day Extended Runs Inspired by Linda Bradford Raschke.
Strategy suited to the US T-note (ZN1!) with a t-test of 4.06.
The 5 day SMA is vital to Linda’s trend identification system. She’s done extensive testing and research using this indicator and has built models based on it. Linda used the 5 day SMA to determine that large outlier price moves happen in the direction of the trend in each market about 9-10 times per year. The powerful part about that number is that when the trend does persist, it can go on a long run, making this a trade with a high expected value.
Note: the current exit criteria is sell 10 days after entry, users should experiment with different stop placements.
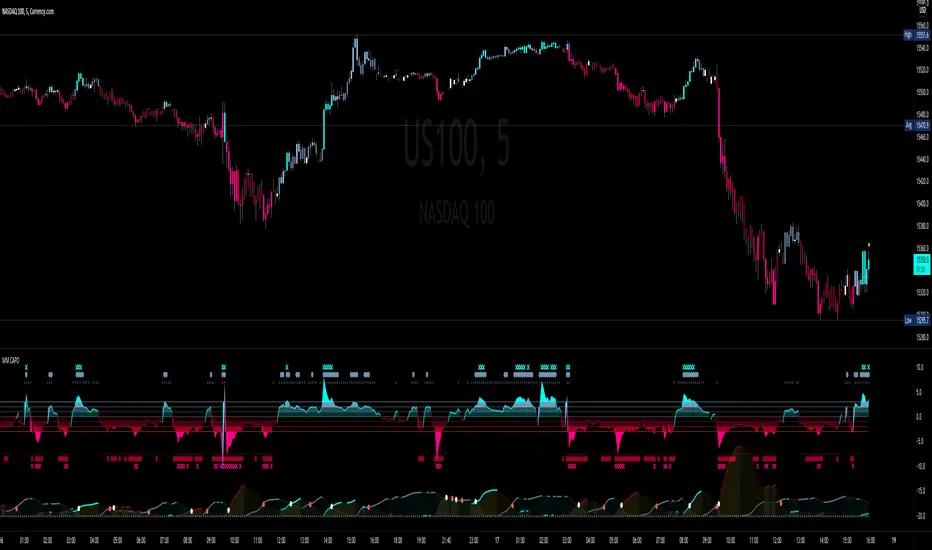
MM CAPOA Dons right Hand
Standard Deviation is the game we are playing here
-3 levels to show the strength of both buy/sell
-Colors the candles based on signal (momentum) strength
-Multi timeframe feature
-Color candles for on chart confirmation ( with sensitivity the High you set it will only give you stronger signals)
-Alerts for different level signals including 0 crossover
-Can change the strength of the signal to show what Level you would like to confirm your trades with
Also built in Momentum squeeze indicator
-the Grey line indicates (BBands) SQUEEZE setting in
-the Bright Blue line indicates the EXPANSION of the BBands ( BUY )
-the Red line indicates the Expansion of the BBands ( Sell )
How to use
Confirm your on chart Strategy with the Momentum signal Of the MM capo with your preferred level of confirmation ( Level 1-3 )
You can set alerts to let you know when momentum as pick up and you can start looking for entry ( Usually means breaks of structure )
The Squeeze Indicator can show you if the momentum confirmation is goin to continue in that directions by seeing if you are in a tight BB squeeze or not
Video Explanation On YouTube channel
Link below or PM us for access to this indicator Happy Trading
NEXT RSIThis is an amped-up version of the original Relative Strength Index (RSI) oscillator, giving the slope a smoother, sometimes leading edge. Our not-so-secret sauce within the algo is price/volume weighing, completely user configurable. NEXT RSI is intended to be used just like the vanilla RSI within the context of technical analysis: identifying overvalued (above upper limit) and undervalued (below lower limit) price action, as well as establishing a bias baseline (bullish if over 50; bearish if under 50). Higher NEXT RSI bottoms compared to lower price bottoms signify bullish divergence; lower NEXT RSI tops compared to higher price tops signify bearish divergence.
Below is a screenshot comparing NEXT RSI with default settings to vanilla RSI on AAPL M1 chart.
Input parameters:
Length: controls the averaging length of the RSI line.
P/V Weighing: a price/volume smoothing filter, with higher values yielding a smoother RSI line. Values over 10 can introduce lag but also help identify trend. We thought 5 was a pretty good momentum gauge (strengthening, weakening).
P/V Source: this variable is where you can get creative and blend volume with either direct price action (close, H+L/2, etc.) or other indicators such as moving averages, stochastic oscillator, and even the vanilla RSI.

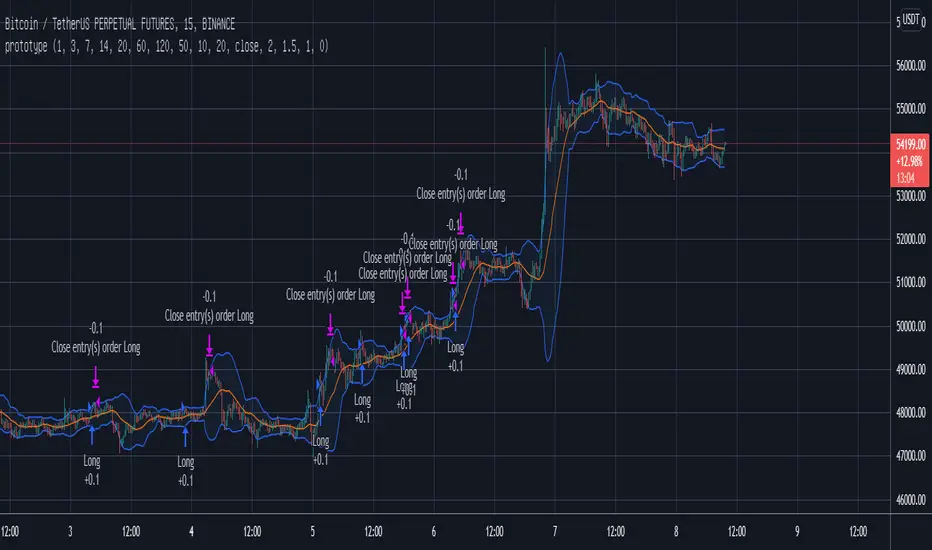
Momentum Strategy IdeaThis strategy idea uses two, fast and slow, momentum indicators for trade setups and exits. This is a fast reacting strategy which is very useful in trending instruments on 1D and 4H timeframes. This is the implementation used in QuantCT app.
You can set operation mode to be Long/Short or long-only.
You also can set a fixed stop-loss or ignore it so that the strategy act solely based on entry and exit signals.
Trade Idea
When both momentum indicators are positive, asset is considered rising ( bullish ) and the plotted indicator becomes green.
When both momentum indicators are negative, asset is considered falling ( bearish ) and the plotted indicator becomes red.
Otherwise, asset is considered ranging and the plotted indicator becomes orange.
Entry/Exit rules
Enter LONG if both momentum indicators are greater than zero (i.e. when the plotted indicator becomes green).
Enter SHORT if both momentum indicators are lower than zero (i.e. when the plotted indicator becomes red).
EXIT market if none of the above (i.e. when the plotted indicator becomes orange).
CAUTION
It's just a bare trading idea - a profitable one. However, you can enhance this idea and turn it into a full trading strategy with enhanced risk/money management and optimizing it, and you ABSOLUTELY should do this!
DON'T insist on using Long/Short mode on all instruments! This strategy performs much better in Long-Only mode on many (NOT All) trending instruments (Like BTC , ETH, etc.).

Momentum Trading Strategy (Weekly Chart)The strategy will open position when there is momentum in the stock
The strategy will ride up your stop loss based on the super trend.
The strategy will close your operation when the market price crossed the stop loss.
The strategy will close operation when the line based on the volatility will crossed

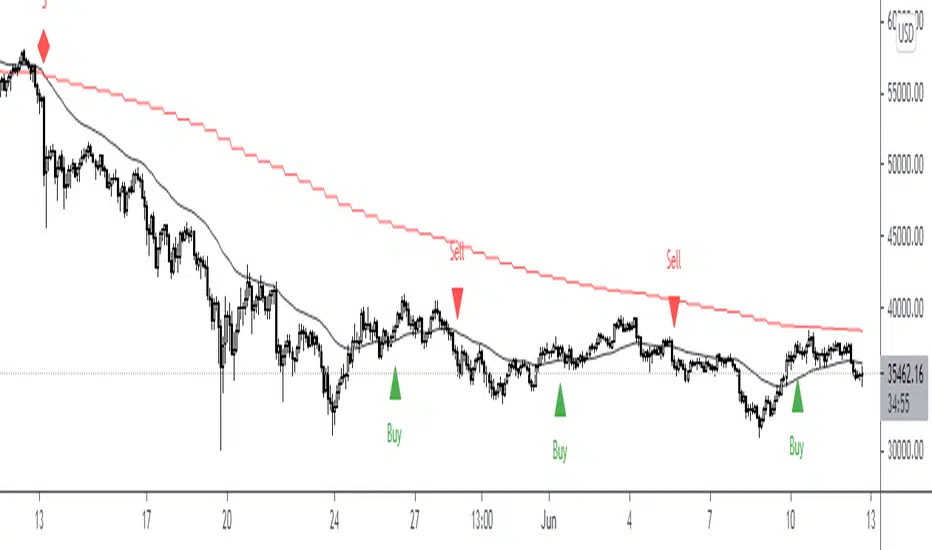
RP trend readerThis tool is a momentum reader
You can use this tools at any timeframe
When the momentum is meet the condition then it will show the signal
The signal are "Buy" and "Sell"
Buy means that you Long or exit your Short at the price
Sell means that you Short or exit your Long at the price
There's pivot line at there
Pivot line is showing how strong the momentum right now
If the price above or way above the pivot line then the uptrend is strong (very bullish)
If the price below or way below the pivot line then the downtrend is strong (very bearish)
Don't blindly Buy or Sell just because the signal is coming out
Combine it with the market structure, look at the big picture instead lower TF and the edge is yours
The best entry is when the price bounce close to the pivot point
Be carefull with the sideway or choppy market. You can see that the price is going up and down at the pivot line and the signals come out quite often
Follow your trading plan, be patience (don't FOMO) and be discipline with your plan... Cheers...
yin+yang StrategyThis strategy is the combination of 16 different indicators that collectively give you a signal for a long and short position.
It will mostly give you 8-9 successful trade out of 10.
have fun.

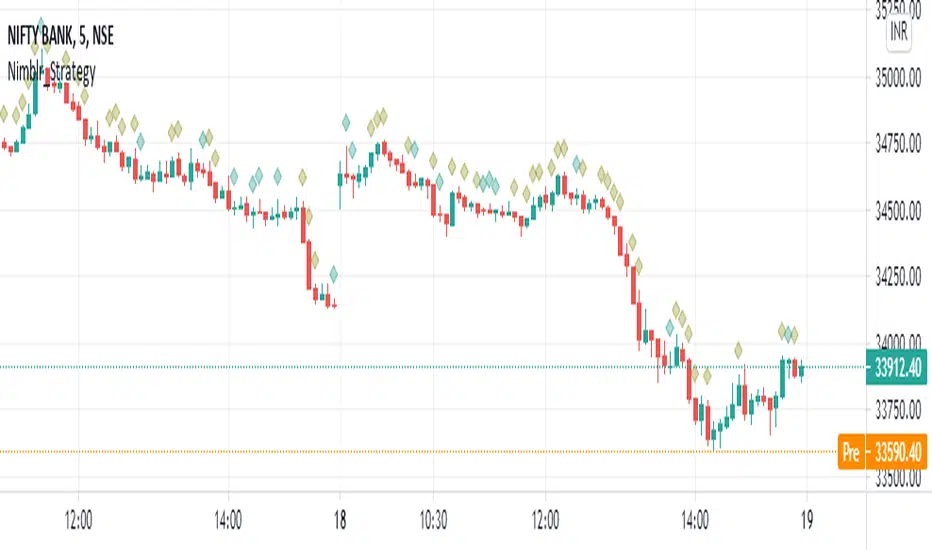
Nimblr Strategy- Momentum Candle IndicatorDescription:
Strategy uses the Nimblr advice.
It display the momentum candle with diamond on top of the candle.
Candle Height= High-Low
Body Height=Open- close
Criteria:
Candle height=100%
And body Height >50%
NSE:NIFTY
Delta-RSI Oscillator StrategyDelta-RSI Oscillator Strategy:
This strategy illustrates the use of the recently published Delta-RSI Oscillator as a stand-alone indicator.
Delta-RSI represents a smoothed time derivative of the RSI, plotted as a histogram and serving as a momentum indicator.
There are three optional conditions to generate trading signals (set separately for Buy, Sell and Exit signals):
Zero-crossing : bullish when D-RSI crosses zero from negative to positive values (bearish otherwise)
Signal Line Crossing : bullish when D-RSI crosses from below to above the signal line (bearish otherwise)
Direction Change : bullish when D-RSI was negative and starts ascending (bearish otherwise)
Since D-RSI oscillator is based on polynomial fitting of the RSI curve, there is also an option to filter trade signal by means of the root mean-square error of the fit (normalized by the sample average).
My original D-RSI Oscillator script can be found here:

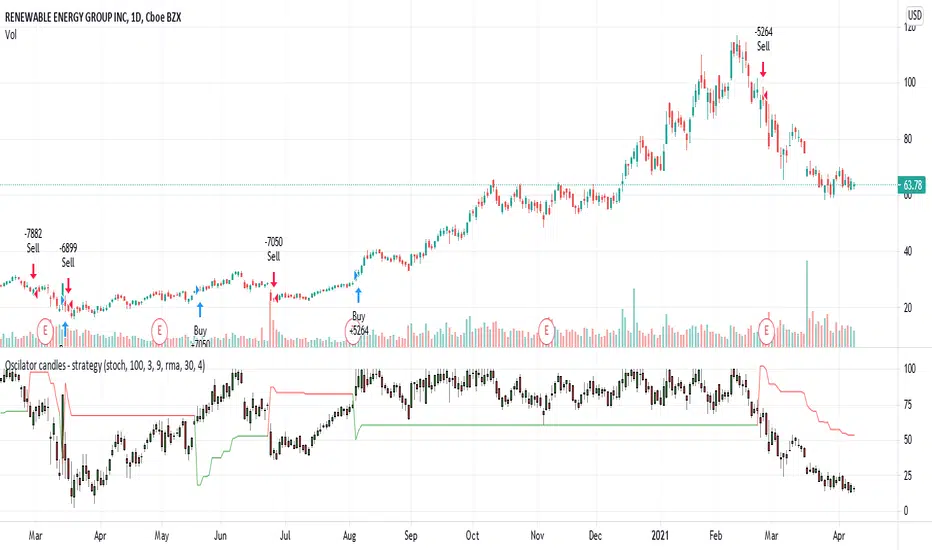
Oscilator candles - momentum strategyThis is momentum based strategy based on indicators published earlier:
Also trying to use delayed supertrend based on steps as mentioned in the published indicator:
Added option to filter trade entries based on higher timeframe pivots. But, it is not so effective and may need further optimization.
Multi Time Frame Trend, Volume and Momentum ProfileWHAT DOES THIS INDICATOR DO?
I created this indicator to address some of the significant inconveniences when analyzing a security, such as continually switching between different time frames to determine the trend and potential pullbacks, adding volume or volume-derived indicators, and finally, something that would help me determine the strength of the trend (maybe two additional indicators here). So I decided to code this all-in-one indicator that you can add multiple times to your chart depending on the settings you want to use, or just optimize the parameters for the particular asset and then switch between the options.
As the name suggests, it consists of three main sections - Trend , Volume , and Momentum . You have complete control over the parameters, including the Time Frames you want to use for each one (they can be different). So, let me explain each section in more detail.
HOW DOES THE INDICATOR WORK?
1. Trend Settings
In order to determine the trend, you need to set up two Moving Averages. You have a wide choice here - SMA, EMA, WMA, RMA, HMA, DEMA, TEMA, VWMA, and ALMA. Since the indicator does not plot the moving averages on the chart, I strongly suggest using this indicator along with the free "Trend Indicator for Directional Trading(main)" , which you can find in the Public Library. Once you set up the Trend Resolution, the Types of MAs, and their lengths, the indicator will generate a histogram of their convergences and divergences.
The change in colors should help you more easily determine the trend:
a) Bright Green - bull trend and price trending up (a good place to open long)
b) Dark Green - bull trend and price trending down (stay flat or open a long position with great caution)
c) Bright Red - bear trend and price trending down (a good place to open short)
d) Dark Red - bear trend and price trending up (stay flat or open a short position with great caution)
e) In addition, you can change the color palette to reflect the bull/bear trend momentum by scrolling to the bottom and selecting "Color Based on Bull/Bear Momentum", but I will discuss this in more detail below.
This part of the indicator is useful for opening a trade in the direction of the trend or for spotting a potential divergence. Both cases are illustrated below.
2. Volume Settings
The calculations for this part of the indicator are partially taken from "Multi Time Frame Effective Volume Profile" . I will quickly outline the specifics here, but if you want a more thorough understanding of how it works, please check the description of the MTF Effective Volume Profile indicator .
You have three elements with the following default settings - Resolution (5-min), Lookback (100), and Average (1). This means that the indicator will analyze the last one hundred 5-min bars and will plot a sum of only those that are at least 1 times bigger than the average. Those that are smaller than the average will be left out from the calculation. What you get is a trend line showing you accumulation/distribution based on modified volume parameters.
This part of the indicator is useful for spotting exhaustions and increased buying/selling volume that is opposite to the price trend. As you will see in the picture below, in frame 1 the selling pressure is decreasing, while buying volume is increasing. At one point supply dries out and the bulls take control, thus reverting the price. In frame 2, however, you can see that the higher high is not met with nearly as much buying volume as in the previous peak, showing that the bulls are exhausted and maybe a trend change will follow or at the very least that the bull trend will take a break.
3. Momentum Settings
The final part is an RSI smoothed through a Moving Average with the addition of some minor optimizations. Thus, the parameters you have to configure here aside from the resolution are the RSI length, the moving average that will be used, and its length. Out of the three, this is the most lagging component, but it's also the most accurate one. I must mention that due to the modified nature of this RSI, overbought and oversold levels carry less weight to the trading signals. Rather, pay attention to the change of colors, as they do so when the RSI changes direction based on preset parameters. The picture below shows such instances.
4. Additional Settings
This section consists of 4 elements:
a) Length of Trend - filters out the noise and gives a signal only when the trend becomes more established
b) ADX Threshold - filters out trading ranges and indecision zones when it's not recommended to open a trade
c) Select Analysis - choose what part of the indicator you want to see from a drop-down menu
d) Color Based on Bull/Bear Momentum - a global setting that will override the preset coloring of each indicator and will replace it with colors based on bull/bear strength and momentum - green for bulls, red for bears, and gray for non-trading zones.
The last part of this indicator is a combination of all of the above and is called a Points-Based System . It generates 3 rows of dots that go light green when bull criteria are met, orange when bear criteria are met, or gray when it's neither of the two. When you get a column of 3 green dots you get a buy signal. Similarly, a column of 3 orange dots gives you a sell signal. Grey zones are non-tradeable. It goes without saying that the frequency and quality of the signals you get will almost entirely depend on your settings, so feel free to experiment and adjust the indicator to catch the best moves for the given security.
In terms of indicator adjustments, I have left almost every part open to configuration. That is 15 parameters and 35 adjustable colors.
HOW MUCH DOES THE INDICATOR COST ?
As much as I would like to offer it for free (as some of my other ones), a great deal of work, trading logic, and testing have gone into creating this indicator. More than a few hundred iterations and a few dozen branches were required to reach the end result which is a precise combination of usefulness, simplicity, and practicality. Furthermore, this indicator will continue to be updated and user-requested features that improve its performance will be added.
Disclaimer: The purpose of all indicators is to indicate potential setups, which may lead to profitable results. No indicator is perfect and certainly, no indicator has a 100% success rate. They are subject to flaws, wrongful interpretation, bugs, etc. This indicator makes no exception. It must be used with a sound money management plan that puts the main emphasis on protecting your capital. Please, do not rely solely on any single indicator to make trading decisions instead of you. Indicators are storytellers, not fortune tellers. They help you see the bigger picture, not the future.
To find out more about how to gain access to this indicator, please use the provided information below or just message me. Thank you for your time.
