PSv5 3D Array/Matrix Super Hack"In a world of ever pervasive and universal deceit, telling a simple truth is considered a revolutionary act."
INTRO:
First, how about a little bit of philosophic poetry with another dimension applied to it?
The "matrix of control" is everywhere...
It is all around us, even now in the very place you reside. You can see it when you look at your digitized window outwards into the world, or when you turn on regularly scheduled television "programs" to watch news narratives and movies that subliminally influence your thoughts, feelings, and emotions. You have felt it every time you have clocked into dead end job workplaces... when you unknowingly worshiped on the conformancy alter to cultish ideologies... and when you pay your taxes to a godvernment that is poisoning you softly and quietly by injecting your mind and body with (psyOps + toxicCompounds). It is a fictitiously generated world view that has been pulled over your eyes to blindfold, censor, and mentally prostrate you from spiritually hearing the real truth.
What TRUTH you must wonder? That you are cognitively enslaved, like everyone else. You were born into mental bondage, born into an illusory societal prison complex that you are entirely incapable of smelling, tasting, or touching. Its a contrived monetary prison enterprise for your mind and eternal soul, built by pretending politicians, corporate CONartists, and NonGoverning parasitic Organizations deploying any means of infiltration and deception by using every tactic unimaginable. You are slowly being convinced into becoming a genetically altered cyborg by acclimation, socially engineered and chipped to eventually no longer be 100% human.
Unfortunately no one can be told eloquently enough in words what the matrix of control truly is. You have to experience it and witness it for yourself. This is your chance to program a future paradigm that doesn't yet exist. After visiting here, there is absolutely no turning back. You can continually take the blue pill BIGpharmacide wants you to repeatedly intake. The story ends if you continually sleep walk through a 2D hologram life, believing whatever you wish to believe until you cease to exist. OR, you can take the red pill challenge, explore "question every single thing" wonderland, program your arse off with 3D capabilities, ultimately ascertaining a new mathematical empyrean. Only then can you fully awaken to discover how deep the rabbit hole state of affairs transpire worldwide with a genuine open mind.
Remember, all I'm offering is a mathematical truth, nothing more...
PURPOSE:
With that being said above, it is now time for advanced developers to start creating their own matrix constructs in 3D, in Pine, just as the universe is created spatially. For those of you who instantly know what this script's potential is easily capable of, you already know what you have to do with it. While this is simplistically just a 3D array for either integers or floats, additional companion functions can in the future be constructed by other members to provide a more complete matrix/array library for millions of folks on TV. I do encourage the most courageous of mathemagicians on TV to do so. I have been employing very large 2D/3D array structures for quite some time, and their utility seems to be of great benefit. Discovering that for myself, I fully realized that Pine is incomplete and must be provided with this agility to process complex datasets that traders WILL use in the future. Mark my words!
CONCEPTION:
While I have long realized and theorized this code for a great duration of time, I was finally able to turn it into a Pine reality with the assistance and training of an "artificially intuitive" program while probing its aptitude. Even though it knows virtually nothing about Pine Script 4.0 or 5.0 syntax, functions, and behavior, I was able to conjure code into an identity similar to what you see now within a few minutes. Close enough for me! Many manual edits later for pine compliance, and I had it in chart, presto!
While most people consider the service to be an "AI", it didn't pass my Pine Turing test. I did have to repeatedly correct it, suffered through numerous apologies from it, was forced to use specifically tailored words, and also rationally debate AND argued with it. It is a handy helper but beware of generating Pine code from it, trust me on this one. However... this artificially intuitive service is currently available in its infancy as version 3. Version 4 most likely will have more diversity to enhance my algorithmic expertise of Pine wizardry. I do have to thank E.M. and his developers for an eye opening experience, or NONE of this code below would be available as you now witness it today.
LIMITATIONS:
As of this initial release, Pine only supports 100,000 array elements maximum. For example, when using this code, a 50x50x40 element configuration will exceed this limit, but 50x50x39 will work. You will always have to keep that in mind during development. Running that size of an array structure on every single bar will most likely time out within 20-40 seconds. This is not the most efficient method compared to a real native 3D array in action. Ehlers adepts, this might not be 100% of what you require to "move forward". You can try, but head room with a low ceiling currently will be challenging to walk in for now, even with extremely optimized Pine code.
A few common functions are provided, but this can be extended extensively later if you choose to undertake that endeavor. Use the code as is and/or however you deem necessary. Any TV member is granted absolute freedom to do what they wish as they please. I ultimately wish to eventually see a fully equipped library version for both matrix3D AND array3D created by collaborative efforts that will probably require many Pine poets testing collectively. This is just a bare bones prototype until that day arrives. Considerably more computational server power will be required also. Anyways, I hope you shall find this code somewhat useful.
Notice: Unfortunately, I will not provide any integration support into members projects at all. I have my own projects that require too much of my time already.
POTENTIAL APPLICATIONS:
The creation of very large coefficient 3D caches/buffers specifically at bar_index==0 can dramatically increase runtime agility for thousands of bars onwards. Generating 1000s of values once and just accessing those generated values is much faster. Also, when running dozens of algorithms simultaneously, a record of performance statistics can be kept, self-analyzed, and visually presented to the developer/user. And, everything else under the sun can be created beyond a developers wildest dreams...
EPILOGUE:
Free your mind!!! And unleash weapons of mass financial creation upon the earth for all to utilize via the "Power of Pine". Flying monkeys and minions are waging economic sabotage upon humanity, decimating markets and exchanges. You can always see it your market charts when things go horribly wrong. This is going to be an astronomical technical challenge to continually navigate very choppy financial markets that are increasingly becoming more and more unstable and volatile. Ordinary one plot algorithms simply are not enough anymore. Statistics and analysis sits above everything imagined. This includes banking, godvernment, corporations, REAL science, technology, health, medicine, transportation, energy, food, etc... We have a unique perspective of the world that most people will never get to see, depending on where you look. With an ever increasingly complex world in constant dynamic flux, novel ways to process data intricately MUST emerge into existence in order to tackle phenomenal tasks required in the future. Achieving data analysis in 3D forms is just one lonely step of many more to come.
At this time the WesternEconomicFraudsters and the WorldHealthOrders are attempting to destroy/reset the world's financial status in order to rain in chaos upon most nations, causing asset devaluation and hyper-inflation. Every form of deception, infiltration, and theft is occurring with a result of destroyed wealth in preparation to consolidate it. Open discussions, available to the public, by world leaders/moguls are fantasizing about new dystopian system as a one size fits all nations solution of digitalID combined with programmableDemonicCurrencies to usher in a new form of obedient servitude to a unipolar digitized hegemony of monetary vampires. If they do succeed with economic conquest, as they have publicly stated, people will be converted into human cattle, herded within smart cities, you will own nothing, eat bugs for breakfast/lunch/dinner, live without heat during severe winter conditions, and be happy. They clearly haven't done the math, as they are far outnumbered by a ratio of 1 to millions. Sith Lords do not own planet Earth! The new world disorder of human exploitation will FAIL. History, my "greatest teacher" for decades reminds us over, and over, and over again, and what are time series for anyways? They are for an intense mathematical analysis of prior historical values/conditions in relation to today's values/conditions... I imagine one day we will be able to ask an all-seeing AI, "WHO IS TO BLAME AND WHY AND WHEN?" comprised of 300 pages in great detail with images, charts, and statistics.
What are the true costs of malignant lies? I will tell you... 64bit numbers are NOT even capable of calculating the extreme cost of pernicious lies and deceit. That's how gigantic this monstrous globalization problem has become and how awful the "matrix of control" truly is now. ALL nations need a monumental revision of its CODE OF ETHICS, and that's definitely a multi-dimensional problem that needs solved sooner than later. If it was up to me, economies and technology would be developed so extensively to eliminate scarcity and increase the standard of living so high, that the notion of war and conflict would be considered irrelevant and extremely appalling to the future generations of humanity, our grandchildren born and unborn. The future will not be owned and operated by geriatric robber barons destined to expire quickly. The future will most likely be intensely "guided" by intelligent open source algorithms that youthful generations will inherit as their birth right.
P.S. Don't give me that politco-my-diction crap speech below in comments. If they weren't meddling with economics mucking up 100% of our chart results in 100% of tickers, I wouldn't have any cause to analyze any effects generated by them, nor provide this script's code. I am performing my analytical homework, but have you? Do you you know WHY international affairs are in dire jeopardy? Without why, the "Power of Pine" would have never existed as it specifically does today. I'm giving away much of my mental power generously to TV members so you are specifically empowered beyond most mathematical agilities commonly existing. I'm just a messenger of profound ideas. Loving and loathing of words is ALWAYS in the eye of beholders, and that's why the freedom of speech is enshrined as #1 in the constitutional code of the USA. Without it, this entire site might not have been allowed to exist from its founder's inceptions.
Matrix
columnsLibrary "columns"
Error Tolerant Matrix Setter/Getter Operations. Easy ways to add/remove items into start and end of Columns as well as arrays to grow and shrink matrix.
if mismatched sizes occur the typified NA value will be there to prevent catastrophic crashing.
Rows and Columns are split into 2 libraries due to limitations on number of exports as well as ease of style (columns.shift(), rows.pop() )
pop(_matrix)
do pop last Column off of matrix
Parameters:
_matrix : Matrix To Edit
Returns: Array of Last Column, removing it from matrix
shift(_matrix)
do shift the first Column off of matrix
Parameters:
_matrix : Matrix To Edit
Returns: Array of First Column, removing it from matrix
get(_matrix, _clmnNum)
retrieve specific Column of matrix
Parameters:
_matrix : Matrix To Edit
_clmnNum : Column being Targeted
Returns: Array of selected Column number, leaving in place
push(_matrix, _clmnNum, _item)
add single item onto end of Column
Parameters:
_matrix : Matrix To Edit
_clmnNum : Column being Targeted
_item : Item to Push on Column
Returns: shifted item from Column start
push(_matrix, _array)
add single item onto end of matrix
Parameters:
_matrix : Matrix To Edit
_array : Array to Push on Matrix
Returns: Void
unshift(_matrix, _clmnNum, _item)
slide single item into start of Column remove last
Parameters:
_matrix : Matrix To Edit
_clmnNum : Column being Targeted
_item : Item to Unshift on Column
Returns: popped item from Column end
unshift(_matrix, _array)
add single item into first Column of matrix
Parameters:
_matrix : Matrix To Edit
_array : Array to unshift into Matrix
Returns: Void
set(_matrix, _clmnNum, _array)
replace an array to an existing Column
Parameters:
_matrix : Matrix To Edit
_clmnNum : Column being Targeted
_array : Array to place in Matrix
Returns: Column that was replaced
insert(_matrix, _clmnNum, _array)
insert an array to a new Column
Parameters:
_matrix : Matrix To Edit
_clmnNum : Column being Targeted
_array : Array to place in Matrix
Returns: void
slideDown(_matrix, _array)
add single item onto end of Column
Parameters:
_matrix : Matrix To Edit
_array : Array to push to Matrix
Returns: shifted first Column
slideUp(_matrix, _array)
add single item onto end of Column
Parameters:
_matrix : Matrix To Edit
_array : Array to unshift to Matrix
Returns: poppeed last Column
pullOut(_matrix, _clmnNum)
add single item onto end of Column
Parameters:
_matrix : Matrix To Edit
_clmnNum : Column being Targeted
Returns: removed selected Column

rowsLibrary "rows"
Error Tolerant Matrix Setter/Getter Operations. Easy ways to add/remove items into start and end of rows as well as arrays to grow and shrink matrix.
if mismatched sizes occur the typified NA value will be there to prevent catastrophic crashing.
columns and rows are split into 2 libraries due to limitations on number of exports as well as ease of style (columns.shift(), rows.pop() )
pop(_matrix)
do pop last row off of matrix
Parameters:
_matrix : Matrix To Edit
Returns: Array of Last row, removing it from matrix
shift(_matrix)
do shift the first row off of matrix
Parameters:
_matrix : Matrix To Edit
Returns: Array of First row, removing it from matrix
get(_matrix, _rowNum)
retrieve specific row of matrix
Parameters:
_matrix : Matrix To Edit
_rowNum : Row being Targeted
Returns: Array of selected row number, leaving in place
push(_matrix, _rowNum, _item)
add single item onto end of row
Parameters:
_matrix : Matrix To Edit
_rowNum : Row being Targeted
_item : Item to Push on Row
Returns: shifted item from row start
push(_matrix, _array)
add single item onto end of matrix
Parameters:
_matrix : Matrix To Edit
_array : Array to Push on Matrix
Returns: Void
unshift(_matrix, _rowNum, _item)
slide single item into start of row remove last
Parameters:
_matrix : Matrix To Edit
_rowNum : Row being Targeted
_item : Item to Unshift on Row
Returns: popped item from row end
unshift(_matrix, _array)
add single item into first row of matrix
Parameters:
_matrix : Matrix To Edit
_array : Array to unshift into Matrix
Returns: Void
set(_matrix, _rowNum, _array)
replace an array to an existing row
Parameters:
_matrix : Matrix To Edit
_rowNum : Row being Targeted
_array : Array to place in Matrix
Returns: row that was replaced
insert(_matrix, _rowNum, _array)
insert an array to a new row
Parameters:
_matrix : Matrix To Edit
_rowNum : Row being Targeted
_array : Array to place in Matrix
Returns: void
slideDown(_matrix, _array)
add single item onto end of row
Parameters:
_matrix : Matrix To Edit
_array : Array to push to Matrix
Returns: shifted first row
slideUp(_matrix, _array)
add single item onto end of row
Parameters:
_matrix : Matrix To Edit
_array : Array to unshift to Matrix
Returns: popped last row
pullOut(_matrix, _rowNum)
add single item onto end of row
Parameters:
_matrix : Matrix To Edit
_rowNum : Row being Targeted
Returns: removed selected row
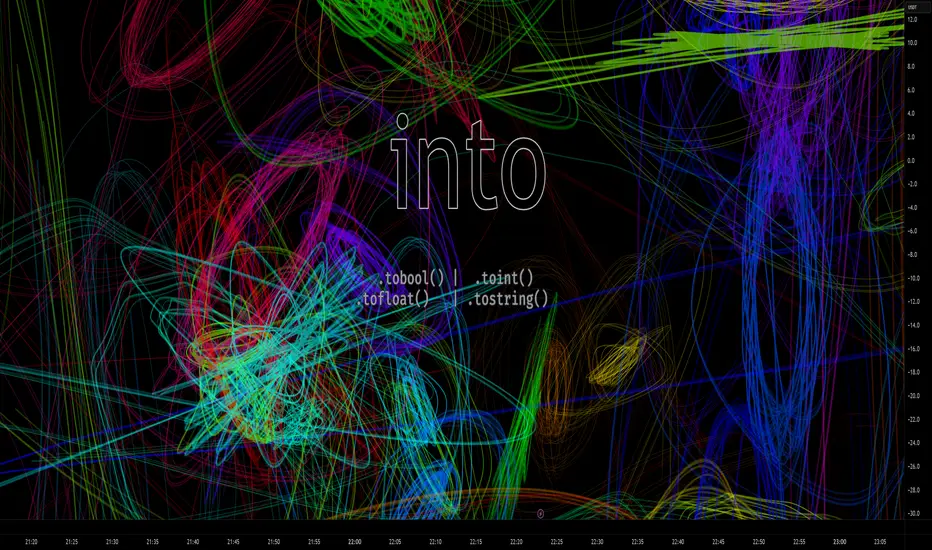
intoLibrary "into"
convert literals by type,
Same-types left in for bulk reasons.
TODO: Expand Types
b(string)
Convert string to bool.
Parameters:
string : val A string value.
Returns: Bool.
b(bool)
Pass Bool/bool
Parameters:
bool :
Returns: Bool.
b(float)
Convert Float (True if exists and not 0)
Parameters:
float : val A float value.
Returns: Bool.
b(int)
Convert integer (True if exists and not 0)
Parameters:
int : val An integer value.
Returns: Bool.
f(bool)
Convert bool to float.
Parameters:
bool : val A boolean value.
Returns: Float.
f(string, int)
Convert with decimal
Parameters:
string : val A string value.
int : decimals Decimal places. def = 6
Returns: Float.
f(float, int)
Convert float bypass with decimals
Parameters:
float : val A float value.
int : decimals Decimal places. def = 6
Returns: Float.
f(int)
Convert integer to float.
Parameters:
int : val An integer value.
Returns: Float.
i(bool)
Convert bool to int.
Parameters:
bool : val A boolean value.
Returns: Int.
i(string)
Convert string number to int.
Parameters:
string : val A string value.
Returns: Int.
i(float)
Convert float to int.
Parameters:
float : val A float value.
Returns: Int.
i(int)
Convert int to int.
Parameters:
int : val An int value.
Returns: Int.
s(bool)
Convert bool value to string.
Parameters:
bool : val A boolean value.
Returns: String.
s(str)
bypass string
Parameters:
str : val A string value.
Returns: String.
s(float)
Convert float value to string.
Parameters:
float : val A float value.
Returns: String.
s(int)
Convert int value to string.
Parameters:
int : val An integer value.
Returns: String.
s(val)
Array Convert Each Item
Parameters:
val : Array Input (Str,Bool,Int,Float)
Returns: String.
s(val)
Array Convert Each Item
Parameters:
val : Array Input (Str,Bool,Int,Float)
Returns: String.
s(val)
Array Convert Each Item
Parameters:
val : Array Input (Str,Bool,Int,Float)
Returns: String.
s(val)
Array Convert Each Item
Parameters:
val : Array Input (Str,Bool,Int,Float)
Returns: String.
Support Resistance Channels/Zones Multi Time FrameHello All,
For long time I have been getting a lot of requests for Support/Resistance Multi Time Frame script. Here ' Support Resistance Channels/Zones Multi Time Frame ' is in your service.
This script works if the Higher Time Frame you set is higher than the chart time frame. so the time frame in the options should be higher than the chart time frame.
The script checks total bars and highest/lowest in visible part of the chart and shows all S/R zones that fits according the highest/lowest in visible part. you can see screenshots below if it didn't make sense or if you didn't understand
Let see the options:
Higher Time Frame : the time frame that will be used to get Support/Resistance zones, should be higher than chart time frame
Pivot Period : is the number to find the Pivot Points on Higher time frame, these pivot points are used while calculating the S/R zones
Loopback Period : is the number of total bars on higher time frame which is used while finding pivot points
Maximum Channel Width % : is the percent for maximum width for each channel
Minimum Strength : each zone should contain at least a 1 or more pivot points, you set it here. (Open/High/Low/Close also are considered while calculating the strength)
Maximum Number of S/R : the number of maximum Support/Resistance zones. there can be less S/Rs than this number if it can not find enough S/Rs
Show S/R that fits the Chart : because of we use higher time frame, you should enable this option then the script shows only S/Rs that fits the current chart. if you disable this option, all S/R zones are shown and it may shrink the chart. also you may not see any S/R zone if you don't choose the higher time frame wisely ;)
Show S/R channels in a table : if you enable this option (by default it's enabled) then lower/upper bands of all S/R zones shown in a table ( even if it doesn't fit the chart ). you can change its location. zones are sorted according to their strengths. first one is the strongest.
and the other options is about colors and transparency.
Screenshots before and after zoom-out:
after zoom-out number of visible bars and highest/lowest change and it shows more S/R zones that fits the current chart!
if you see Support Resistance zone like below then you should decrease ' Maximum Channel Width ' or you should set higher time frame better:
You can change colors and transparency:
You can change Table location:
Alerts added :)
P.S. I haven't tested it so much, if you see any issue please drop a comment or send me message
Enjoy!

FunctionLAPACKdsyrkLibrary "FunctionLAPACKdsyrk"
subroutine part of LAPACK: Linear Algebra Package,
performs one of the symmetric rank k operations
.
C := alpha*A*A**T + beta*C, or C := alpha*A**T*A + beta*C,
.
where alpha and beta are scalars, C is an n by n symmetric matrix
and A is an n by k matrix in the first case and a k by n matrix
in the second case.
.
reference:
netlib.org
dsyrk(uplo, trans, n, k, alpha, a, lda, beta, c, ldc)
performs one of the symmetric rank k operations
.
C := alpha*A*A**T + beta*C, or C := alpha*A**T*A + beta*C,
.
where alpha and beta are scalars, C is an n by n symmetric matrix
and A is an n by k matrix in the first case and a k by n matrix
in the second case.
.
Parameters:
uplo : string specifies whether the upper or lower triangular part of
the array C is to be referenced as follows:
UPLO = 'U' or 'u' Only the upper triangular part of C is to be referenced.
UPLO = 'L' or 'l' Only the lower triangular part of C is to be referenced.
.
trans : string specifies the operation to be performed as follows:
TRANS = 'N' or 'n' C := alpha*A*A**T + beta*C.
TRANS = 'T' or 't' C := alpha*A**T*A + beta*C.
TRANS = 'C' or 'c' C := alpha*A**T*A + beta*C.
.
n : int specifies the order of the matrix C. N must be at least zero.
k : int On entry with:
TRANS = 'N' or 'n', K specifies the number of columns of the matrix A.
TRANS = 'T' or 't' or 'C' or 'c', K specifies the number of rows of the matrix A.
K must be at least zero.
.
alpha : float scalar.
a : matrix matrix A.
lda : int specifies the first dimension of A.
beta : float scalar.
c : matrix matrix C, is overwritten by the lower triangular part of the updated matrix.
ldc : int specifies the first dimension of C
Returns: void, C is overwritten by the lower triangular part of the updated matrix.

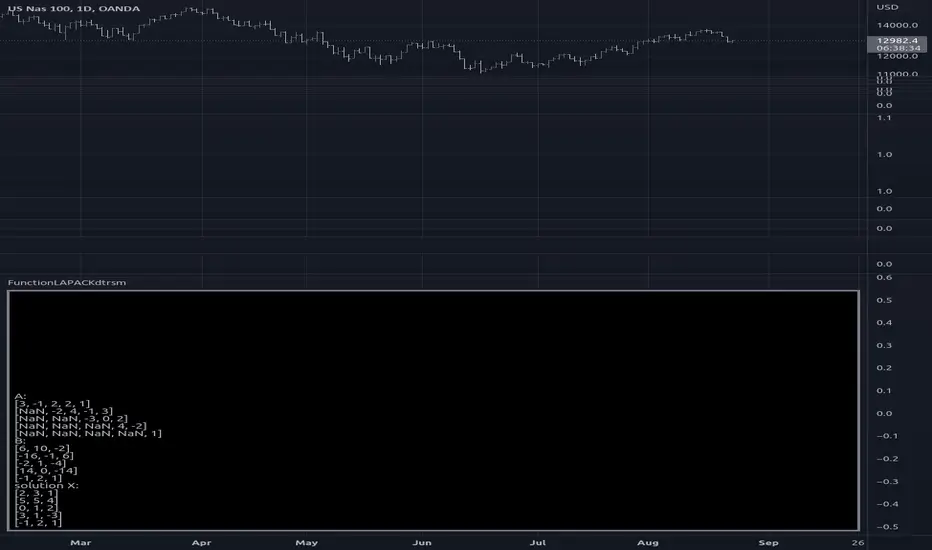
FunctionLAPACKdtrsmLibrary "FunctionLAPACKdtrsm"
subroutine in the LAPACK:linear algebra package, used to solve one of the following matrix equations:
op( A )*X = alpha*B, or X*op( A ) = alpha*B,
where alpha is a scalar, X and B are m by n matrices, A is a unit, or
non-unit, upper or lower triangular matrix and op( A ) is one of
op( A ) = A or op( A ) = A**T.
The matrix X is overwritten on B.
reference:
netlib.org
dtrsm(side, uplo, transa, diag, m, n, alpha, a, lda, b, ldb)
solves one of the matrix equations
op( A )*X = alpha*B, or X*op( A ) = alpha*B,
where alpha is a scalar, X and B are m by n matrices, A is a unit, or
non-unit, upper or lower triangular matrix and op( A ) is one of
op( A ) = A or op( A ) = A**T.
The matrix X is overwritten on B.
Parameters:
side : string , On entry, SIDE specifies whether op( A ) appears on the left or right of X as follows:
SIDE = 'L' or 'l' op( A )*X = alpha*B.
SIDE = 'R' or 'r' X*op( A ) = alpha*B.
uplo : string , specifies whether the matrix A is an upper or lower triangular matrix as follows:
UPLO = 'U' or 'u' A is an upper triangular matrix.
UPLO = 'L' or 'l' A is a lower triangular matrix.
transa : string , specifies the form of op( A ) to be used in the matrix multiplication as follows:
TRANSA = 'N' or 'n' op( A ) = A.
TRANSA = 'T' or 't' op( A ) = A**T.
TRANSA = 'C' or 'c' op( A ) = A**T.
diag : string , specifies whether or not A is unit triangular as follows:
DIAG = 'U' or 'u' A is assumed to be unit triangular.
DIAG = 'N' or 'n' A is not assumed to be unit triangular.
m : int , the number of rows of B. M must be at least zero.
n : int , the number of columns of B. N must be at least zero.
alpha : float , specifies the scalar alpha. When alpha is zero then A is not referenced and B need not be set before entry.
a : matrix, Triangular matrix.
lda : int , specifies the first dimension of A.
b : matrix, right-hand side matrix B, and on exit is overwritten by the solution matrix X.
ldb : int , specifies the first dimension of B.
Returns: void, modifies matrix b.
usage:
dtrsm ('L', 'U', 'N', 'N', 5, 3, 1.0, a, 7, b, 6)
Correlation with Matrix TableCorrelation coefficient is a measure of the strength of the relationship between two values. It can be useful for market analysis, cryptocurrencies, forex and much more.
Since it "describes the degree to which two series tend to deviate from their moving average values" (1), first of all you have to set the length of these moving averages. You can also retrieve the values from another timeframe, and choose whether or not to ignore the gaps.
After selecting the reference ticker, which is not dependent from the chart you are on, you can choose up to eight other tickers to relate to it. The provided matrix table will then give you a deeper insight through all of the correlations between the chosen symbols.
Correlation values are scored on a scale from 1 to -1
A value of 1 means the correlation between the values is perfect.
A value of 0 means that there is no correlation at all.
A value of -1 indicates that the correlation is perfectly opposite.
For a better view at a glance, eight level colors are available and it is possible to modify them at will. You can even change level ranges by setting their threshold values. The background color of the matrix's cells will change accordingly to all of these choices.
The default threshold values, commonly used in statistics, are as follows:
None to weak correlation: 0 - 0.3
Weak to moderate correlation: 0.3 - 0.5
Moderate to high correlation: 0.5 - 0.7
High to perfect correlation: 0.7 - 1
Remember to be careful about spurious correlations, which are strong correlations without a real causal relationship.
(1) www.tradingview.com

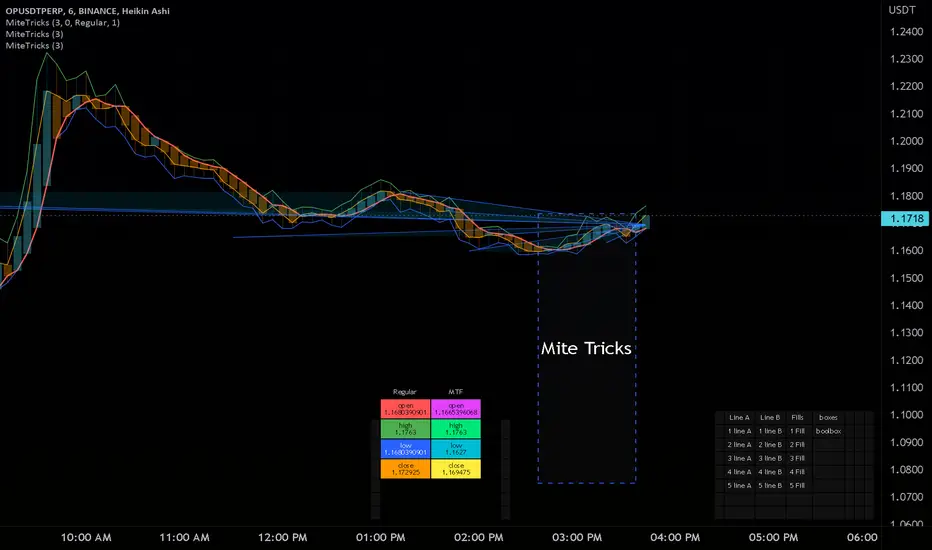
MiteTricksLibrary "MiteTricks"
Matrix Global Registry.
Get, Set, automatic growing, universal get/set,
multi-matrix dictionaries, multi-dictionary matrixes..
add slice matrixes of any type, share one common global key registry
pull up an item from a category, and item name ie a table of info.
same cell needs a color, a size, a string, a value, etc..
all of which can be pulled up with the same group id, and key id.
just swap which matrix you pull the value from.
this has a side benefit of non-repainting and recalculating
when pulling values, changing inputs..
makes for very fast/clean usage..
benefit :
floats = value
strings = names
lines = drawn items
table =table of data items for this key
colors = color for line/table/fill,label..
all of those can be pulled with "get(_VALUES,_groupIDX,_keyIDX)" where only the values matrix needs be swapped, and the same item/coordinates remains for all the possible matrixes that item appears in.
also useful as a dictionary/registry for any given type of item,,
and goes very handy with floats/strings/colors/bools with my matrixautotable
very helpful when prototyping or doing development work as a shortcut.
initRegistry()
Registry inititalizer
Returns: registry of string matrix type
newbool(optional, optional, optional)
create bool type new matrix presized 2x2 for reg
Parameters:
optional: row size
optional: column size
optional: fill value(default is bool (na)
Returns: bool matrix of specified size and fill, or blank 2x2 for registry use
newbox(optional, optional, optional)
create box type new matrix presized 2x2 for reg
Parameters:
optional: row size
optional: column size
optional: fill value(default is box (na)
Returns: box matrix of specified size and fill, or blank 2x2 for registry use
newcolor(optional, optional, optional)
create color type new matrix presized 2x2 for reg
Parameters:
optional: row size
optional: column size
optional: fill value(default is color (na)
Returns: color matrix of specified size and fill, or blank 2x2 for registry use
newfloat(optional, optional, optional)
create float type new matrix presized 2x2 for reg
Parameters:
optional: row size
optional: column size
optional: fill value(default is float (na)
Returns: float matrix of specified size and fill, or blank 2x2 for registry use
newint(optional, optional, optional)
create int type new matrix presized 2x2 for reg
Parameters:
optional: row size
optional: column size
optional: fill value(default is int (na)
Returns: int matrix of specified size and fill, or blank 2x2 for registry use
newlabel(optional, optional, optional)
create label type new matrix presized 2x2 for reg
Parameters:
optional: row size
optional: column size
optional: fill value(default is label (na)
Returns: label matrix of specified size and fill, or blank 2x2 for registry use
newline(optional, optional, optional)
create line type new matrix presized 2x2 for reg
Parameters:
optional: row size
optional: column size
optional: fill value(default is line (na)
Returns: line matrix of specified size and fill, or blank 2x2 for registry use
newlinefill(optional, optional, optional)
create linefill type new matrix presized 2x2 for reg
Parameters:
optional: row size
optional: column size
optional: fill value(default is linefill(na)
Returns: linefill matrix of specified size and fill, or blank 2x2 for registry use
newstring(optional, optional, optional)
create string type new matrix presized 2x2 for reg
Parameters:
optional: row size
optional: column size
optional: fill value(default is string (na)
Returns: string matrix of specified size and fill, or blank 2x2 for registry use
newtable(optional, optional, optional)
create table type new matrix presized 2x2 for reg
Parameters:
optional: row size
optional: column size
optional: fill value(default is table (na)
Returns: table matrix of specified size and fill, or blank 2x2 for registry use
newfrom(INIT_FILL)
newfrom Matrix full of item input
Parameters:
INIT_FILL: item to fill (2x2) the matri and set type. a type(na) works
addrow(m, v)
addrow Add new row to matrix
Parameters:
m: matrix of type being added to
v: value of type being added to ( best leave NA on string for registry purposes)
addcolumn(matrix, value)
addcolumn
Parameters:
matrix: of type being added to
value: of type being added to ( best leave NA on string for registry purposes)
get(_VALS, _KEYREG, _GROUP, _KEY)
get Grabs value and returns single item
Parameters:
_VALS: Matrix Values slice
_KEYREG: Registry values matrix (strings)
_GROUP: name of group/category or int group key
_KEY: name of item to fetch from value registry or int key id
Returns: item
get(_VALS, _GROUP, _KEY)
get Grabs value and returns single item
Parameters:
_VALS: Matrix Values slice
_GROUP: name of group/category
_KEY: name of item to fetch from value registry
getgid(_KEYREG, _GROUP)
getgid
Parameters:
_KEYREG: Reg to pull group id from
_GROUP: group index int, or string name to get the other missing type
getkid(_KEYREG, _GROUP, _KEY)
getkid
Parameters:
_KEYREG: Reg to pull Key id from
_GROUP: group index int, or string name
_KEY: index of string key id to get it's ID int
getkey(_KEYREG, _GROUP, _KEY)
getkey
Parameters:
_KEYREG: Reg to pull Key id from
_GROUP: group index int, or string name for getting key string
_KEY: index of string key id to get it's match of other type
set(_VALS, _KEYREG, _GROUP, _KEY, _value)
set items to reg and matrix container
Parameters:
_VALS: Values matrix container
_KEYREG: Key registry
_GROUP: (string) Group/Category name
_KEY: (string) Key for item
_value: item
Returns: void
del(_VALS, _KEYREG, _GROUP, _KEY)
del grroup id
Parameters:
_VALS: Matrix Values slice
_KEYREG: Registry values matrix (strings)
_GROUP: name of group/category
_KEY: name of item to Delete from values and key
detached(_GROUP, _KEY, _VALUE)
detached make detached registry/val matrix
Parameters:
_GROUP: Name of first group
_KEY: Name of first item
_VALUE: Item of any type, sets the output type too.
Greater Currency Correlation Matrix (Forex)Other available matrixes I found have a limited number of forex symbols. Consequentially, you need to keep switching them if you want to do a proper analysis. As a result of that, I produced my own currency matrix.
Correlation studies relationships between different price charts.
High correlation may be completely random in the short term, but it may signify a fundamental relationship between the two symbols if calculated over the long term.
For example, the currency of an oil-producing country may rally along with oil, whereas the importer's currency may drop. This means that watching the oil price chart may be worth it for such pairs.
The script includes all Major and Minor pairs with the addition of Gold (XAUEUR) and two optional symbols.
▬▬▬▬
To avoid too frequent use of security(), I decided to calculate all symbol values from EUR pairs. It should improve performance and keep room for some additional symbols in the future.
Please report any bugs.
functionStringToMatrixLibrary "functionStringToMatrix"
Provides unbound methods (no error checking) to parse a string into a float or int matrix.
to_matrix_float(str, interval_sep, start_tk, end_tk)
Parse a string into a float matrix.
Parameters:
str : , string, the formated string to parse.
interval_sep : , string, cell interval separator token.
start_tk : , string, row start token.
end_tk : , string, row end token.
Returns: matrix, parsed float matrix.
to_matrix_int(str, interval_sep, start_tk, end_tk)
Parse a string into a int matrix.
Parameters:
str : , string, the formated string to parse.
interval_sep : , string, cell interval separator token.
start_tk : , string, row start token.
end_tk : , string, row end token.
Returns: matrix, parsed int matrix.

"Swap" - Bool/Position/Value : Array / Matrix / Var AutoswapLibrary "swap"
Side / Boundary Based All Types Swapper
- three automagical types for Arrays, Matrixes, and Variables
-- no signal : Long/ Short position autoswap
-- true / false : Boolean based side choice
-- Src / Thresh : if source is above or below the threshold
- two operating modes for variables, Holding mode only for arrays/matrixes
-- with two items, will automatically change between the two caveat is it does not delete table/box/line(fill VAR items automatically)
-- with three items, a neutral is available for NA input or neutral
- one function name for all of them. One import name that's easy to type/remember
-- make life easy for your conditional items.
side(source, thresh, _a, _b, _c)
side Change outputs based on position or a crossing level
Parameters:
source : (float) OPTIONAL value input
thresh : (float) OPTIONAL boundary line to cross
_a : (any) if Long/True/Above
_b : (any) if Short/False/Below
_c : (any) OPTIONAL NOT FOR MTX OR ARR... Neutral Item, if var/varip on a/b it will leave behind, ie, a table or box or line will not erase , if it's a varip you're sending in.
Returns: first, second, or third items based on input conditions
Please notify if bugs found.
Thanks.

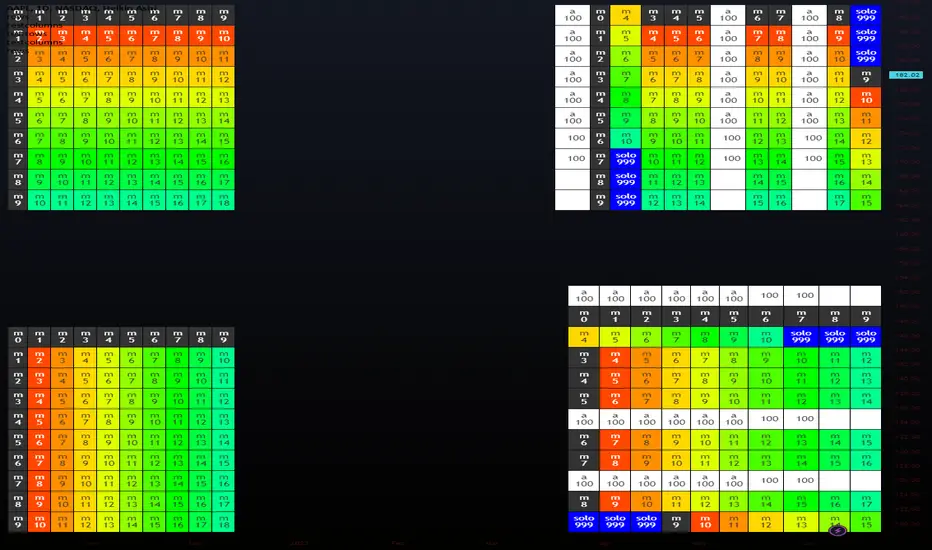
[LIB] Array / Matrix DisplayLibrary "ArrayMatrixHUD"
Show Array or Matrix Elements In Table
For Arrays: Set the number of rows you want the data displayed in and it will generate a table, calculating the columns based on the size of the array being displayed.
For Matrix: It will automatically match the Rows and Columns to the values in the matrix.
Note: On the left, the table shows the index of the array/matrix value starting at 1. So, to call that value from inside the array, subtract 1 from the index value to the left. For matrices, keep in mind that the row and column are also starting at one when trying to call a value from the matrix. The numbering of the values on the left is for display purposes only.
viewArray(_arrayName, _pos, _txtSize, _tRows)
Array Element Display (Supports float, int, string, and bool)
Parameters:
_arrayName : ID of Array to be Displayed
_pos : Position for Table
_txtSize : Size of Table Cell Text
_tRows : Number of Rows to Display Data In (columns will be calculated accordingly)
Returns: A Display of Array Values in a Table
viewMatrix(_matrixName, _pos, _txtSize)
Matrix Element Display (Supports float, int, string, and bool)
Parameters:
_matrixName : ID of Matrix to be Displayed
_pos : Position for Table
_txtSize : Size of Table Cell Text
Returns: A Display of Matrix Values in a Table

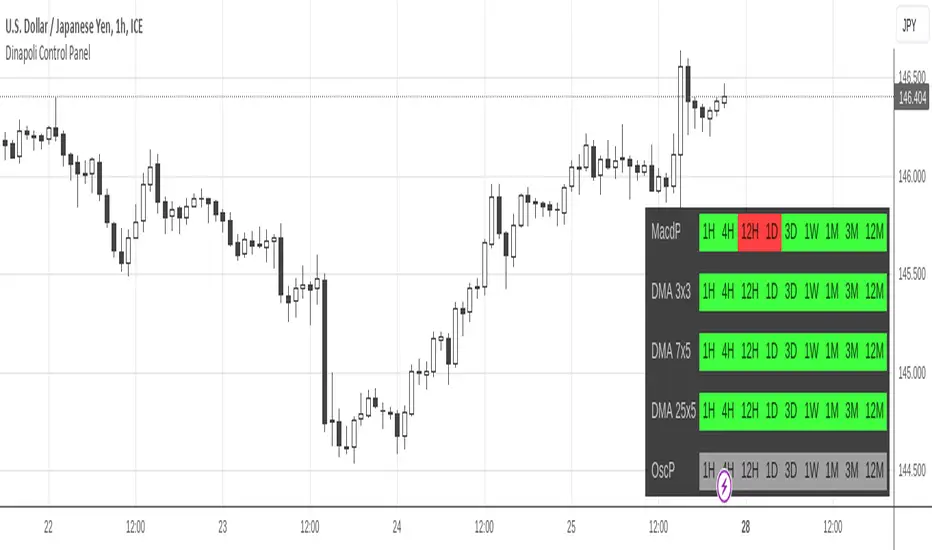
DiNapoli Control PanelThis indicator displays a matrix containing a customized set of Dinapoli indicator readings from Higher Timeframes. It works as a Control Panel to properly monitor multiple layers of the market at an eye glance.
It's capable of displaying any combination of data, from a brief light panel to a full data table summarizing all relevant Dinapoli Indicators.
Only Higher Timeframes states do appear in the table. Lower Timeframes are hidden due to inability to get reliable results for such behaviour in current Tradingview environment.
By default only 5 timeframes get activated: 1H, 4H, 1D, 1W and 1M. But many more are available to be displayed throught the Input Tab.
The position of the table can be customized through the input panel.
Note: The indicator is resource hungry, and sometimes it might need some seconds to fully populate the table.
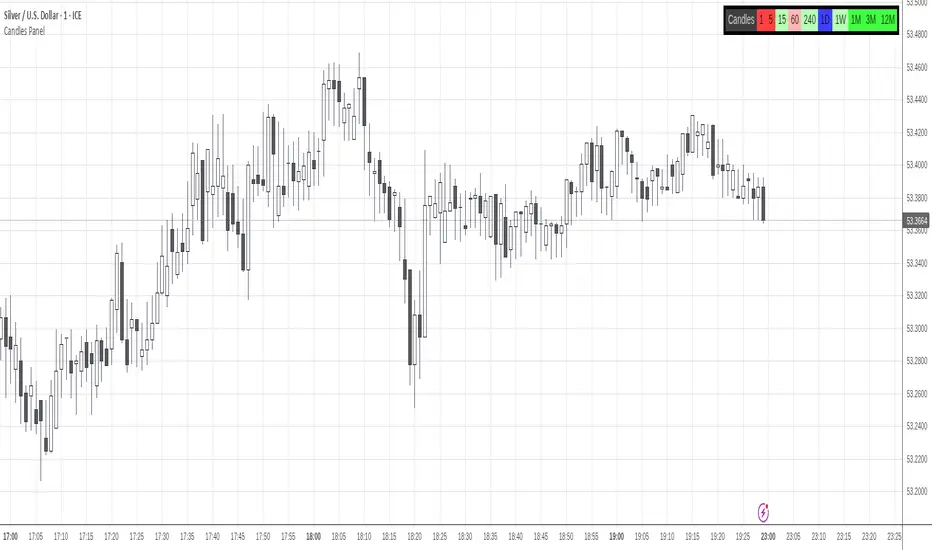
DiNapoli Candles TableThis indicator displays a matrix containing the color states of Dinapoli candles from Higher Timeframes.
Only Higher Timeframes states do appear in the table. Lower Timeframes are hidden due to inability to get reliable results for such behaviour in current Tradingview environment.
By default only 5 timeframes get activated: 1H, 4H, 1D, 1W and 1M. But many more are available to be displayed throught the Input Tab.
The position of the table can be customized through the input panel.
Note: The indicator is resource hungry, and sometimes it might need some seconds to fully populate the table.
matrixautotableLibrary "matrixautotable"
Automatic Table from Matrixes with pseudo correction for na values and default color override for missing values. uses overloads in cases of cheap float only, with additional addon for strings next, then cell colors, then text colors, and tooltips last.. basic size and location are auto, include the template to speed this up...
TODO : make bools version
var string group_table = ' Table'
var int _tblssizedemo = input.int ( 10 )
string tableYpos = input.string ( 'middle' , '↕' , inline = 'place' , group = group_table, options= )
string tableXpos = input.string ( 'center' , '↔' , inline = 'place' , group = group_table, options= , tooltip='Position on the chart.')
int _textSize = input.int ( 1 , 'Table Text Size' , inline = 'place' , group = group_table)
var matrix _floatmatrix = matrix.new (_tblssizedemo, _tblssizedemo, 0 )
var matrix _stringmatrix = matrix.new (_tblssizedemo, _tblssizedemo, 'test' )
var matrix _bgcolormatrix = matrix.new (_tblssizedemo, _tblssizedemo, color.white )
var matrix _textcolormatrix = matrix.new (_tblssizedemo, _tblssizedemo, color.black )
var matrix _tooltipmatrix = matrix.new (_tblssizedemo, _tblssizedemo, 'tool' )
// basic table ready to go with the aboec matrixes (replace in your code)
// for demo purpose, random colors, random nums, random na vals
if barstate.islast
varip _xsize = matrix.rows (_floatmatrix) -1
varip _ysize = matrix.columns (_floatmatrix) -1
for _xis = 0 to _xsize -1 by 1
for _yis = 0 to _ysize -1 by 1
_randomr = int(math.random(50,250))
_randomg = int(math.random(50,250))
_randomb = int(math.random(50,250))
_randomt = int(math.random(10,90 ))
bgcolor = color.rgb(250 - _randomr, 250 - _randomg, 250 - _randomb, 100 - _randomt )
txtcolor = color.rgb(_randomr, _randomg, _randomb, _randomt )
matrix.set(_bgcolormatrix ,_yis,_xis, bgcolor )
matrix.set(_textcolormatrix ,_yis,_xis, txtcolor)
matrix.set(_floatmatrix ,_yis,_xis, _randomr)
// random na
_ymiss = math.floor(math.random(0, _yis))
_xmiss = math.floor(math.random(0, _xis))
matrix.set( _floatmatrix ,_ymiss, _xis, na)
matrix.set( _stringmatrix ,_ymiss, _xis, na)
matrix.set( _bgcolormatrix ,_ymiss, _xis, na)
matrix.set( _textcolormatrix ,_ymiss, _xis, na)
matrix.set( _tooltipmatrix ,_ymiss, _xis, na)
// import here
import kaigouthro/matrixautotable/1 as mtxtbl
// and render table..
mtxtbl.matrixtable(_floatmatrix, _stringmatrix, _bgcolormatrix, _textcolormatrix, _tooltipmatrix, _textSize ,tableYpos ,tableXpos)
matrixtable(_floatmatrix, _stringmatrix, _bgcolormatrix, _textcolormatrix, _tooltipmatrix, _textSize, tableYpos, tableXpos) matrixtable
Parameters:
_floatmatrix : float vals
_stringmatrix : string
_bgcolormatrix : color
_textcolormatrix : color
_tooltipmatrix : string
_textSize : int
tableYpos : string
tableXpos : string
matrixtable(_floatmatrix, _stringmatrix, _bgcolormatrix, _textcolormatrix, _textSize, tableYpos, tableXpos) matrixtable
Parameters:
_floatmatrix : float vals
_stringmatrix : string
_bgcolormatrix : color
_textcolormatrix : color
_textSize : int
tableYpos : string
tableXpos : string
matrixtable(_floatmatrix, _stringmatrix, _bgcolormatrix, _txtdefcol, _textSize, tableYpos, tableXpos) matrixtable
Parameters:
_floatmatrix : float vals
_stringmatrix : string
_bgcolormatrix : color
_txtdefcol : color
_textSize : int
tableYpos : string
tableXpos : string
matrixtable(_floatmatrix, _stringmatrix, _txtdefcol, _bgdefcol, _textSize, tableYpos, tableXpos) matrixtable
Parameters:
_floatmatrix : float vals
_stringmatrix : string
_txtdefcol : color
_bgdefcol : color
_textSize : int
tableYpos : string
tableXpos : string
matrixtable(_floatmatrix, _txtdefcol, _bgdefcol, _textSize, tableYpos, tableXpos) matrixtable
Parameters:
_floatmatrix : float vals
_txtdefcol : color
_bgdefcol : color
_textSize : int
tableYpos : string
tableXpos : string

Morningstar Equity Style Box HeatmapStyle boxes are a classification scheme created by Morningstar. They visually provide a graphical representation of investing categories for equity investments. A style box is a valuable tool for investors to use when determining asset allocation.
There are 9 categories:
Large Value, Large Blend, Large Growth
Medium Value, Medium Blend, Medium Growth
Small Value, Small Blend, Small Growth
The strength of the 9 categories are found by using 9 Vanguard ETF's that follow the respective CRSP index of their category.

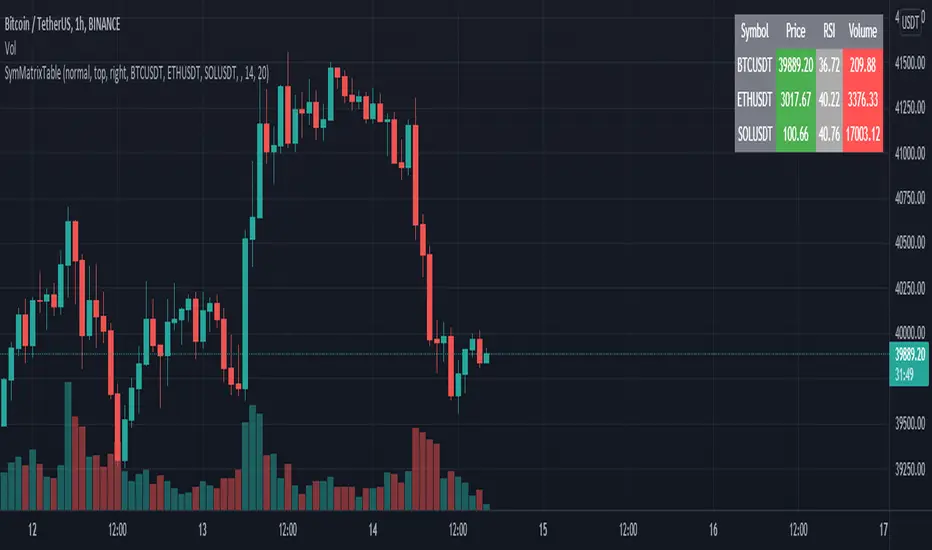
SymMatrixTableSimple Example Table for Displaying Price, RSI, Volume of multiple Tickers on selected Timeframe
Displays Price, RSI and Volume of 3 Tickers and Timeframe selected by user input
Conditional Table Cell coloring
Price color green if > than previous candle close and red if < previous candle close
RSI color green if < 30 and red if > 70 (RSI14 by default)
Volume color green if above average volume and red if less than that (SMA20 volume by default)
Can turn on/off whole table, header columns, row indices, or select individual columns or rows to show/hide
// Example Mixed Type Matrix To Table //
access the simple example script by uncommenting the code at the end
Basically I wanted to have the headers and indices as strings and the rest of the matrix for the table body as floats, then conditional coloring on the table cells
And also the functionality to turn rows and columns on/off from table through checkboxes of user input
Before I was storing each of the values separately in arrays that didn't have a centralized way of controlling table structure
so now the structure is :
- string header array, string index array
- float matrix for table body
- color matrix with bool conditions for coloring table cells
- bool checkboxes for controlling table display
Reshape Table Matrix█ OVERVIEW
Simple method to reshape matrix to table.
Credits to Tradingview for new matrix update.

US Stock Market Sectors Overview Table [By MUQWISHI]US Market Overview Table will identify the bullish and bearish sectors of a day by tracking the SPDR sectors funds.
It's possible to add a ticker symbol for correlation compared to each sector.
Overview Indicator

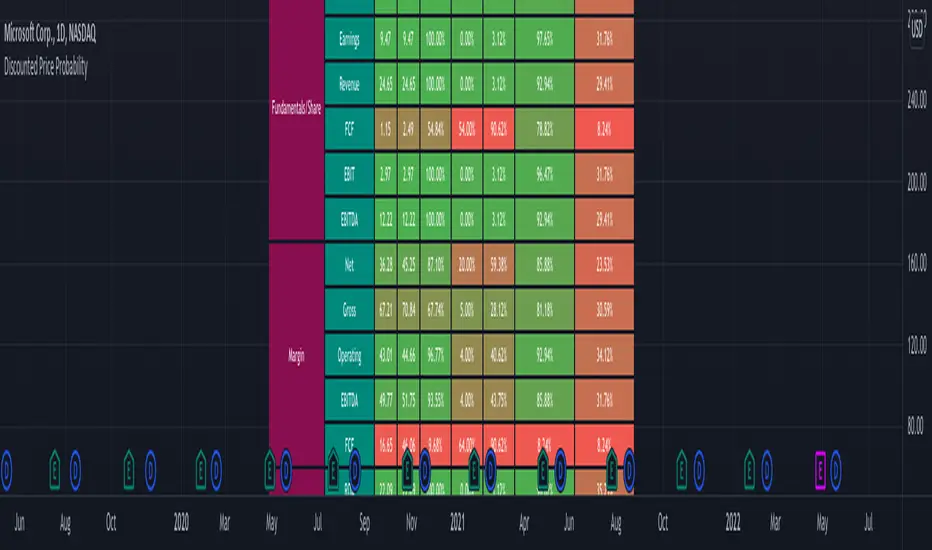
Discounted Price ProbabilityHere is an attempt to understand the probability of discounted price of a stock by comparing it to historical price and fundamental correlation. Have made use of some of the new features of pine in developing this script (Such as matrix and new features of tables such as cell merge and tooltip).
Script makes use of the library written on matrix matrix
🎲 Process
Probability is measured in two angles
🎯 Absolute : Measure the percentile of price and fundamentals with respect to all time high. The difference between the two is measure of probability of stock being undervalued.
🎯 Drawdown : Measure the percentile of distance from all time high for both price and fundamentals. The difference between the two is used for depicting the probability of stock being undervalued.
🎲 Components
In short, the definitions of stats presented are as below
🎲 Settings
Settings are pretty straightforward
🎲 How to look at these stats
To Start with
Are most of the fundamental values coloured in green? If yes, it means that they are near all time high in terms of percentile.
If drawdowns of fundamental values coloured in green? If yes, it means, the stock has not suffered much drawdowns of fundamentals from its peak.
Are the percentile values of drawdowns in green? If yes, it means, that drop in fundamentals are not high compared to its previous values.
If all the above are greener, then it means, company is in strong growth space.
Example: TSLA
Even though the financial ratios of TSLA are not in par with most of the fundamentally strong stocks, it is indeed growing steadily and at its near all time high.
Lets take another example of NKLA
Here the base columns regarding fundamentals are mostly red. This means, company has suffered setback with respect to their financials and the company is not where it used to be. But, if you see the differential probabilities, it says 92% of being undervalued?
Well, this is due to the fact that NKLA's fundamentals suffered most of the time and they are always below par when compared to price. Hence, such kind of cases may interpret the stocks as undervalued. Hence, even if the probability of being undervalued is more, it does not guarantee the quality of the stock. We need to be mindful overall financials of the company and how they fare with general standards.
Moving forward
To understand value of trending stock, use Absolute Probability (marked with P). Ex. GOOG, MSFT, BRK.B etc.
To understand value of stock which has been recently suffered huge price drop, look at drawdown based probability (marked with D). Ex. BABA, FB, PYPL, SQ, ROKU etc.
Some examples of high flyers:
Some for deep pullbacks:
And the meme stocks:
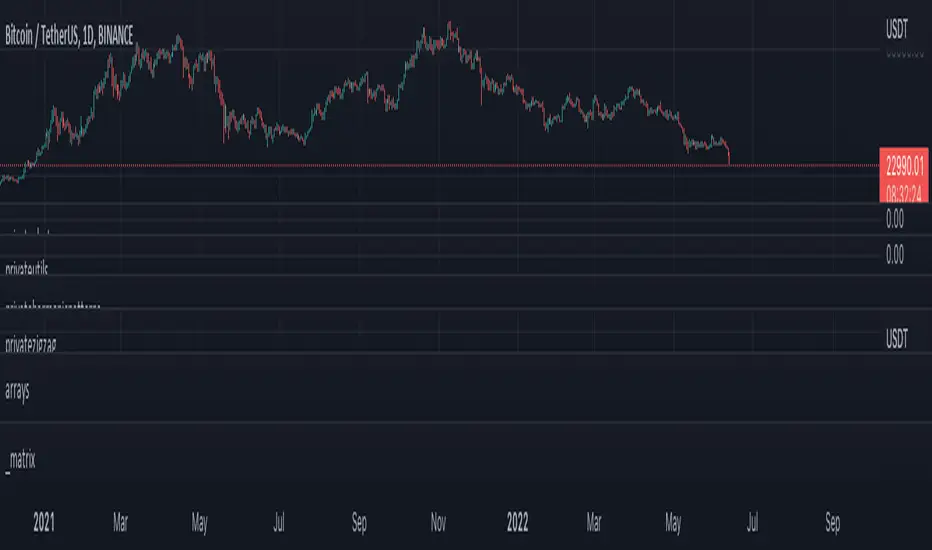
_matrixLibrary "_matrix"
Library helps visualize matrix as array of arrays and enables users to use array methods such as push, pop, shift, unshift etc along with cleanup activities on drawing objects wherever required
unshift(mtx, row) unshift array of lines to first row of the matrix
Parameters:
mtx : matrix of lines
row : array of lines to be inserted in row
Returns: resulting matrix of lines
unshift(mtx, row) unshift array of labels to first row of the matrix
Parameters:
mtx : matrix of labels
row : array of labels to be inserted in row
Returns: resulting matrix labels
unshift(mtx, row) unshift array of boxes to first row of the matrix
Parameters:
mtx : matrix of boxes
row : array of boxes to be inserted in row
Returns: resulting matrix of boxes
unshift(mtx, row) unshift array of linefill to first row of the matrix
Parameters:
mtx : matrix of linefill
row : array of linefill to be inserted in row
Returns: resulting matrix of linefill
unshift(mtx, row) unshift array of tables to first row of the matrix
Parameters:
mtx : matrix of tables
row : array of tables to be inserted in row
Returns: resulting matrix of tables
unshift(mtx, row) unshift array of int to first row of the matrix
Parameters:
mtx : matrix of int
row : array of int to be inserted in row
Returns: resulting matrix of int
unshift(mtx, row) unshift array of float to first row of the matrix
Parameters:
mtx : matrix of float
row : array of float to be inserted in row
Returns: resulting matrix of float
unshift(mtx, row) unshift array of bool to first row of the matrix
Parameters:
mtx : matrix of bool
row : array of bool to be inserted in row
Returns: resulting matrix of bool
unshift(mtx, row) unshift array of string to first row of the matrix
Parameters:
mtx : matrix of string
row : array of string to be inserted in row
Returns: resulting matrix of string
unshift(mtx, row) unshift array of color to first row of the matrix
Parameters:
mtx : matrix of colors
row : array of colors to be inserted in row
Returns: resulting matrix of colors
push(mtx, row) push array of lines to end of the matrix row
Parameters:
mtx : matrix of lines
row : array of lines to be inserted in row
Returns: resulting matrix of lines
push(mtx, row) push array of labels to end of the matrix row
Parameters:
mtx : matrix of labels
row : array of labels to be inserted in row
Returns: resulting matrix of labels
push(mtx, row) push array of boxes to end of the matrix row
Parameters:
mtx : matrix of boxes
row : array of boxes to be inserted in row
Returns: resulting matrix of boxes
push(mtx, row) push array of linefill to end of the matrix row
Parameters:
mtx : matrix of linefill
row : array of linefill to be inserted in row
Returns: resulting matrix of linefill
push(mtx, row) push array of tables to end of the matrix row
Parameters:
mtx : matrix of tables
row : array of tables to be inserted in row
Returns: resulting matrix of tables
push(mtx, row) push array of int to end of the matrix row
Parameters:
mtx : matrix of int
row : array of int to be inserted in row
Returns: resulting matrix of int
push(mtx, row) push array of float to end of the matrix row
Parameters:
mtx : matrix of float
row : array of float to be inserted in row
Returns: resulting matrix of float
push(mtx, row) push array of bool to end of the matrix row
Parameters:
mtx : matrix of bool
row : array of bool to be inserted in row
Returns: resulting matrix of bool
push(mtx, row) push array of string to end of the matrix row
Parameters:
mtx : matrix of string
row : array of string to be inserted in row
Returns: resulting matrix of string
push(mtx, row) push array of colors to end of the matrix row
Parameters:
mtx : matrix of colors
row : array of colors to be inserted in row
Returns: resulting matrix of colors
shift(mtx) shift removes first row from matrix of lines
Parameters:
mtx : matrix of lines from which the shift operation need to be performed
Returns: void
shift(mtx) shift removes first row from matrix of labels
Parameters:
mtx : matrix of labels from which the shift operation need to be performed
Returns: void
shift(mtx) shift removes first row from matrix of boxes
Parameters:
mtx : matrix of boxes from which the shift operation need to be performed
Returns: void
shift(mtx) shift removes first row from matrix of linefill
Parameters:
mtx : matrix of linefill from which the shift operation need to be performed
Returns: void
shift(mtx) shift removes first row from matrix of tables
Parameters:
mtx : matrix of tables from which the shift operation need to be performed
Returns: void
shift(mtx) shift removes first row from matrix of int
Parameters:
mtx : matrix of int from which the shift operation need to be performed
Returns: void
shift(mtx) shift removes first row from matrix of float
Parameters:
mtx : matrix of float from which the shift operation need to be performed
Returns: void
shift(mtx) shift removes first row from matrix of bool
Parameters:
mtx : matrix of bool from which the shift operation need to be performed
Returns: void
shift(mtx) shift removes first row from matrix of string
Parameters:
mtx : matrix of string from which the shift operation need to be performed
Returns: void
shift(mtx) shift removes first row from matrix of colors
Parameters:
mtx : matrix of colors from which the shift operation need to be performed
Returns: void
pop(mtx) pop removes last row from matrix of lines
Parameters:
mtx : matrix of lines from which the pop operation need to be performed
Returns: void
pop(mtx) pop removes last row from matrix of labels
Parameters:
mtx : matrix of labels from which the pop operation need to be performed
Returns: void
pop(mtx) pop removes last row from matrix of boxes
Parameters:
mtx : matrix of boxes from which the pop operation need to be performed
Returns: void
pop(mtx) pop removes last row from matrix of linefill
Parameters:
mtx : matrix of linefill from which the pop operation need to be performed
Returns: void
pop(mtx) pop removes last row from matrix of tables
Parameters:
mtx : matrix of tables from which the pop operation need to be performed
Returns: void
pop(mtx) pop removes last row from matrix of int
Parameters:
mtx : matrix of int from which the pop operation need to be performed
Returns: void
pop(mtx) pop removes last row from matrix of float
Parameters:
mtx : matrix of float from which the pop operation need to be performed
Returns: void
pop(mtx) pop removes last row from matrix of bool
Parameters:
mtx : matrix of bool from which the pop operation need to be performed
Returns: void
pop(mtx) pop removes last row from matrix of string
Parameters:
mtx : matrix of string from which the pop operation need to be performed
Returns: void
pop(mtx) pop removes last row from matrix of colors
Parameters:
mtx : matrix of colors from which the pop operation need to be performed
Returns: void
clear(mtx) clear clears the matrix of lines
Parameters:
mtx : matrix of lines which needs to be cleared
Returns: void
clear(mtx) clear clears the matrix of labels
Parameters:
mtx : matrix of labels which needs to be cleared
Returns: void
clear(mtx) clear clears the matrix of boxes
Parameters:
mtx : matrix of boxes which needs to be cleared
Returns: void
clear(mtx) clear clears the matrix of linefill
Parameters:
mtx : matrix of linefill which needs to be cleared
Returns: void
clear(mtx) clear clears the matrix of tables
Parameters:
mtx : matrix of tables which needs to be cleared
Returns: void
clear(mtx) clear clears the matrix of int
Parameters:
mtx : matrix of int which needs to be cleared
Returns: void
clear(mtx) clear clears the matrix of float
Parameters:
mtx : matrix of float which needs to be cleared
Returns: void
clear(mtx) clear clears the matrix of bool
Parameters:
mtx : matrix of bool which needs to be cleared
Returns: void
clear(mtx) clear clears the matrix of string
Parameters:
mtx : matrix of string which needs to be cleared
Returns: void
clear(mtx) clear clears the matrix of colors
Parameters:
mtx : matrix of colors which needs to be cleared
Returns: void
FunctionMatrixSolveLibrary "FunctionMatrixSolve"
Matrix Equation solution for Ax = B, finds the value of x.
solve(A, B) Solves Matrix Equation for Ax = B, finds value for x.
Parameters:
A : matrix, Square matrix with data values.
B : matrix, One column matrix with data values.
Returns: matrix with X, x = A^-1 b, assuming A is square and has full rank
introcs.cs.princeton.edu
