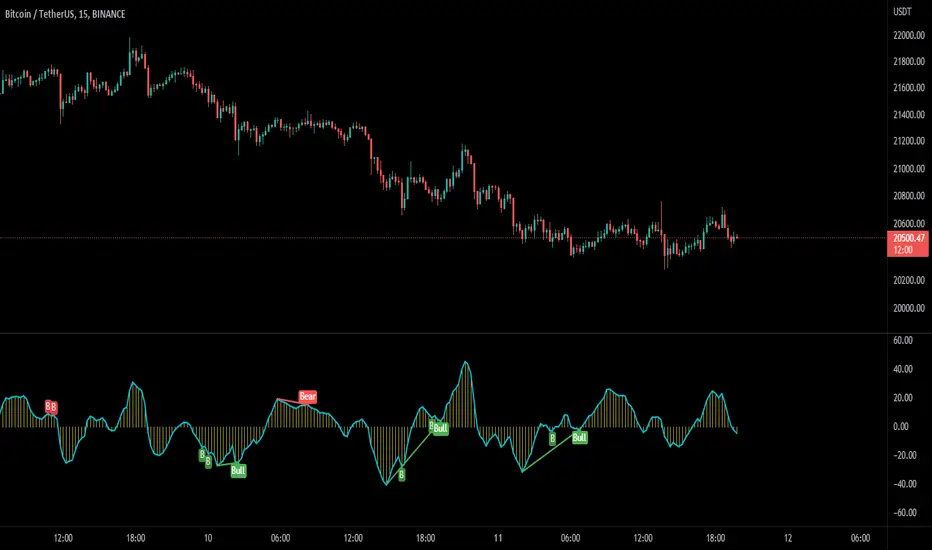
MACD Potential Divergence - FontiramisuIndicator showing potential momentum divergences on MACD Momentum.
The problem with the classic divergence is that when the signal appears, it is sometimes too late to enter a trade .
The potential divergence corrects this problem by signaling the beginning of a potential divergence .
MACD is a momentum indicator that offers relevant insights with divergences.
Potential divergences are indicated with the letter B and a red color for Bearish Div or Green color for Bullish Div .
Potential divergence is confirmed when the line and the label "Bear"' or "Bull" appear.
Macdsignal
SSL HYBRID AdvancedSSL HYBRID Advanced
SSL Hybrid is an Advanced version of the default SSL Hybrid by Mihkel00.
Multiple Indicators
MACD Crossover Signals
EMA 200
Bollinger Band
Bollinger Band Squeeze
ADX Crossover and ADX level
CCI Over Brought /Sold
Stochastic Over Brought /Sold
RSI Over Brought /Sold
CREDITS
QQE MOD byMihkel00
SSL Hybrid by Mihkel00
Waddah Attar Explosion by shayankm
Support Resistance LonesomeTheBlue
Indicators On Chart
QQE MOD is plotted as Dot below and above the candle and also as Background
QQE line is plotted and can be used as crossover to find trend. Flat movement of QQE is Sideways
Weak ADX is plotted as a Background color. Same can be verified using Bollinger band Squeeze.
EMA crossover can be plotted by selecting MTF MA(multi time frame moving average indicator) Area plot is provided.
CCI , Stochastic, RSI signals provided in the table option
WAE (volume indicator ) is shown in Table
EMA 200 is plotted and color Represents ADX level and direction. Plots on EMA 200 are ADX crossovers
MACD crossovers are represented by Triangles above and below Candles
Support Resistance levels are plotted (change settings)
Pivot Points are plotted (change settings)
Bollinger Bands Plotted
EMA 20 and EMA 50 plotted with AREA for additional confirmation
Buy: When the table option shows completely Blue signals in all indicators
Sell: When the table option shows completely Pink signals in all indicators
WARNING not recommended for lower time frames. Use at your own Risk.
Updates will be released shortly if any. please provide your suggestions to make it more functional indicator.

MACD-X Overlay, More Than MACD by DGTMoving Average Convergence Divergence – MACD
The most popular indicator used in technical analysis , the moving average convergence divergence ( MACD ), created by Gerald Appel. MACD is a trend-following momentum indicator , designed to reveal changes in the strength, direction, momentum, and duration of a trend in a financial instrument’s price
Historical evolution of MACD ,
- Gerald Appel created the MACD line,
- Thomas Aspray added the histogram feature to MACD
- Giorgos E. Siligardos created a leader of MACD
MACD employs two Moving Averages of varying lengths (which are lagging indicators) to identify trend direction and duration. Then, MACD takes the difference in values between those two Moving Averages (MACD Line) and an EMA of those Moving Averages (Signal Line) and plots that difference between the two lines as a histogram which oscillates above and below a center Zero Line. The histogram is used as a good indication of a security's momentum.
The MACD indicator is typically good for identifying three types of basic signals;
Signal Line Crossovers
A Signal Line Crossover is the most common signal produced by the MACD . On the occasions where the MACD Line crosses above or below the Signal Line, that can signify a potentially strong move. The standard interpretation of such an event is a recommendation to buy if the MACD line crosses up through the Signal Line (a "bullish" crossover), or to sell if it crosses down through the Signal Line (a "bearish" crossover). These events are taken as indications that the trend in the financial instrument is about to accelerate in the direction of the crossover.
Zero Line Crossovers
Zero Line Crossovers occur when the MACD Line crossed the Zero Line and either becomes positive (above 0) or negative (below 0). A change from positive to negative MACD is interpreted as "bearish", and from negative to positive as "bullish". Zero crossovers provide evidence of a change in the direction of a trend but less confirmation of its momentum than a signal line crossover
Divergence
Divergence is another signal created by the MACD . Simply, divergence occurs when the MACD and actual price are not in agreement. A "positive divergence" or "bullish divergence" occurs when the price makes a new low but the MACD does not confirm with a new low of its own. A "negative divergence" or "bearish divergence" occurs when the price makes a new high but the MACD does not confirm with a new high of its own. A divergence with respect to price may occur on the MACD line and/or the MACD Histogram
Moving Average Crossovers , another hidden signal that MACD Indicator identifies
Many traders will watch for a short-term moving average to cross above a longer-term moving average and use this to signal increasing upward momentum. This bullish crossover suggests that the price has recently been rising at a faster rate than it has in the past, so it is a common technical buy sign. Conversely, a short-term moving average crossing below a longer-term average is used to illustrate that the asset's price has been moving downward at a faster rate and that it may be a good time to sell.
Moving Average Crossovers in reality is Zero Line Crossovers, the value of the MACD indicator is equal to zero each time the two moving averages cross over each other. For easy interpretation by trades, Zero Line Crossovers are simply described as positive or negative MACD
False signals
Like any forecasting algorithm, the MACD can generate false signals. A false positive, for example, would be a bullish crossover followed by a sudden decline in a financial instrument. A false negative would be a situation where there is bearish crossover, yet the financial instrument accelerated suddenly upwards
What is “MACD-X” and Why it is “More Than MACD”
In its simples form, MACD-X implements variety of different calculation techniques applied to obtain MACD Line. Different calculation techniques lead to different values for MACD Line, as will further discuss below, and as a consequence the signal line and the histogram values will differentiate accordingly.
Main features of MACD-X ;
1- Plotting of the Oscillator presented on top of the price chart (main chart) and applicable on both log and linear scale. Maximum plotting length is limited to 250 bars
2- Introduces different proven techniques applied on MACD calculation, such as MACD-AS (Histogram), MACD-Leader and MACD-Source, besides the traditional MACD (MACD-TRADITIONAL)
• MACD-Traditional, by Gerald Appel
It is the MACD that we know, stated as traditional just to avoid confusion with other techniques used with this study
• MACD-Histogram, by Thomas Aspray
The MACD-Histogram measures the distance between MACD and its signal line (the 9-day EMA of MACD ). Aspray developed the MACD-Histogram to anticipate signal line crossovers in MACD . Because MACD uses moving averages and moving averages lag price, signal line crossovers can come late and affect the reward-to-risk ratio of a trade. Bullish or bearish divergences in the MACD-Histogram can alert chartists to an imminent signal line crossover in MACD
Aspray's contribution served as a way to anticipate (and therefore cut down on lag) possible MACD crossovers which are a fundamental part of the indicator.
• MACD-Leader, by Giorgos E. Siligardos, PhD
MACD Leader has the ability to lead MACD at critical situations. Almost all smoothing methods encounter in technical analysis are based on a relative-weighted sum of past prices, and the Leader is no exception. The concealed weights of MACD Leader are such that more relative weight is used in the more recent prices than the respective weights used by the components of MACD . In effect, the Leader expresses more changes in average price dynamics for the recent price movement than MACD , thus eventually leading MACD , especially when significant trend changes are about to take place.
• MACD-Source, a custom experimental interpretation of mine,
MACD Source, presents an application of MACD that evaluates Source/MA Ratio, relatively with less lag, as a basis for MACD Line, also can be expressed as source convergence/divergence to its moving average. Among the various techniques for removing the lag between price and moving average (MA) of the price, one in particular stands out: the addition to the moving average of a portion of the difference between the price and MA. MACD Source, is based on signal length mean of the difference between Source and average value of shot length and long length moving average of the source (Source/MA Ratio), where the source is actual value and hence no lag and relatively less lag with the average value of moving average of the source .
MACD Source provides relatively early crossovers comparing to MACD and better momentum direction indications, assuming the lengths are set to same values
3- Alerts presented for MACD and Signal Line Crosses both for Early Warning and Confirmed Crossovers
For more, You are kindly invited to have a look to other MACD or similar studies presented on separate pane
MACD-X, More Than MACD by DGT , P-MACD by DGT and Price Distance to its MA by DGT
Disclaimer : Trading success is all about following your trading strategy and the indicators should fit within your trading strategy, and not to be traded upon solely
The script is for informational and educational purposes only. Use of the script does not constitutes professional and/or financial advice. You alone the sole responsibility of evaluating the script output and risks associated with the use of the script. In exchange for using the script, you agree not to hold dgtrd TradingView user liable for any possible claim for damages arising from any decision you make based on use of the script

MACD With Crossings and Above Below ZeroMACD with MACD Derivative, Crossings Above and Below Zero, Shading for ADX Smoothing and Overlayed RSI
Primarily a moving average convergence divergence (MACD) momentum indicator. Also includes a MACD Derivative overlay to show when momentum has peaked. Displays triangle symbols when the MACD line crosses the signal line (larger triangle when MACD crosses above/below zero to indicator stronger momentum trend). Includes shading for average directional index (ADX) to futher determine when the price is trending strongly (red when the ADX value is greater than 25, and idicating a strong trend; otherwise blue). Lastly, has a relative strength index (RSI) momentum indicator overlayed to help evaluate periods of overbought or oversold conditions.

MACD Moving Average Convergence/Divergence - DurbtradeDurbtrade MACD - macd line changes color based on vertical direction. This makes it easier to see and discern movements and also helps the indicator to retain maximum functionality when taking up less chart real estate (also, having the color change really helps me see charts on small screens... such as when it's bright outside and I'm driving in my car and glancing at a chart on my phone... it helps having the info pop visually). A fill option is included to fill the space between the macd and signal lines, though I personally prefer to disable this function. Also, you get a zero line if you want it, and it doesn't extend past the current time, removing unnecessary info and keeping your chart looking a bit cleaner. Finally, there are color-coded, cross-over and cross-under background fills, signaling when the macd line crosses the signal line.
This is my 2nd published script, and 2nd script ever. If you like this style, see my 1st published script: Durbtrade Bollinger Bands Width.
Hope you find this useful.
Feel free to comment.

MACD Strategy with trailing ATR stopThis is a trend based strategy that uses EMA and SMA intersection for determining the direction of the trend and MACD for the entry signal. At the same time, the strategy uses ATR, which is working as a trailing stop.
The strategy entry will work when the Trend ribbon will turn green and MACD line will crossover the signal line. This strategy also takes into account the pyramiding and allows to enter the second time if the signal will repeat itself.
There are 3 exit points. The first 10% of the position will be closed when the price will increase by 1%. The second portion of 50% will be closed when the price reaches 5% Take profit target. The remaining 40 % of the position will wait for the exit signal which will occur when the price closes below the ATR line.
The strategy is using a fixed amount in dollars, each time the entry occurs the strategy will enter with 100$ in the order.
The strategy can be applied to other crypto assets. However, they will require input changes.
Best of luck with your trading.

[SignalFI] MACD PrimeWelcome! As part of our continual process to build and enhance trusted existing indicators, we're proud to release MACD Prime to the PRIME series for those traders that rely on the popular divergence mechanics traditional MACD provides.
MACD Prime provides a default MACD structure using the popular 12,26 EMAs and a 9 lockback signal line as the core of the indicator's functionality. In this way, you will get a consistent view for what you're use to, but of course we've added additional functionality that can be used to increase the value this view provides when trading.
ADDITIONAL Functions:
1) MACD Fast and Slow EMA sources are selectable, thus allowing the user to select OHLC variants as the source input for the 12/26 trendlines.
2) Background Coloring is based on a secondary "Signal" color which be default has been set to 6. This length is configurable, and providing a leading edge to the typical "MACD Cross". Said simply, the background color will change with the trend BEFORE a default MACD cross occurs. This may provide early warning of a MACD cross, and allow for additional entry/exit signals to manifest depending on other confluence with price and trend information.
3) MACD Trend Lines. In accordance with the PRIME series MACD Prime comes bundled with Trend Line support and resistance pivots that provide additional context for how the MACD may act based on a previous and projected trend line information. By default projections are turned off, but can be enabled from within the menu options. These trendlines can be used to spot divergences as well, and can be tuned within the option to increase resolution or decrease noise provided by trend lines.
All other standard functions persist, including the typical MACD line, MACD Signal Line, and MACD Histogram.
SignalFI was created to help traders and investors to effectively analyze the market based on the Golden Mean Ratio (Fibonacci numbers), plan a trade and ultimately execute it. To help inform and educate market decisions we developed a set of Trading Indicators which are available on TradingView.
SignalFI indicators are just that, indicators. Our indicators are generally configured to use completely historical data (negating repaint), and we advise all alerts created with SignalFI indicators to be fired upon "close" of the current candle. Our indicators can provide valuable context and visualization support when performing market analysis and executing buy and sell decisions. However. we are not financial experts, and all information presented on this site or our other media outlets are for educational purposes only.
