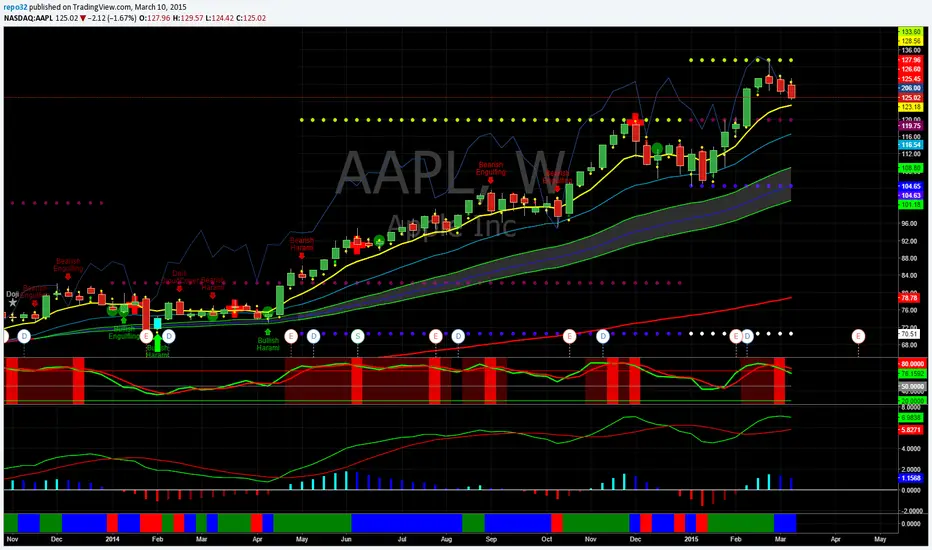
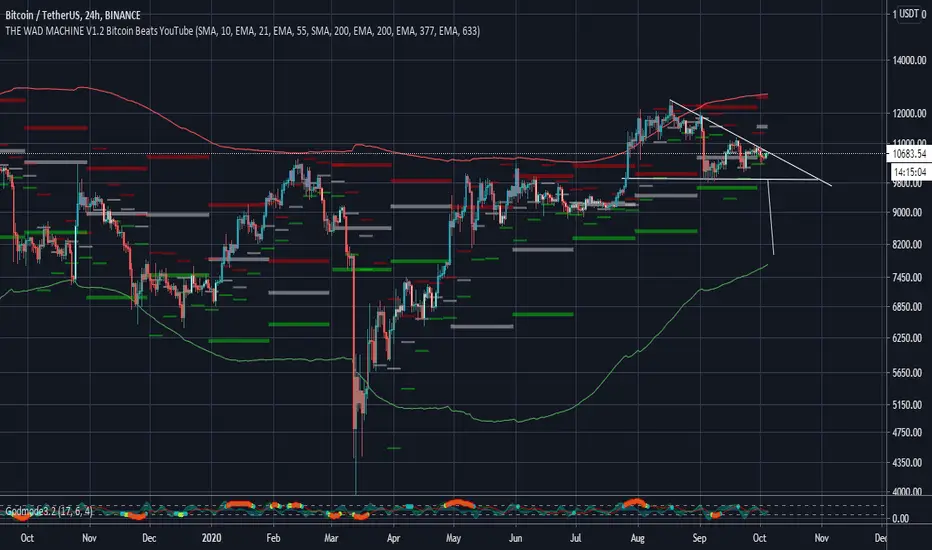
The WAD Machine - Bitcoin BeatsHello Hello Hello, and welcome back to Bitcoin Beats!
This is a Conglomeration of different scripts into 1 indicator that shows a bunch of different things.
This is not all my own work but also a mixture of features taken from other useful scripts.
I will say in terms of originality, it takes a certain level of skill to put this together and get it working so I'll take the credit for that.
This script does all that is said below:
- Plots fibonacci zones with adjustable days, weeks, months ect.
- Shows lower highs, higher lows, lower lows, lower highs after recognizing candle patterns(note that this is not predictive, just shows what has already happened).
- Plots a Price Action Channel(PAC).
The candles automatically adjust to the PAC to give Buy and Sell signals on most timeframes.
If the candles are blue, it means buy.
If the candles are red, it means sell.
If the candles are grey, you shouldn't be in a trade.
I will not state the profitability of this method but for this section of the indicator, it's designed for entries.
Exits require a more manual approach using your own trading initiative.
Beginner traders should exit when the channel is hit and the candle turns grey again.
However, more advanced traders can try to use the Fibonacci zones and other features to manage their positions.
- Plots general trendlines automatically with customization of the lines and the length they go for.
- Plots major sloping supports and resistances automatically.
PLEASE TRADE AT YOUR OWN RISK.
Cheers, and good bye, from Bitcoin Beats.
LOWS
Previous Day Week Highs & LowsThis script plots the previous n day and week highs and lows (previous two days and previous week by default).
Here are some additional info about the script behavior:
Plots highs and/or lows
Plots for days and/or weeks
Day highs and lows are shown only on intraday timeframes
Week highs and lows are shown only on timeframes < weekly
High and Lows + ATRScript is showing previous year, month and day high and low, plus ATR range from the open price on the current day.

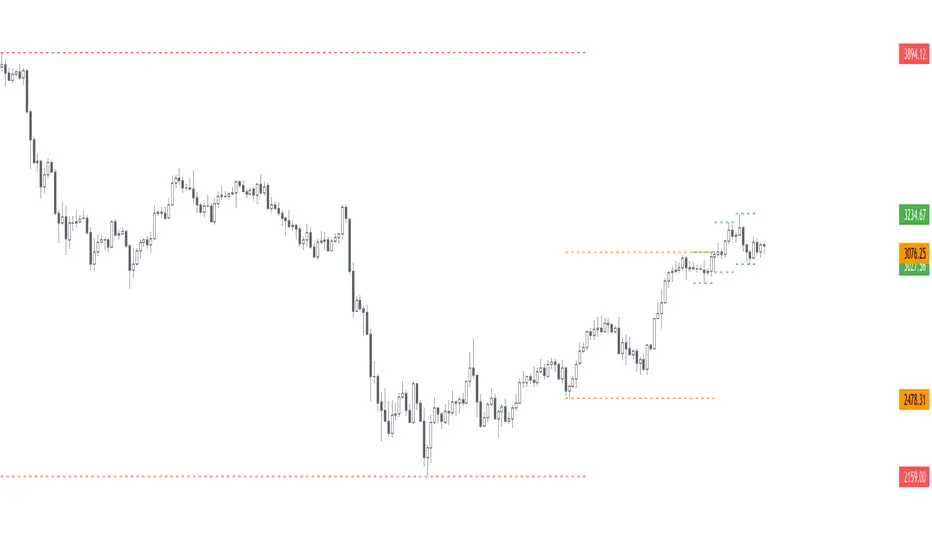
[RD] high / low lines pv4 v1==================================================================
July 7 2019 - high / low lines pv4 v1 - by RootDuk
==================================================================
Easy script to draw some lines on the input variable barsback.
You can extend the lines on the sides: left, right, both or none.
With the show variables (bools) you can show or hide the lines
Lines: high to high, low to low, high to low or low to high
Easy way to find support / resistance based on the past with
extended lines. Cheers and enjoy
===================================================================
Notes
===================================================================
Hope TV (pinescript) will get color inputs for line or a type color so we can
easily create inputs for colors for lines. Now its static. If someone knows
another way, pls let me know, i'll integrate it
===================================================================
Updates
===================================================================
Non so far v1

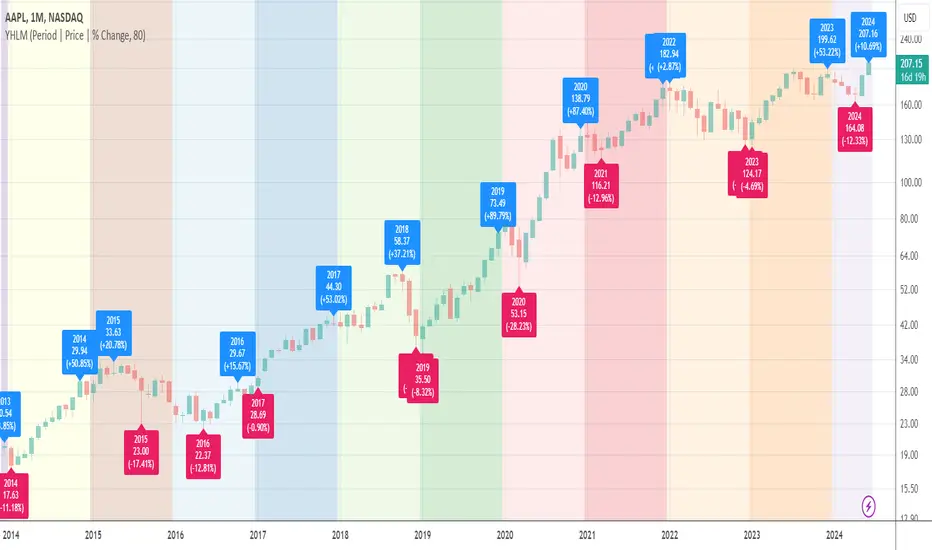
Yearly High/Low MarksAn utility tool for analysts. It marks the highest and lowest prices for each year down to 1989.
Works everywhere and doesn't use any calls of built-in functions that relate to the data extraction.
AAPL, D
AAPL, M
BLX, D
BLX, W
BLX, M
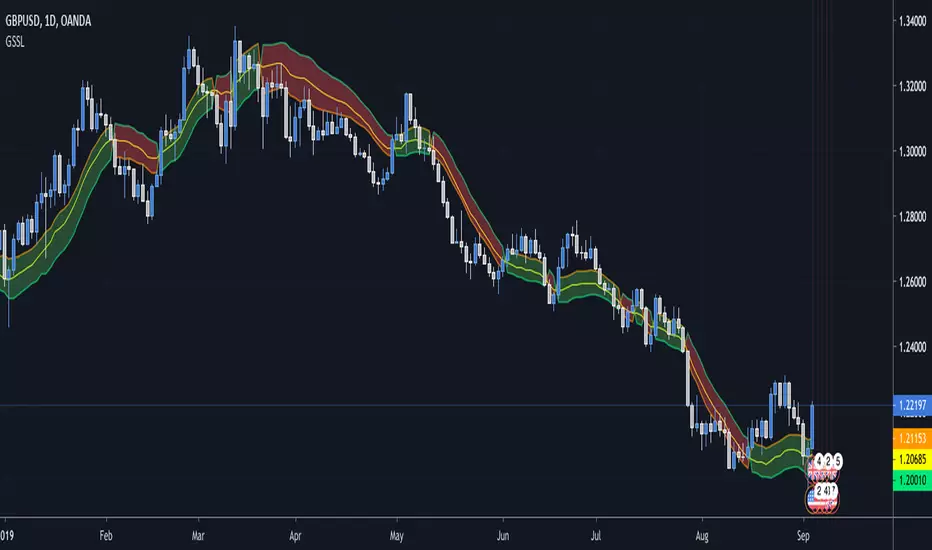
Generalized SSL by Vts// Generalized SSL:
// This is the very first time the SSL indicator, whose acronym I ignore, is on Tradingview.
// It is based on moving averages of the highs and lows.
// Similar channel indicators can be found, whereas
// this one implements the persistency inside the channel, which is rather tricky.
// The green line is the base line which decides entries and exits, possibly with trailing stops.
// With respect to the original version, here one can play with different moving averages.
// The default settings are (10,SMA)
//
// Vitelot/Yanez/Vts March 2019
High and Lows Multi-timeframeThis script displays highs and lows from higher timeframes into the chart. Recommended to use Weekly or more lines on smaller timeframe charts like the 5M charts.

TradingCryptoCourse Support/ resistance BreakoutThis indicator looks for breakouts above and below the latest highs and lows.

Swing FilterSwing Filter allows you to identify market swings and use the settings to filter out the noise.
The concept is the same as Pine Script's built in pivothigh() and pivotlow(), except with a command center full of controls. Do you to only see swings that are a certain amount higher or lower than their neighboring candles? Want to filter out flash-crashes or freak-spikes? Do you want to count swing-highs or lows that are formed by multiple bars? ...how many? ...how strict? Do you only want swings that are already confirmed or do you want swings that are probably about to be confirmed? You get the idea.
Swing Filter was designed to be plugged into other tools. Swings are used to figure Support and Resistance in Technical Analysis (TA), so you'll find that it is swing filter working in the background of my Support & Resistance Indicator. The creator of this indicator would be happy to help you implement Swing Filter into your workflow, and even can unlock rewiring features that allow Trading View Premium customers to use outputs from other indicators as inputs to swing filter (indicator layering).
INDICATOR SETTINGS:
SWING HIGH VISIBILITY - Show the location of all filtered swing-highs, marked with green "H"
Show Unconfirmed Swing Highs - Whereas a confirmed swing high is shown with a green H, unconfirmed swing highs are shown with an orange H. Sometimes you want to see what could become a swing high before the final right-neighboring candle closes and confirms it. As long as the final right-side candle still has a lower high, we can show an unconfirmed swing high. Once the final right-side candle closes with a lower high, then we have a confirmed swing high. When the "# of Lower Bars to Right of Swing High" setting is set to a number greater than 1, keep in mind that unconfirmed candles will only ever appear one candle prior to confirmation.
# of Lower Bars to Left of Swing High - Swing highs are calculated based on being higher than neighboring candles. How many candles do you want to check to the left-side of a swing high?
# of Lower Bars to Right of Swing High - Swing highs are calculated based on being higher than neighboring candles. How many candles do you want to check to the right-side of a swing high?
Must be This % Higher Than Left Bars - Filter out highs that aren't high enough. "0.5" would require your swing highs to be at least half a percent higher than the high of its confirming left-side bars.
Must be This % Higher Than Right Bars - Filter out highs that aren't high enough. "1" would require your swing highs to be at least one percent higher than the high of its confirming right-side bars.
Multibar Highs - # Bars Allowed to Form High - Filter out or allow highs that are formed at a transition from one bar to another. Especially on low spread exchanges like GDAX, highs may be formed by many consecutive bars, formed by persistant impenetrable buy/sell walls. When using multibar highs, they are counted as a single candle: the swing high will be marked on the right-most high of the multi-bar high, and then the left-side bars are counted from the left-most high of the multi-bar high.
Multibar Highs Strict-Mode - Some multibar highs are just the result of chance, meaning that the first candle reached it's high, went back down, then the second candle reached the same high at a later time. Strict mode will filter these out and only show multibar swing highs that were formed when a candle closed at its high and the next candle opened at its same high. How strict? It allows a one penny difference (for negligible spreads). It also doesn't care about the candles' lows, which leaves room for a future super-strict mode.
*For the complete list of settings and instructions see comments below (sorry they're listed in backwards order below, and the publishing rules won't let me put them all here (too long))

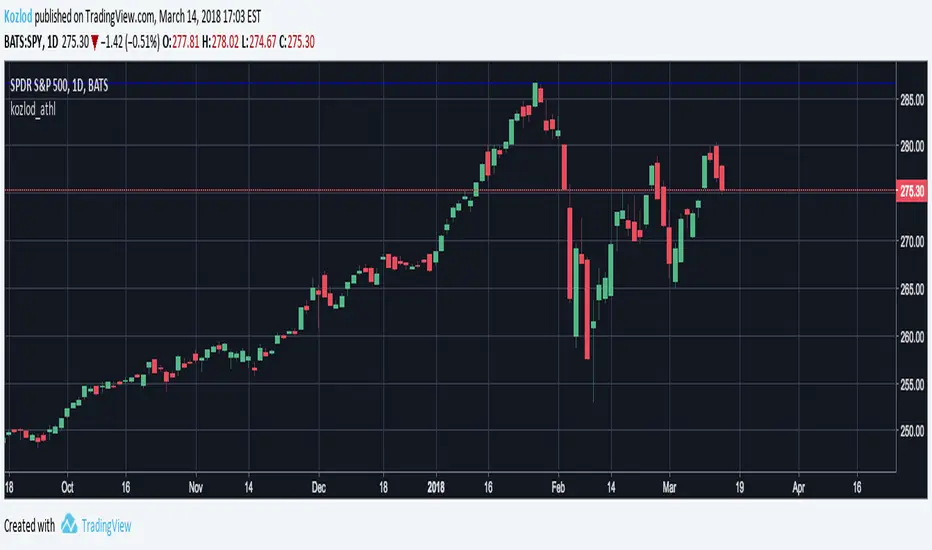
Kozlod - All-time high/low alertsA small script to track all-time high/low levels.
You can create alerts when levels will be updated.
52 Week High/Low52 Week High / Low Indicator
A simple, unobtrusive indicator that can be used on any timeframe to display the 52 week high/low values.
Features
Works on any timeframe.
Unobtrusive: Simple horizontal lines showing only the current 52 week values.
Allows the user to select whether to calculate the 52-week values from candle close values or the respective highs/lows.
For full overview and code commentary - Visit the backtest-rookies website.


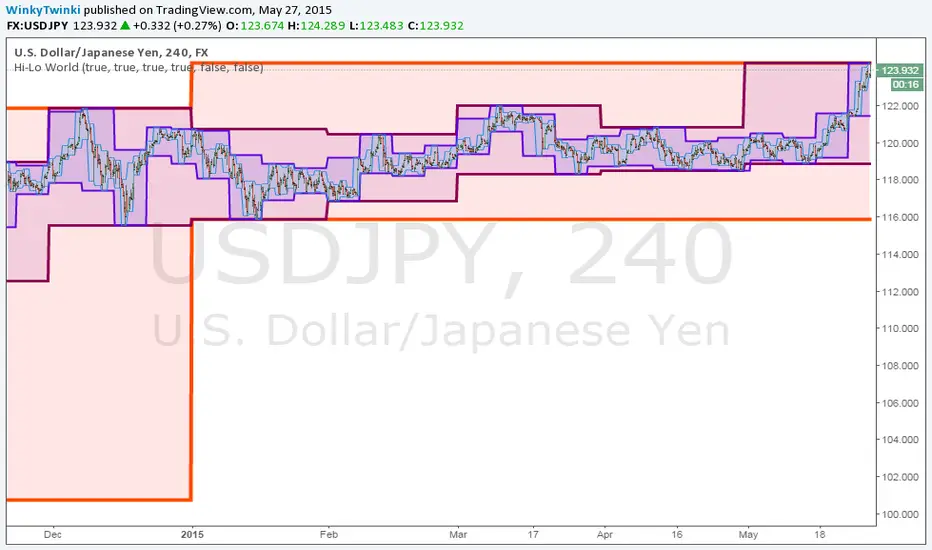
Hi-Lo WorldThis script plots the highs/lows from multiple timeframes onto the same chart to help you spot the prevailing long-term, medium-term and short-term trends .
List of timeframes included:
Year
Month
Week
Day
4 Hour
Hour
You can select which timeframes to plot by editing the inputs on the Format Object dialog.
High Low YearlySorry for the mess above. Not sure how to remove it. It was not what I was looking to post. I added the the clean chart below.
This was requested by "N". It displays the current yearly highs and lows along with the previous years highs and lows. Just a nice way to see the support resistance in all time frames.