Swing DistanceHello fellas,
This simple indicator helps to visualize the distance between swings. It consists of two lines, the highest and the lowest line, which show the highest and lowest value of the set lookback, respectively. Additionally, it plots labels with the distance (in %) between the highest and the lowest line when there is a change in either the highest or the lowest value.
Use Case:
This tool helps you get a feel for which trades you might want to take and which timeframe you might want to use.
Side Note: This indicator is not intended to be used as a signal emitter or filter!
Best regards,
simwai
Lowest

Visible bars count on chart + highest/lowest bars, max/min AOThe indicator displays the number of visible bars on the screen (in the upper right corner), including the prices of the highest and lowest bars, the maximum or minimum value of the Awesome Oscillator (similar to MACD 5-34-5) for identify the 3-wave Elliott peak in the interval of 100 to 140 bars according to the Profitunity strategy of Bill Williams. The values change dynamically when scrolling or changing the scale of the graph.
In the indicator settings, you can hide labels, lines and change any parameters for the AO indicator - method (SMA, Smoothed SMA, EMA and others), length, source (open, high, low, close, hl2 and others).
‼️ The values are updated within 2-3 seconds after changing the number of visible bars on the screen.
***
Индикатор отображает количество видимых баров на экране (в правом верхнем углу), в том числе цены самого высокого и самого низкого баров, максимальное или минимальное значение Awesome Oscillator (аналогично MACD 5-34-5), чтобы определить пик 3-волны Эллиота в интервале от 100 до 140 баров по стратегии Profitunity Билла Вильямса. Значения меняются динамически при скроллинге или изменении масштаба графика.
В настройках индикатора вы можете скрыть метки, линии и изменить любые параметры для индикатора AO – метод (SMA, Smoothed SMA, EMA и другие), длину, источник (open, high, low, close, hl2 и другие).
‼️ Значения обновляются в течении 2-3 секунд после изменения количества видимых баров на экране.

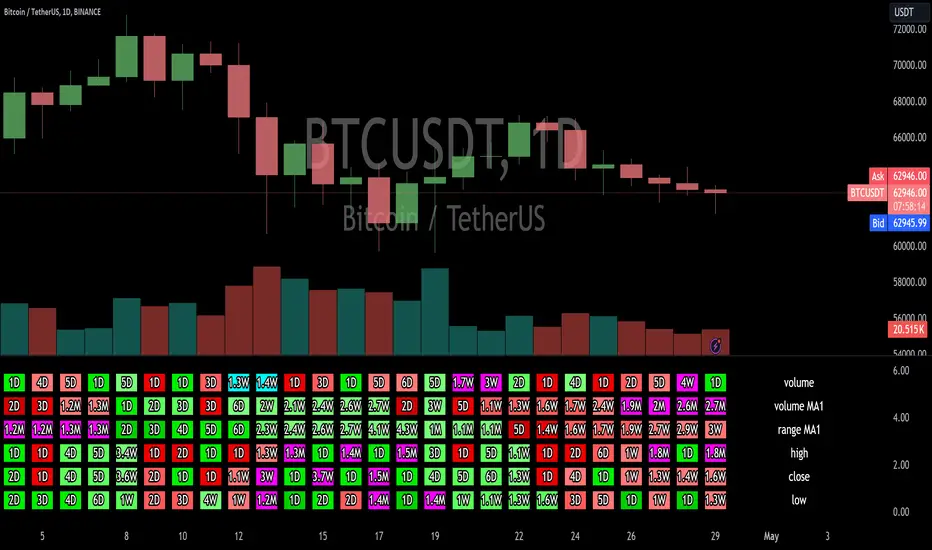
Highest/Lowest value since X time ago, various indicatorsThis script will count the bars back since the last time the current bar indicator value was either this low or this high.
It will provide the time in either, seconds, minutes, hours, days, weeks, months, or years.
please note:
There are currently no alerts setup for this script.
the length options only apply to the sources that have the "(MA)" in their name.
There is a horizontal line display issue which corrects once you adjust the amount of sources you want to use.
Once you select the amount of sources you would like to use, align the indicator so the horizontal lines match up with the table lines.
If find any bugs in the script, let me know.
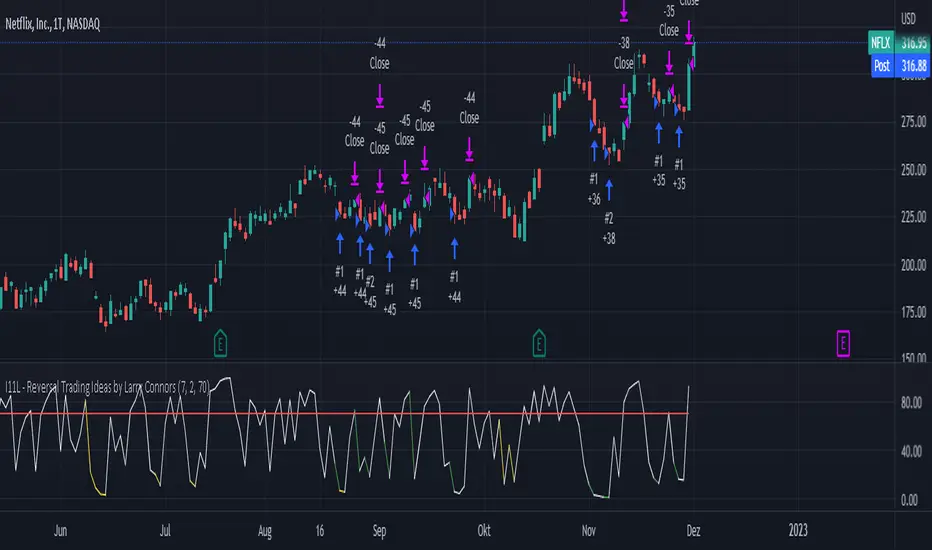
I11L - Reversal Trading Ideas by Larry ConnorsThis is my own Twist on Larry Connors Simple Tradingideas.
It Combines the RSI, Averaging In and the Lowest Bars in a Single System.
The current Configuration is designed for the Daily Timeframe.
Feel free to play with the Parameters and keep in mind that Larry Intended to buy fear and sell the greed!
The Rules are the following:
---Buy---
Buy, if the lowest Bar of your Configuration has been hit (default is set to 7).
---Average Down--
Buy, if the lowest Bar of your Configuration * Your open trades has been hit AND only if the buyin is atleast 1% cheaper.
---Close---
Close, if the RSI closes above a certain level (default is set to 70).
---TP---
There is no TP
---SL---
There is no SL, so be cautions of your tail Risk!
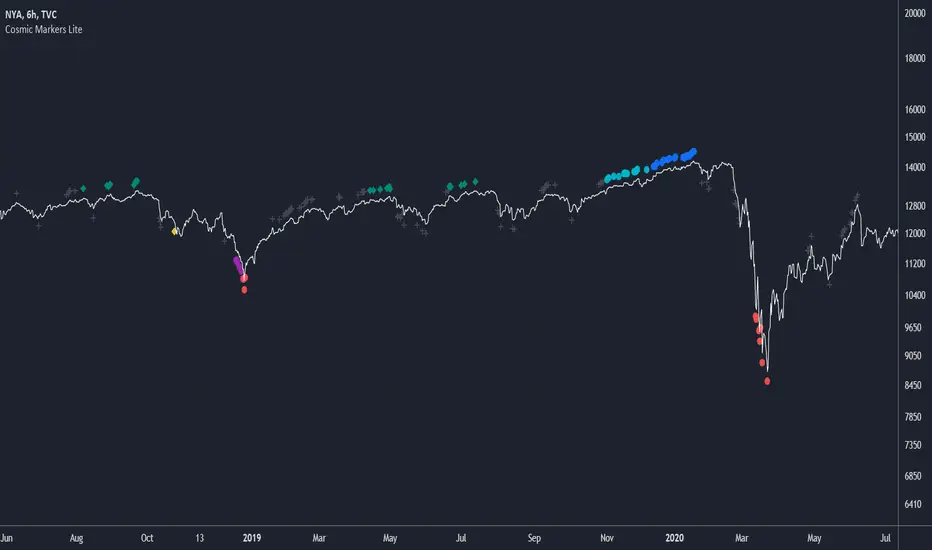
Cosmic Markers LiteThis marker-only indicator traces highest and lowest bars using 5 different periods (the first 3 in aggregation and the rest as is) for a total of 10 support and resistance signals of varying strength. Use Cosmic Markers Lite on its own or add on top of existing chart patterns or other line indicators.
MapMap - an indicator that shows the highest and lowest points on the price movement road.
The calculation is based on the type of price data specified in the "Source" parameter and the length of the time interval specified in the "Length" parameter.
The indicator helps to visually find a local trend and rebound points.
Thanks for your attention!

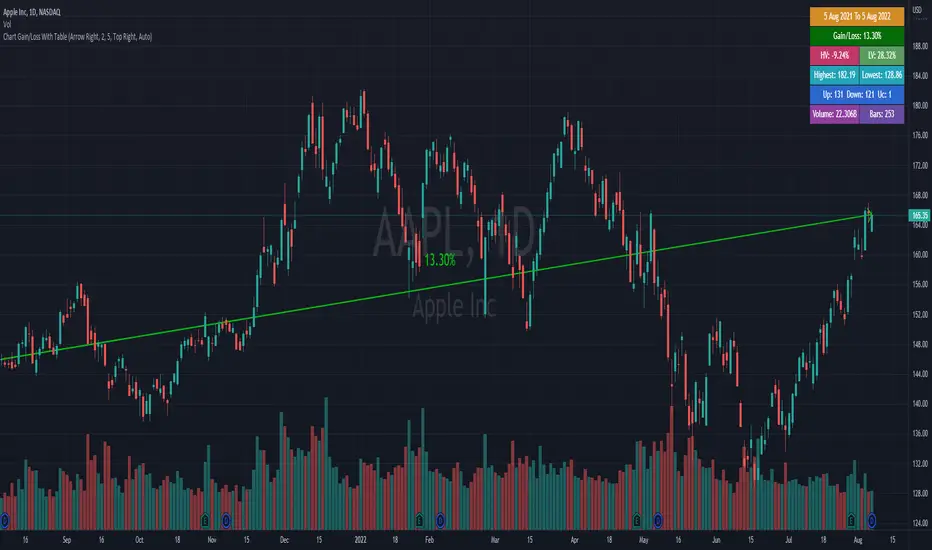
Chart Gain Or Loss With TableThis indicator auto calculate the first visible bar to the last visible bar
1. Gain or loss in percentage
2. Highest price
3. Lowest price
4. Total up bar
5. Total down bar
6. Total unchanged bar
7. Total bar
8. Total volume
*This indicator is not working on this page, you must add it in to your chart.
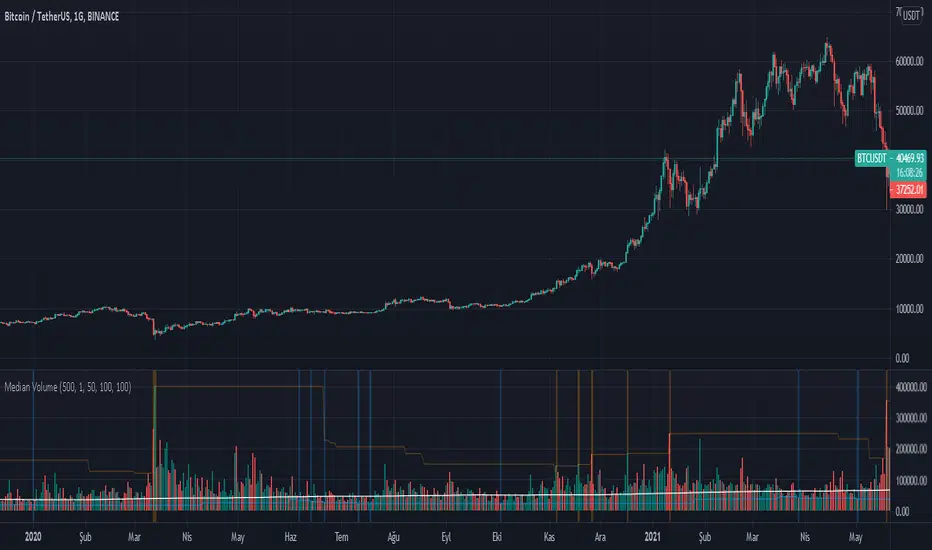
Midpoint - MGEnglish Descriptions
Midpoint - MG indicator is an indicator available in Netdania application. I wanted to contribute of moving it to this environment for Tradingview users. The basic logic is the value obtained by adding the highest and lowest levels in the specified periods and dividing them into two. The specified range is left to user preference. The desired range can be selected from the indicator settings. The intersection of the price with this average up or down can be used as an auxiliary element related to our trade. Thanks in the hope that it will be useful.
Türkçe Açıklama
Midpoint - MG indikatörü Netdania uygulamasında bulunan bir göstergedir. Bende Tradingview kullanıcıları için bu ortama taşıyarak katkıda bulunmak istedim. Temel mantığı belirlenen periyotlarda en yüksek ve en düşük seviyenin toplanarak ikiye bölünmesiyle ortaya çıkan değerdir. Belirlenen aralık kullanıcı tercihine bırakılmıştır. İndikatör ayarlarından istenen aralık seçilebilmektedir. Fiyatın bu ortalama ile aşağı veya yukarı kesişmesi bize ticaretimiz ile alakalı yardımcı unsur olarak kullanılabilmektedir. Faydalı olması umuduyla teşekkkürler.

Lowest Close indicatorPlots the lowest close in last 40 bars. On a daily chart , that's about 8 weeks.

Never Going Back AgainDraws lines for each of up to 500 prices that have never been revisited at the present moment in time, as time progresses these levels may or may not hodl.
Adaptation of "Never Look Back Price" originally described by Timothy Peterson in his research paper entitled "Why Bitcoin's Price Is Never Looking Back".
For more information see: static1.squarespace.com

Williams Vix Fix + Inverse [Alorse]The VIX Fix measures how close the current market price is to the lowest price of the last X candles. When prices are in uptrends, the close is usually near the high. But prices close near the low in downtrends.
It works because it’s based on how traders behave. The calculation fixes some of the problems with the VIX.
This indicator is based on CM_Williams_Vix_Fix Finds Market Bottoms and its great difference is that it adds the inverse functionality, also showing the possible highest areas of the market.

2HLA very simple, almost naive strategy, in which you buy on the lowest of the two previous candles and sell at the highest of the two previous candles. You can configure these highest and lowest lenght, in some assets two is too small of a number to make profit. You can also configure to exit the position after X, and I found that 7 (which is a week of working days) is a good number for that.
This is strategy is intended to be used as a swing trade. Your capital needs to be high enough so that it can pay the operaitonal costs, and reach it's target with a reasonable profit.
Since this is a volatility based strategy, assets that are more liquid won't work properly.

Support Resistance - Aging [Example]Hello All,
First all of Thanks to Pine Team for adding Arrays to Pine!
In this script I tried to make example for
1. Finding S/R lines using highest/lowest function
2. Using 1D array as 2D (we keep S/R levels and age)
3. "Age" usage for S/R levels, getting older on each candle and changing colors by their age (maximum age is 127 then it disappears)
You can use "Close"/Open " or " High/Low " as source.
There is an option for the background color, by default it's Black, do not forget to set it accordingly :)
Enjoy!

Time Frame Highs & LowsScript plots the previous n highs & lows of current time frame and an information label with key higher time frame levels.
Additional info about the script behaviour:
n/a

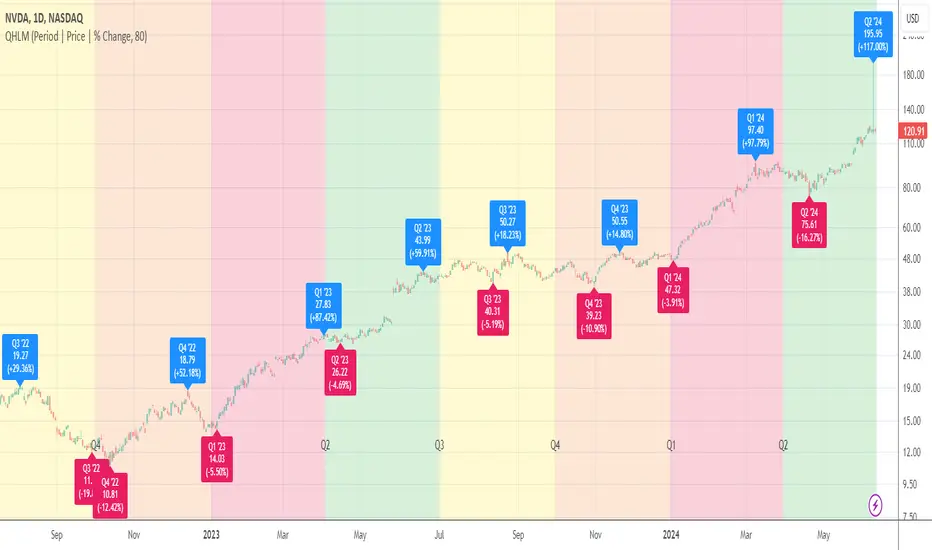
Quarterly High/Low MarksThis utility tool marks the highest and the lowest price of each quarter on the chart. Works everywhere and doesn't use any calls of built-in functions which are used for a data extraction.
Labels provide additional information about closing price and % change for a particular quarter and allow micro customizations.
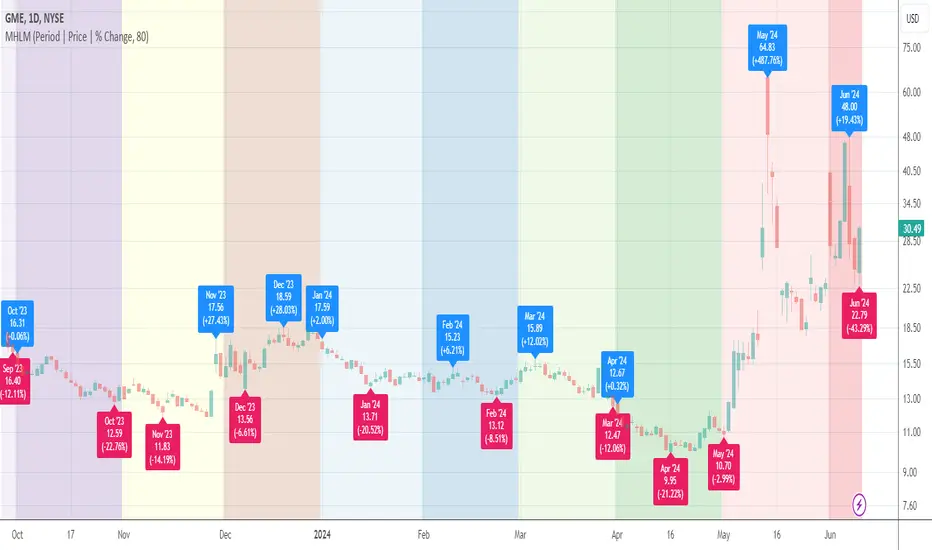
Monthly High/Low MarksThis utility tool marks the highest and the lowest price of each month on the chart. Works everywhere and doesn't use any calls of built-in functions which are used for a data extraction.
Labels provide additional information about closing price and % change for a particular month and allow micro customizations.
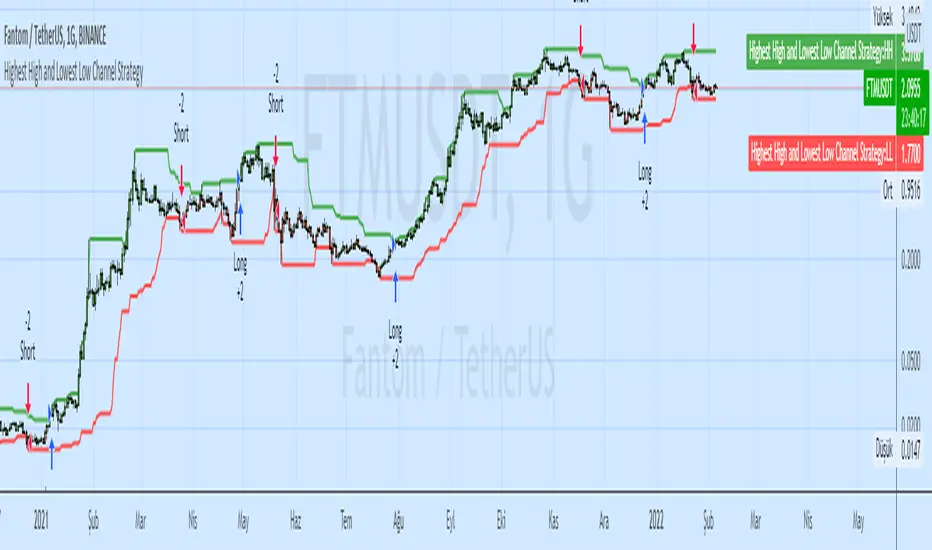
Highest High and Lowest Low Channel StrategyHighest / Highest High Highest (Data) - HHV (Data, Period)
Lowest / Lowest Low Lowest (Data) LLV (Data, Period)
These functions calculate the highest / lowest value of a selected data.
Highest High and Lowest Low options are mostly used.
The Highest function calculates the highest value of the selected data in the past.
The Lowest function calculates the lowest value of the selected data in the past.
Ranged Candle Length - evoSimilar to one of my previous scripts 'Ranged Volume', but instead of using volume, this script uses candle length mirrored. It creates a range using highest and lowest of a given period. When the range gets larger, it means the current candle is bigger than the largest candle of your given period (break-out).
Yellow = Bullish break out
Red = Bearish break out
A good way to use this is to follow the direction of the last break-out candle or open a position with a stop just below or above the candle (that's how I tested it real time).
Good luck!

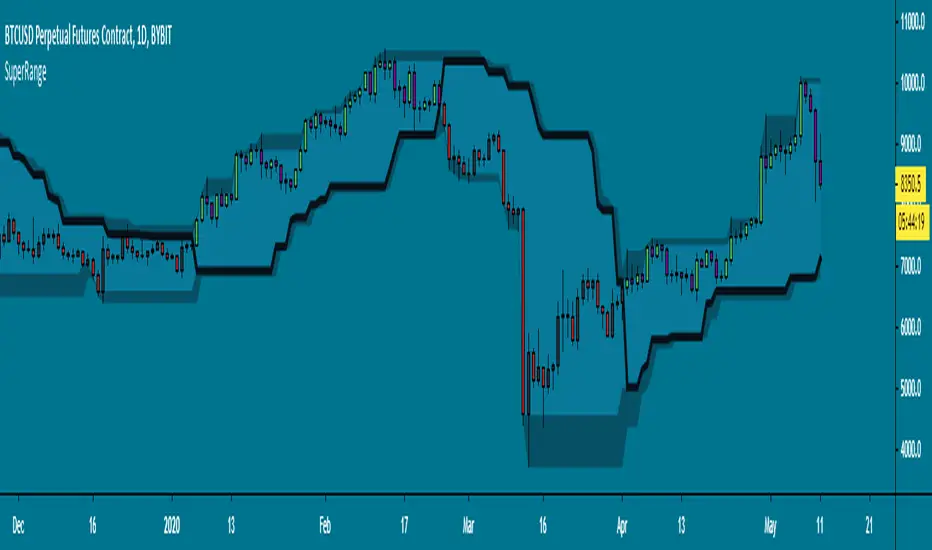
SuperRange - evoA SuperTrend like indicator based on highest and lowest candle close from a few bars back. It looks almost the same as Donchian Channels but with a dominant trend direction inside (Black line).
Uptrend: Candle closed higher than highest close
Downtrend: Candle closed lower than lowest close
This works best on higher time frames since a daily close is more powerful than a 15 minute close.
A few examples how you could use this:
Use support & resistance
Apply a moving average
Buy and sell the break-out
All perfect world examples, this does not happen all the time off course.. Its just for the idea. There are many ways to trade this so feel free to share in the comments, good luck and follow the trend! :)
Ranged Volume - evoA simple script that shows mirrored regular volume bars with the purpose to show break-outs and low volume ranges, using highest and lowest of a few bars back.
Use Heikin Ashi function to smooth the colors with the trend.

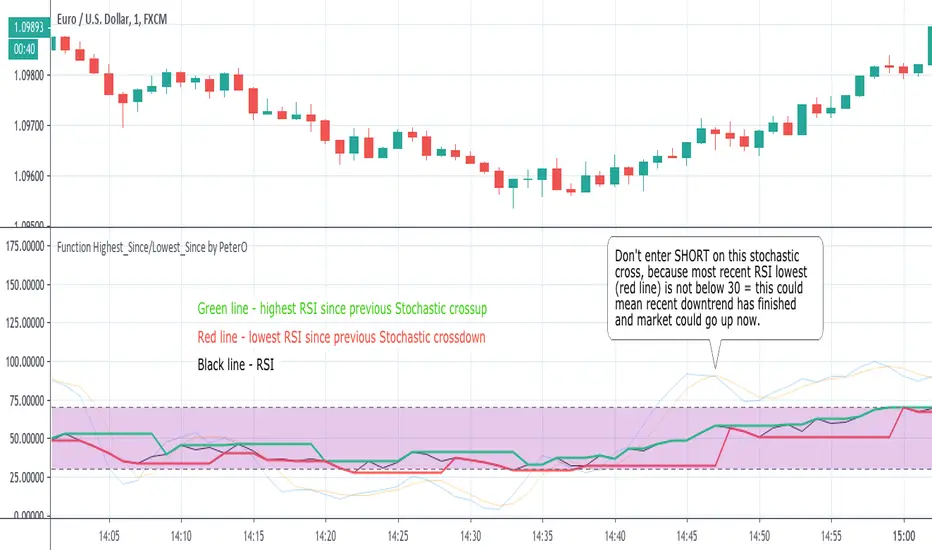
Function Highest/Lowest by PeterONo matter how much I like PineScript, there are still things missing in the language. One of the most annoying issues is that you cannot set dynamic length value for highest/lowest functions. This length must be fixed integer. But it doesn't make sense in a lot of cases, when you'd like to know what was the highest/lowest value of a series SINCE EVENT in the past, but you don't know WHEN this event exactly happened.
Us, coders would like to do this: `highest(series,barssince(...))`
But it is not working.
Numerous coders are using RicardoSantos' f_highest/f_lowest script (), probably the most often copy/pasted snippet of PineScript code out there. It is doing more-less what `highest(series,barssince(...))` would be doing, but with hardcoded max bars back.
Ricardo is my idol by the way, but that didn't stop me from creating my own version of Highest/Lowest functions. They are fast, simple, effective and very light for Pine engine.
Please treat this as an OPEN SOURCE snippet of code, which can be used in variety of ways.
I have implemented a simple use-case myself, to demonstrate what can be done. The example shows what was the highest/lowest value of RSI since the previous cross of Stochastic. So that you don't enter SHORT on Stochastic crossunder, if RSI didn't reach oversold (<30) since the previous Stochastic crossunder = aka maybe the downtrend has exhausted.
I'm sure you'll find plenty of use cases for it in your studies and strategies as well. If you create your own code using my Highest/Lowest functions, don't hesitate to put a link down here in comments.
P.S. This is not a strategy in any way, so don't ask me "does it backtest well?".
P.S.2 This code doesn't repaint as well ;)
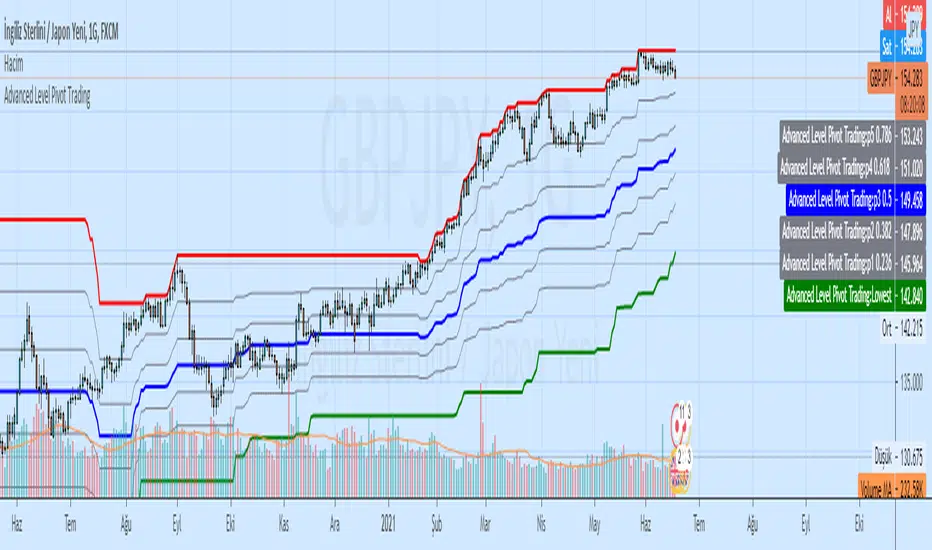
Advanced Level Pivot TradingAdvanced Level Pivot Trading
Highest Lowest Channel and Level Pivot (Fibonacci)