Waddah Attar Explosion with TDI First of all, a big shoutout to @shayankm, @LazyBear, @Bromley, @Goldminds and @LuxAlgo, the ones that made this script possible.
This is a version of Waddah Attar Explosion with Traders Dynamic Index.
WAE provides volume and volatility information. Also, WAE calculation was changed to a full-on MACD, to provide the momentum: the idea is to "assess" which MACD bars have significant momentum (i.e. crossover the Explosion Line)
TDI provides momentum, divergences as well as overbought and oversold areas. There is also a RSI on a different timeframe, for convergence.
Almost everything is editable:
- All moving averages are customizable, including the TRAMA, from @LuxAlgo
Waddah Attar Explosion_
- Three different crossing signals: histogram crossing contracting Explosion Line, expanding Explosion Line and ascending Explosion Line while both Bolling Bands are expanding; Explosion Line shows different color when expanding.
- Explosion line signals: Below DeadZone line and Exhaustion (highest value in a given lookback period). You can set a predefined EPL slope to filter out some noise.
- Deadzone signal : Deadzone squeeze ( lowst value in a given lookback period)
TDI:
- Overbought an Oversold signals. The OB and OS shapes have two colors, in order to display extreme signals on current timeframe or extreme signals on current and different time frame.
- Visual display of RSI outside the Bollinger Bands, and crossing of RSI Moving Average crossing of zero line.
I believe this combination is great for so many reasons!
Like the idea of TTM Squeeze? You can tune the Deadzone and Explosion lines to look for a volatility breakout
Like trading divergences or want to filter out extreme areas? The RSI is great for that
You like the using the MACD strategy but don't like the amount of false signals given? this WAE version filters some of them out.
If you are a Bollinger bands fan, you can customize both indicators to trade breakouts and/or mean reversion strategies, and filter out exhaustion of the bands expansion
This is my first publication, so give it a go and provide feedback if possible.
Index

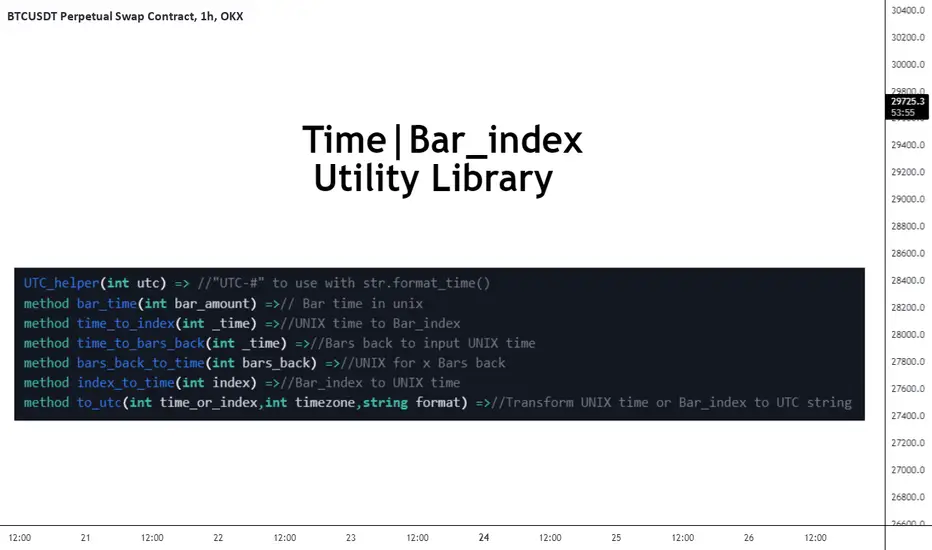
FrizLabz_Time_Utility_MethodsLibrary "FrizLabz_Time_Utility_Methods"
Some time to index and index to time helper methods made them for another library thought I would try to make
them as methods
UTC_helper(utc)
UTC helper function this adds the + to the positive utc times, add "UTC" to the string
and can be used in the timezone arg of for format_time()
Parameters:
utc : (int) | +/- utc offset
Returns: string | string to be added to the timezone paramater for utc timezone usage
bar_time(bar_amount)
from a time to index
Parameters:
bar_amount : (int) | default - 1)
Returns: int bar_time
time_to_index(_time)
from time to bar_index
Parameters:
_time : (int)
Returns: int time_to_index | bar_index that corresponds to time provided
time_to_bars_back(_time)
from a time quanity to bar quanity for use with .
Parameters:
_time : (int)
Returns: int bars_back | yeilds the amount of bars from current bar to reach _time provided
bars_back_to_time(bars_back)
from bars_back to time
Parameters:
bars_back
Returns: int | using same logic as this will return the
time of the bar = to the bar that corresponds to bars_back
index_time(index)
bar_index to UNIX time
Parameters:
index : (int)
Returns: int time | time in unix that corrresponds to the bar_index
to_utc(time_or_index, timezone, format)
method to use with a time or bar_index variable that will detect if it is an index or unix time
and convert it to a printable string
Parameters:
time_or_index : (int) required) | time in unix or bar_index
timezone : (int) required) | utc offset to be appled to output
format : (string) | default - "yyyy-MM-dd'T'HH:mm:ssZ") | the format for the time, provided string is
default one from str.format_time()
Returns: string | time formatted string
GET(line)
Gets the location paramaters of a Line
Parameters:
line : (line)
Returns: tuple
GET(box)
Gets the location paramaters of a Box
Parameters:
box : (box)
Returns: tuple
GET(label)
Gets the location paramaters and text of a Label
Parameters:
label : (label)
Returns: tuple
GET(linefill)
Gets line 1 and 2 from a Linefill
Parameters:
linefill : (linefill)
Returns: tuple
Format(line, timezone)
converts Unix time in time or index params to formatted time
and returns a tuple of the params as string with the time/index params formatted
Parameters:
line : (line) | required
timezone : (int) | default - na
Returns: tuple
Line(x1, y1, x2, y2, extend, color, style, width)
similar to line.new() with the exception
of not needing to include y2 for a flat line, y1 defaults to close,
and it doesnt require xloc.bar_time or xloc.bar_index, if no x1
Parameters:
x1 : (int) default - time
y1 : (float) default - close
x2 : (int) default - last_bar_time/last_bar_index | not required for line that ends on current bar
y2 : (float) default - y1 | not required for flat line
extend : (string) default - extend.none | extend.left, extend.right, extend.both
color : (color) default - chart.fg_color
style : (string) default - line.style_solid | line.style_dotted, line.style_dashed,
line.style_arrow_both, line.style_arrow_left, line.style_arrow_right
width
Returns: line
Box(left, top, right, bottom, extend, border_color, bgcolor, text_color, border_width, border_style, txt, text_halign, text_valign, text_size, text_wrap)
similar to box.new() but only requires top and bottom to create box,
auto detects if it is bar_index or time used in the (left) arg. xloc.bar_time and xloc.bar_index are not used
args are ordered by purpose | position -> colors -> styling -> text options
Parameters:
left : (int) default - time
top : (float) required
right : (int) default - last_bar_time/last_bar_index | will default to current bar index or time
depending on (left) arg
bottom : (float) required
extend : (string) default - extend.none | extend.left, extend.right, extend.both
border_color : (color) default - chart.fg_color
bgcolor : (color) default - color.new(chart.fg_color,75)
text_color : (color) default - chart.bg_color
border_width : (int) default - 1
border_style : (string) default - line.style_solid | line.style_dotted, line.style_dashed,
txt : (string) default - ''
text_halign : (string) default - text.align_center | text.align_left, text.align_right
text_valign : (string) default - text.align_center | text.align_top, text.align_bottom
text_size : (string) default - size.normal | size.tiny, size.small, size.large, size.huge
text_wrap : (string) default - text.wrap_auto | text.wrap_none
Returns: box
Label(x, y, txt, yloc, color, textcolor, style, size, textalign, text_font_family, tooltip)
similar to label.new() but only requires no args to create label,
auto detects if it is bar_index or time used in the (x) arg. xloc.bar_time and xloc.bar_index are not used
args are ordered by purpose | position -> colors -> styling -> text options
Parameters:
x : (int) default - time
y : (float) default - high or low | depending on bar direction
txt : (string) default - ''
yloc : (string) default - yloc.price | yloc.price, yloc.abovebar, yloc.belowbar
color : (color) default - chart.fg_color
textcolor : (color) default - chart.bg_color
style : (string) default - label.style_label_down | label.style_none
label.style_xcross,label.style_cross,label.style_triangleup,label.style_triangledown
label.style_flag, label.style_circle, label.style_arrowup, label.style_arrowdown,
label.style_label_up, label.style_label_down, label.style_label_left, label.style_label_right,
label.style_label_lower_left, label.style_label_lower_right, label.style_label_upper_left,
label.style_label_upper_right, label.style_label_center, label.style_square,
label.style_diamond
size : (string) default - size.normal | size.tiny, size.small, size.large, size.huge
textalign : (string) default - text.align_center | text.align_left, text.align_right
text_font_family : (string) default - font.family_default | font.family_monospace
tooltip : (string) default - na
Returns: label
Bursa Malaysia Index SeriesERVIEW
This indicator is intend to display Bursa Malaysia Index Series.
█ FEATURES
1. Choose available sector based on Bursa Malaysia Index.
2. Plot close or OHLC.
3. Color of Closing price plot adapt to chart background color.
4. Font size can be selected.
█ EXAMPLES / USAGES

Black RSI (Pro Suite)Black RSI (Pro Suite) is combination of RSI (Relative Strength Index), Volume RSI, Heikin Ashi RSI & other multi Oscillators with multi features into one indicator, features like (Quad Divergences, Multi Time Frame RSI, MTF RSI Panel, Oscillator Support/Resistance/Wedges/Trendlines, Oscillator Moving Average/BBs, Smooth RSI, RSI Price Estimator, Oscillator Over bought/sold Bars, Osc OB/OS Zones, Osc OB/OS Highlights, additionally Black RSI indicator is flexible & completely customizable).
Indicator goal: I have tried my best to organized RSI & other suitable oscillators and oscillator useful tools into one simple and free indicator for Tradingview users (specifically for Tradingview 'basic' subscription users). suggestions are always welcome. please give feedback & appreciate if you like my work.
Black RSI Indicator Features Summary:
Black RSI indicator includes many features mainly relevant to RSI and other Oscillators, these are briefly highlighted below:
Black RSI Dashboard
Multi Oscillators: Choose between multiple oscillators. All oscillators settings are customizable.
Multi Symbol: Multi Symbol Support, applicable on all oscillators
RSI (Relative Strength Index)
VRSI (Volume Relative Strength Index)
HA RSI (Heikin Ashi Relative Strength Index)
OBV (On Balance Volume)
CVD (Comulative Volume Delta)
MFI (Money Flow Index)
UO (Ultimate Oscillator)
MOM (Momentum Oscillator)
ATR (Average True Range)
Stoch (Stochastic Oscillator)
Stoch RSI (Stochastic RSI)
Oscillator Primary Tools ◢
Oscillator Moving Average/Bollinger Bands
Smooth RSI
Multi Timeframe RSI
Multi Timeframe RSI Panel
RSI Price Estimator
Oscillator Support/Resistance/Wedges/Trendlines
Oscillator Moving Average/BBs: Shows Moving Average for selected oscillator.
Smooth Smooth: Smooths out RSI
Multi Timeframe RSI: Displays Multiple Time Frame/Multiple Symbol RSI and converts it and shows it as it is in current time frame without effecting Primary RSI
Multi Timeframe RSI Panel: Displays Multiple Time Frame/Multiple Symbol RSI values of user input specific timeframes in compact panel (max 8 Time frames)
RSI Price Estimator: Calculates RSI estimate price values of 3 different user specific RSI input levels, RSI x MA cross price and RSI future value of user specific price input level.
Oscillator Support/Resistance/Wedges/Trendlines: Draws Trendlines, Wedges and Support & Resistance lines on selected oscillator
Oscillator Quad Divergence ◢
1st Oscillator Divergence: Traditional divergence indicator with enhancements & customization
2nd Oscillator Divergence: Traditional divergence indicator with enhancements & customization
3rd Oscillator Divergence: Advanced Divergence indicator with source selection, RSI/Price threshold, potential divergences & customization
4th Oscillator Divergence: Pivots divergence indicator with flexible pivots selection & customization
Regular bullish divergences are indicated when price is forming lower lows while an oscillator shows higher lows.
Regular bearish divergences are indicated when price is forming higher highs while an oscillator shows lower highs.
While regular divergences indicate trend reversals, hidden divergences indicate a trend continuation.
When the price is making higher lows and the oscillator is showing lower lows, we speak of a bullish hidden divergence.
When the price is making lower highs and the oscillator shows higher highs, it's a bearish hidden divergence.
Oscillator Secondary Tools ◢
Oscillator HH/LL pivots
Osc OB/OS Color Bars
Osc OB/OS Zones
Osc OB/OS Highlights
Background
Oscillator HH/LL pivots: Shows HH/LL pivot points on selected oscillator
Osc OB/OS Color Bars: Plots color chart bars based on RSI, MFI, Stochastic, Stochastic RSI or combine overbought/oversold conditions
Osc OB/OS Zones: Plots Osc OB/OS Zones with user input levels
Osc OB/OS Highlights: Highlight oscillator OB/OS background area
Background: background color customization
+ Primary RSI Settings ▾
- Primary RSI Length: User input RSI Length value
- Primary RSI Source: User RSI Source selection
- RSI Overbought Threshold: Allows the user to set the RSI overbought threshold value. This Overbought Threshold value will also be applied on "RSI Divergence overbought condition", "RSI OB Color Bars" and "Primary RSI Color Schemes
- RSI Oversold Threshold: Allows the user to set the RSI oversold threshold value. The lower band (oversold line) of RSI. This Oversold Threshold value will also be applied on "RSI Divergence oversold condition", "RSI OS Color Bars" and "Primary RSI Color Schemes
- RSI Middle Band: Allows the user to set the RSI middle band value. This value will also applied to "Center Line" color scheme from "Primary RSI Color Schemes" drop menu
- Primary RSI Colors:
Range color specifies a gradient of colors from the overbought to the oversold threshold user inputs from "Primary RSI" section. Color interpolation also a gradient but smoother than Range color. Center Line is similar but is not a gradient, linked to Middle Band ("Primary RSI" section) and changes color with RSI Middle Band. Traditional is simple with Overbought and Oversold colors change.
- RSI Bullish Band: Allows the user to plot extra/optional RSI band on RSI Oscillator (Note: it will not be plotted if "OB/OS Zone only" enabled from "OB/OS Zone Settings" section)
- RSI Bearish Band: Allows the user to plot extra/optional RSI band on RSI Oscillator (Note: it will not be plotted if "OB/OS Zone only" enabled from "OB/OS Zone Settings" section)
+ Primary RSI Smooth Settings ▾
- Smooth Moving Average Type: User selected Smooth MA type. With RSI Smooth enabled, will also effect all RSI Divergences detection (all divergences will be plot according to "Smoothed RSI line")
- Smooth Moving Average Length: User input Smooth MA length value
+ Oscillator Moving Average Settings ▾
- Osc Moving Average Colors: Allows user to select Bullish/Bearish colors of Oscillator Moving Average
- Osc Moving Average Type: Allows user to select Oscillator MA Type
- Osc Moving Average Length: User input Oscillator MA length value
- Osc Moving Average Thickness: User input Oscillator MA thickness
- BB StdDev: user input Bollinger Bands standard deviation value
+ Stochastic Oscillator Settings ▾
- Same as Traditional/Default indicator
+ Stochastic RSI Oscillator Settings ▾
- Same as Traditional/Default indicator
+ Money Index Flow Settings ▾
- Same as Traditional/Default indicator
+ Ultimate Oscillator Settings ▾
- Same as Traditional/Default indicator
+ Momentum Oscillator Settings ▾
- Same as Traditional/Default indicator
+ Average True Range Settings ▾
- Same as Traditional/Default indicator
+ Multi Timeframe RSI Settings ▾
- MTF RSI Time Frame: Allows user to select MTF RSI Time Frame
- MTF RSI Symbol: Allows user to select MTF RSI Time Symbol
- MTF RSI Length: User input MTF RSI length value
- MTF RSI Source: User selected MTF RSI source
- MTF RSI Line Width: User input MTF RSI line thickness value
- Number of Bars for MTF RSI plot
- MTF RSI Color > OB color > OS color : Allows user to select MTF RSI color with additionally Overbought/Oversold colors
+ MTF RSI Panel Settings ▾
- Select MTF RSI Type: If "Primary RSI" or "Volume RSI" selected MTF RSI Panel will show output values based on "Primary RSI" or "Volume RSI" parameters e.g. source, length, but without smooth.
- MTF RSI Panel Symbol: Allows user to select MTF RSI Panel symbol, leave symbol blank or uncheck "checkbox" for current chart symbol
- Show Symbol in Panel: Shows symbol ticker(current or user selected) in MTF RSI Panel
- Panel Background: Allows user to select MTF RSI Panel Background (enable/disable) and Background color selection
- TF1: MTF RSI Timeframe 1 user selection
- TF2: MTF RSI Timeframe 2 user selection
- TF3: MTF RSI Timeframe 3 user selection
- TF4: MTF RSI Timeframe 4 user selection
- TF5: MTF RSI Timeframe 5 user selection
- TF6: MTF RSI Timeframe 6 user selection
- TF7: MTF RSI Timeframe 7 user selection
- TF8: MTF RSI Timeframe 8 user selection
- Panel Top Offset: MTF RSI Panel offset input value
- Position: MTF RSI Panel position selection
- Text Size: MTF RSI Panel text size selection
- Bullish Colors: MTF RSI Panel bullish color selection. (Bullish colors range RSI >75, <75 to >65, <65 to >55)
- Bearish Colors: MTF RSI Panel bearish color selection. (Bearish colors range RSI <45 to >35, <35 to >25, <25)
+ RSI Price Estimator Settings ▾
- Price 1: User input value for RSI future price
- Price 2: User input value for RSI future price
- Price 3: User input value for RSI future price
- Panel Position Offset: User input value for panel position offset
- Price Decimals: User input value for output price decimals in panel
- Show RSI/OscMA cross Price: Enable/Disable RSIxOscillator MA cross future price
- Show RSI Level for Input Price: User input price for future RSI level
- Invisible Background: Enable/Disable Background
Auto Text Color > Auto color change of Panel text according to Dark/Light chart theme
+ Oscillator Support/Resistance Settings ▾
- Show Support line: Allows user to Enable/Disable Oscillator support line
Color > Auto Color: Auto color change of support line according to Dark/Light chart theme
- Show Resistance line: Allows user to Enable/Disable Oscillator resistance line
Color > Auto Color: Auto color display of resistance line according to Dark/Light chart theme
- Lookback lows/highs: User input of Lookback lows/highs value
- Distance threshold: Distance from the line to the low
- Line touch points: Number of points that have to be around the line
- Low/High left bars: User input of Low/High left bars value
- Low/High right bars: User input of Low/High right bars value
- Line style: User selection of line style
- Line thickness: User input of line thickness value
+ Oscillator 1st Divergence Settings ▾
- Divergence Source: User selection of divergence source. "High/Low" (high/low of oscillator/price divergence detection), "Close" (close of oscillator/price divergence detection) and "Both" (Both Close + High/Low of oscillator/price divergence detection). (Note: Traditional Divergence indicator default source is "High/Low")
- Pivot Lookback Right: How many candle to compare on the right side of a candle when deciding whether it is a pivot. The lower the number is, the earlier pivots (and therefore divergences) will be signaled, but the quality of those detections could be lower.
- Pivot Lookback Left: How many candle to compare on the left side of a candle when deciding whether it is a pivot. The lower the number is, the earlier pivots (and therefore divergences) will be signaled, but the quality of those detections could be lower.
- Divergence Max Length (Bars): The maximum length of a divergence (number of bars). If a detected divergence is longer than this, it will be discarded
- Divergence Min Length (Bars): The minimum length of a divergence (number of bars). If a detected divergence is shorter than this, it will be discarded
- Show Divergence as:
- Line Thickness: User input divergence line thickness value
- Label Transparency: it could reduce labels mess on oscillator line, input "100" for label text only without label background
- Labels Text Color: User label text color selection
Auto Text Color > Auto color change of label text according to Dark/Light chart theme
- Bull Divergences: Enable/Disable of Bull divergences
> Color: User selection of Bull divergence color
> Oversold only: It will show Regular Bullish RSI divergences in oversold zone only, RSI oversold threshold can be configure in "Primary RSI Settings" section.
- Bear Divergences: Enable/Disable of Bear divergences
> Color: User selection of Bear divergence color
> Overbought only: It will show Regular Bearish RSI divergences in overbought zone only, RSI overbought threshold can be configure in "Primary RSI Settings" section.
- Hidden Bull Div: Enable/Disable of Hidden Bull divergences
> Color: User selection of Hidden Bull divergence color
- Hidden Bear Div: Enable/Disable of Hidden Bear divergences
> Color: User selection of Hidden Bear divergence color
+ Oscillator 2nd Divergence Settings ▾
- Same as Oscillator 1st Divergence Settings
+ Oscillator 3rd Divergence Settings ▾
- Divergence source: User selection of divergence source . "oscillator" (divergence detection with high/low or close of selected oscillator), "price" (divergence detection with high/low or close of price)
- Bull price source: User selection of Bull price source. Bull price source: "Low" (low of price divergence detection), "Close" (close of price divergence detection) (linked to "price" in "Divergence source")
- Bear price source: User selection of Bear price source. Bear price source: "High" (high of price divergence detection), "Close" (close of price divergence detection) (linked to "price" in "Divergence source")
- Low/High left bars: How many candle to compare on the left side of a candle when deciding whether it is a pivot. The lower the number is, the earlier pivots (and therefore divergences) will be signaled, but the quality of those detections could be lower.
- Low/High right bars: How many candle to compare on the right side of a candle when deciding whether it is a pivot. The lower the number is, the earlier pivots (and therefore divergences) will be signaled, but the quality of those detections could be lower.
- Maximum lookback bars: The maximum length of a divergence (number of bars). If a detected divergence is longer than this, it will be discarded.
- Price threshold: User selection of Price threshold, higher values more lines
- RSI threshold: User selection of RSI threshold, higher values more lines
- Show Lows: Displays lows of RSI
- Show Highs: Displays highs of RSI
- Show Divergence as:
- Line Style:
- Line thickness: User input divergence line thickness value
- Label Transparency: it could reduce labels mess on oscillator line, input "100" for label text only without label background
- Labels Text Color: User label text color selection
Auto Text Color > Auto color change of label text according to Dark/Light chart theme
- Bull Divergences: Enable/Disable of Bull divergences
> Color: User selection of Bull divergence color
> Potential Bull: It will plot potential regular bull divergence with dotted line.
- Bear Divergences: Enable/Disable of Bear divergences
> Color: User selection of Bear divergence color
> Potential Bear: It will plot potential regular bear divergence with dotted line.
- Hidden Bull Div: Enable/Disable of Hidden Bull divergences
> Color: User selection of Hidden Bull divergence color
> Potential H.Bull: It will plot potential hidden bull divergence with dotted line.
- Hidden Bear Div: Enable/Disable of Hidden Bear divergences
> Color: User selection of Hidden Bear divergence color
> Hidden Bear divergence: It will plot potential hidden bear divergence with dotted line.
> Regular Bull oversold only: It will show Regular Bullish RSI divergences in oversold zone only, RSI oversold threshold can be configure in "Primary RSI Settings" section.
> Regular Bear overbought only: It will show Regular Bearish RSI divergences in overbought zone only, RSI overbought threshold can be configure in "Primary RSI Settings" section.
+ Oscillator 4th Divergences Settings ▾
- Upper Length: User pivot input value of draw upper divergence line From
- To Pivot:
- Lower Length: User pivot input value of draw lower divergence line From
- To Pivot:
- Show Divergence as:
- Line Style:
- Line thickness: User input divergence line thickness value
- Label Transparency: it could reduce labels mess on oscillator line, input "100" for label text only without label background
- Labels Text Color: User label text color selection
Auto Text Color > Auto color change of label text according to Dark/Light chart theme
- Bull Divergences: Enable/Disable of Bull divergences
> Color: User selection of Bull divergence color
- Bear Divergences: Enable/Disable of Bear divergences
> Color: User selection of Bear divergence color
- Regular Bull oversold only: It will show Regular Bullish RSI divergences in oversold zone only, RSI oversold threshold can be configure in "Primary RSI Settings" section.
- Regular Bear overbought only: It will show Regular Bearish RSI divergences in overbought zone only, RSI overbought threshold can be configure in "Primary RSI Settings" section.
+ Oscillator HHLL Pivots Settings ▾
- Pivot Length: User input value of HH/LL pivot length
> L.Text Color: User label text color selection
- HH color: User HH Label color selection
- HL color: User HL Label color selection
- LH color: User LH Label color selection
- LL color: User LL Label color selection
+ Oscillator OB/OS Colored Bars Settings▾
- Overbought/Oversold Bars Oscillator: Plots Overbought/Oversold color bars based on RSI, MFI, Stoch, Stoch RSI overbought/oversold threshold conditions separately or combined(when every oscillator reach its OB or OS threshold condition at same time).
- Overbought Bar Color: User RSI OB Bars color selection
- Oversold Bar Color: User RSI OS Bars color selection
+ Primary RSI Range Color ▾
- OB: Overbought Color
- OS: Oversold Color
- Bullish: Bullish Color
- Bearish: Bearish Color
+ Primary RSI Color interpolation ▾
- RSI Color: RSI Color
- OB: Overbought Color
- OS: Oversold Color
+ Primary RSI Center Line Color ▾
- OB: Overbought Color
- Bullish: Bullish Color
- Bearish: Bearish Color
- OS: Oversold Color
+ Primary RSI Traditional Color ▾
- RSI Color: RSI Color
- OB: Overbought Color
- OS: Oversold Color
Osc Overbought/Oversold Zones Settings ▾
- OB/OS Zone Band Lines: Enable/Disable OB/OS Zone Band Lines
- OB/OS Zones only: Only shows OB/OS Zones and disable all RSI band lines except Middle Band. Background will not be effected by this setting.
- Overbought Zone: User input value of Overbought Zone from
> To:
- Oversold Zone: User input value of Oversold Zone from
> To:
Osc Overbought/Oversold Highlights ▾
- Overbought Highlights : Enable/Disable Overbought Highlights
- Oversold Highlights : Enable/Disable Oversold Highlights
- Transparency: Gradient transparency of highlighted area
+ 'Oscillators Color Settings ▾
- Show Osc Symbol label : Enable/Disable of oscillator symbol label. Displays current oscillator symbol, but with "Override Oscillator Symbol" enabled from "Black RSI Dashboard" it will Auto/forcefully displays Override Oscillator Symbol on Oscillator
- Fade out Oscillator line: Fade out the oscillator line color, focusing only the most recent periods prominent for a clearer chart
- Fill Stoch/StochRSI lines: Fills Stoch/Stoch RSI lines
- Oscillator line thickness: user input value of oscillator line thickness
- Oscillator line offset: Shifts the oscillator to the left or to the right on the given number of bars, Default is 0
- OBV Color
- MFI Color
- ATR Color
- UO Color
- MOM Color
- CVD Bullish Color
- CVD Bearish Color
+ Background Setting ▾
- Custom Background Color: User selection of Background color
Authors & Credits: I'd like to THANK to Nabeel Black(myself), LonesomeTheBlue, iFuSiiOnzZ, jmosullivan, zdmre, creengrack, and TradingView for the locally sourced ingredients.
Disclaimer: DYOR. Not financial advice. Not a trading system. I am not affiliated with TradingView or any authors mentioned here; You alone have the sole responsibility of evaluating the script output and risks associated with the use of the script. Trading success is all about following your trading strategy and the indicators should fit within your trading strategy, and not to be traded upon solely. Always trade with confluence and Risk Management.
Feedback & Bug report
if you found any bug in this indicator or any suggestion, please let me know. Please give feedback & appreciate if you like to see more future updates and indicators. Thank you

Strength Index I2-SIIdea:
Enhance the Stoch RSI with DMI to get the visualization of the strength movement.
Concept:
(Note that we take the close to get the closing price).
-Combination of 2 Stoch RSI (using value K): 1 is UP, 1 is DOWN (these settings have been customized).
-Every time they cross, it calculates the direction of 3 nearly previous crossings to get the color of the current line.
-The value has been re-calculated with the processed value from ADX and DI- (That's why it can be more than 100 or -100 in some cases).
-RSI Overbuy and oversell are removed because the value could be beyond it.
How it works:
1. The line is show as the strength index of bars
- Green means the up strength is strong.
- Red means the down strength is strong.
- Gray means the previous strength is getting week.
2. This one can be used to find divergence.
3. This indicator provides a warning signal when the color of the line changes:
- Change color:
+Turn red: "Down Red"
+Turn green: "Up Green"
+Turn gray: "Down Gray"/"Up Gray"
Suitable time frames:
15m, 4h, 1D, 1W
* Please note that this logic does not attempt to predict future prices or 100% accurate signal.
(INVITE ONLY indicator. Please direct message or visit website if you want to try it out)
Hope you guys enjoy!
Examples:
BTCUSD 1D
XAUUSD 4H
EURUSD 1H
SPX 15m

RSI Pull-BackA pull-back occurs whenever the price or the value of an indicator breaks a line and comes back to test it before continuing in the prevailing trend.
The RSI has oversold and overbought levels such as 20 and 80 and whenever the market breaks them returns to normality, we can await a pull-back to them before the reversal continues.
This indicator shows the following signals:
* A bullish signal is generated whenever the RSI surpasses the chosen oversold level then directly shapes a pull-back to it without breaking it again.
* A bearish signal is generated whenever the RSI breaks the chosen overbought level then directly shapes a pull-back to it without surpassing it again.

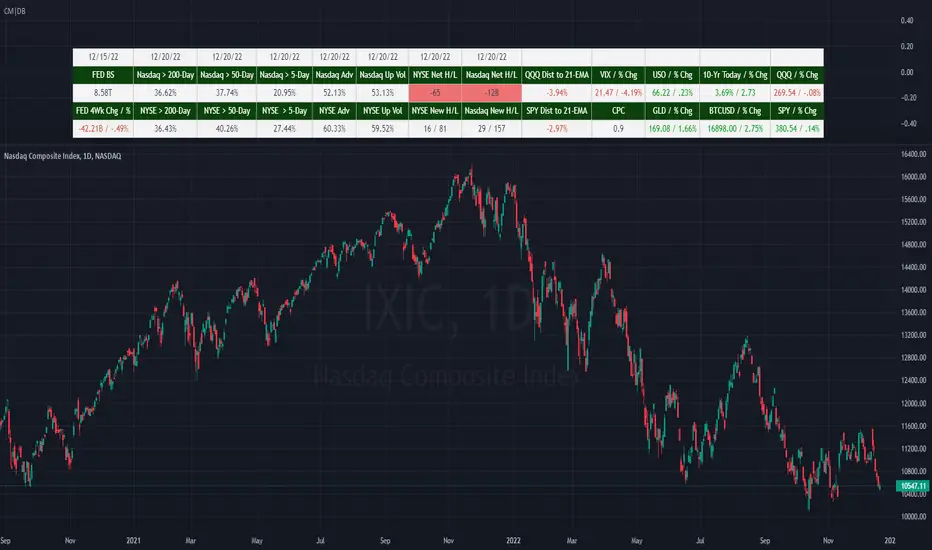
Market Breadth: Trends & BreakoutsVisualize the percentage of stocks in an index participating in trends and breakouts/breakdowns.
The default data source is the S & P 500: the percent of stocks above/below the 200 and 50 day moving averages, and the percentage of stocks making new 52 week breakouts/breakdowns. You can pick new data sources in the settings.
The blue band represents the percentage of stocks above/below the 200 day moving average. (It's always 100% in width, unlike say Bollinger bands). The thin blue lines are the same but for the 50 day moving average. The red and green areas represent the percentage of stocks making new 52 week highs/lows.
In the example chart you can see a divergence between the market as a whole which continues up and to the right throughout 2021, where as fewer and fewer stocks were above their own 200 day moving average, causing the blue band to trend down. Before the market turns beginning 2022 you can see more stocks making new 52 week lows, even as other stocks make 52 week highs. After the market tops, the percentage of 52 week lows intensifies and the percentage of stocks below their 200 day moving average is already over 50%.

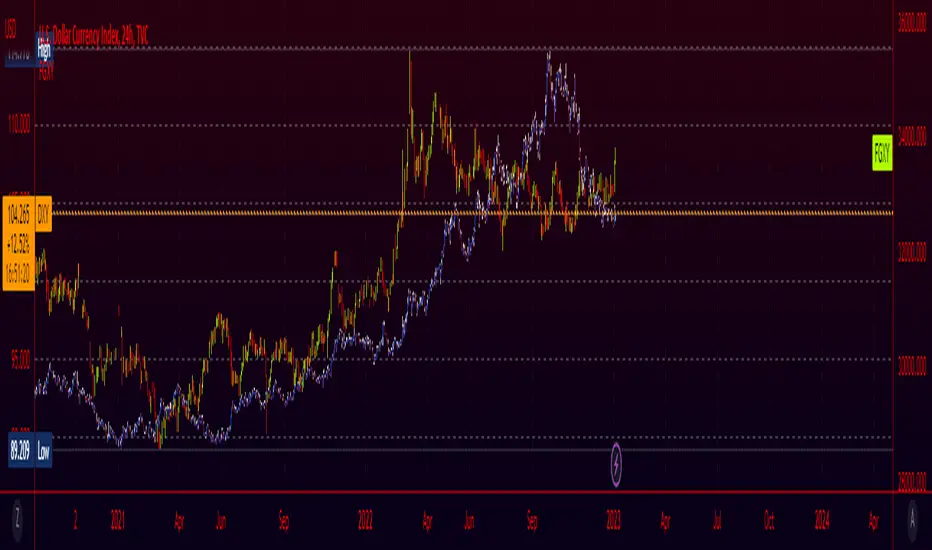
Fiat Currency and Gold Indices (FGXY) CandlesA modification of my previous indicator "Crypto Index (DXY) Candles". The idea was to create a similar currency basket to the standard DXY, but from the perspective of other currencies. Still using the standard DXY weights, this indicator allows you to create a tailored index for other currencies, provided that a currency pair exists for each of the 6 components. This means that even currencies that aren't included should work in theory; just find the 3 character currency prefix used by tradingview and give it a shot! This indicator is useful for gauging how well countries/currencies are holding up and when paired with the standard DXY may help see potential inflection points. For use on longer time frames (~1h-~3d) as some of the data being pulled seems to have issues on lower timeframes.
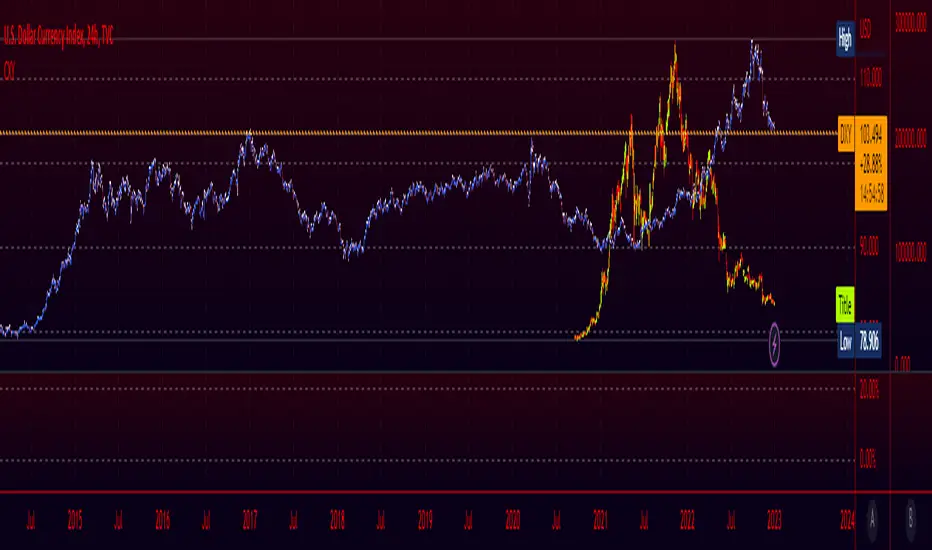
Crypto Index (DXY) CandlesA modification of @loxx's "Dollar Index (DXY) Candles" allowing for a user selected basket of tickers using the same weights as the standard DXY. Ticker Inputs are in descending order so highest weight is at the top by default, although weighting can be changed manually by modifying the symbol's corresponding weight input in the settings. The Idea was to get a bird's eye view of the crypto space using some of the more relevant names in the space. User's can use the toggle in the settings for viewing the default DXY for comparison. Indicator should be used as a confirmation when looking at long term trend changes in the space, shorter time frames may, or may not be as useful.
RSI Candle Advanced V2RSI Advanced
As the period value is longer than 14, the RSI value sticks to the value of 50 and becomes useless.
Also, when the period value is less than 14, it moves excessively, so it is difficult for us to see the movement of the RSI .
So, using the period value and the RSI value as variables, I tried to make it easier to identify the RSI value through a new function expression.
This is how RSI Advanced was developed.
Period below 14 reduce the volatility of RSI , and period above 14 increase the volatility of RSI, allowing overbought and oversold zones to work properly and give you a better view of the trend.
By applying the custom algorithm so that the 'RSI Advanced' with period on a 5-minute timeframe has the same value as the 'original RSI' with period on a 60-minute timeframe.
As another example, an 'RSI Advanced' with a period in a 60-minute time frame has the same value as an 'original RSI' with a period in a 240-minute time frame.
Compare the difference in the RSI with a period value of 200 in the snapshot.
------------------------------------------------------------------------------------------
RSI Candlestick
RSI derives its value using only the closing price as a variable.
I solved the RSI equation in reverse and tried to include the high and low prices of candlesticks in the equation.
As a result, 'if the high or low was the closing price, the value of RSI would be like this' was implemented.
Just like when a candle comes down after setting a high price, an upper tail is formed when RSI Candle goes down after setting a high price!!
In divergence, we had to look only at the relationship between closing prices, but if we use RSI candles, we can find divergences in highs and highs, and lows and lows.
Existing indicators could not express "gap", but Version 2 made it possible to express "gap"!!!!!!
RSI can be displayed as candlesticks, bars and lines
Then enjoy my RSI!
----------------------------------------------------------------------------------------
RSI Advanced
기간값이 14보다 길어질수록 RSI값은 50값에 달라붙게 되어서 쓸모가 없어집니다.
또 기간값이 14보다 줄어들수록 과도하게 움직여서 우리는 RSI의 움직임을 보기가 힘듭니다.
그래서 기간 값과 RSI 값을 변수로 사용하여 새로운 함수 식을 통해 RSI 값을 식별하기 편하도록 해보았습니다.
이렇게 RSI Advanced가 개발되었습니다.
기간값이 14보다 낮으면 rsi의 변동폭이 줄어들고, 기간값이 14보다 크면 변동폭이 넓어져 과매수 및 과매도 영역이 제대로 작동하여 추세를 더 잘 볼 수 있습니다.
또한 저는 5분 타임프레임의 기간값이 168(=14*12)인 RSI가 주기 값이 14인 60분 타임프레임의 RSI와 동일한 값을 갖도록 적절한 함수 표현식을 적용하여 RSI를 변경했습니다.
다른 예로, 15분 시간 프레임에서 기간값이 56(=14*4)인 RSI는 60분 시간 프레임의 기간값이 14인 RSI와 동일한 값을 갖습니다.
기간값이 200인 RSI의 차이를 스냅샷에서 비교해보십시오.
-----------------------------
RSI Candlestick
RSI는 종가만을 변수로 사용하여 값을 도출해냅니다.
저는 RSI 식을 역으로 풀어내어서 캔들스틱의 고가와 저가, 시가를 식에 포함시켜보았습니다.
결과적으로, '만약 고가나 저가가 종가였다면 RSI의 값이 이럴것이다'를 구현해내었습니다.
캔들이 고가를 찍고 내려오면 윗꼬리가 생기듯 RSI Candle에서도 고가를 찍고 내려오면 윗꼬리가 생기는겁니다!!
다이버전스 또한 원래는 종가끼리의 관계만 봐야했지만 RSI 캔들을 이용한다면 고가와 고가, 저가와 저가에서도 다이버전스를 발견할 수 있습니다.
기존의 지표는 "갭"을 표현하지 못했지만 Version 2 에서는 "갭"을 표현할 수 있게 만들었습니다!!!!!!
그럼 잘 사용해주십시오!!!

(CM|DB) Caruso Market DashboardThe Caruso Market Dashboard (CM|DB) provides a snapshot of key US market data, market internals (breadth), and economic statistics. It displays real-time prices of seven major markets along with daily updates of the put/call ratio and multiple breadth measurements. Lastly, it displays the Federal Reserve’s balance sheet and 4-week change of assets held to help investors keep abreast of important FED changes in policy.
Presented for both the Nasdaq and NYSE composites and updated at the end of each trading day, the market breadth section shows:
· the number of net 52-week highs and lows
· the actual number of new 52-week highs and 52-week lows.
· The percentage of volume traded on up stocks vs. total volume
· The percentage of stocks advancing vs. all stocks
· Percentage of stocks above their 5-day average
· Percentage of stocks above their 50-day average
· Percentage of stocks above their 200-day average
In addition to presenting all of this valuable information in a table, users can hide the table and plot each market and economic data point. This is very helpful when viewing trends as well as overbought and oversold levels for these data points.
Integrated Implied Volatility C/FThe integrated version of IV CAP/FLOOR Premium and Bitcoin IV C/F.
Illustrating Cap-Floor bands based on statistical calculations using the implied volatility of Bitcoin, foreign currency pairs, commodities, bonds, and indexes.

Investing ZonesInvesting Zones indicator shows the areas where LONGS or SHORTS can be made, the areas are calculated based on the mathematical averages of the high and low peaks of the price.
-There is an area called "No trading Zone" where the price is too slow, It also has a Alma Trend Ribbon (blue for uptrend, pink for downtrend) that helps to make trading decisions.
-You can make shorts when the price enters the Yellow zone called the "Sell Zone" and the price is below the Alma trend, set the TP1 in the white dotted line, and TP2 in the white lower line
-You can make longs when the price enters the Green zone called the "Buy Zone" and the price is above the Alma trend, set the TP1 in the yellow dotted line, and TP2 in the yellow upper line
-It works in all timeframes, personally I use it in 1min, 5min and 1hr.

Price Average ZonesThis indicator shows the areas where LONGS or SHORTS can be made, the areas are calculated based on the mathematical averages of the high and low peaks of the price.
It also has a line that shows the average of the price movement. you can make shorts when the price enters the orange zone called the "Short Zone".
You can make longs when the price enters the orange zone called the sell zone.
It works in all timeframes, personally I use it in 1 min and in 1 hour.

Uber VQ - Volatility Quality Index [UTS]Name: Uber VQI - Volatility Quality Index
Created: 2022/11/22
Copyright: © UberTradingSystems
Description:
The volatility quality index was first introduced by Thomas Stridsman in Technical Analysis of Stocks and Commodities magazine in the August 2002 edition.
This powerful indicator points out the difference between bad and good volatility in order to identify better trade opportunities in the market.
It is suggested to use this indicator as a confirmation signal together with the other indicators in your system.
General Usage
Stridsman suggested buying (or "to go long") when VQ has increased in the previous 10 bars and selling (or "to go short") when it has decreased in the previous 10 bars.
This indicator has been updated to reflect its modern iterations. One of the following signals are choosable trading signal generator:
VQ Sum
Short MA
Long MA
All three signal triggering conditions can selectively be drawn on the indicator for study and reference purposes.
In addition, generated buy and sell signals can be drawn on the indicator and are modifiable too.
Alerts
To allow alert notifications, generated signals are connected as selectable "Long Signal" and "Short Signal" to the indicator alerts.
The conditions can be found on the alert sections of the indicator.
In the menu right to the indicator name, press the three dots and select "Add alert on ...".
Under condition options select one of the following:
Long Signal
Short Signal
It is advised to select "Once per bar close" as alert execution option.
Moving Averages
To fine-tune the "Short MA" and "Long MA" calculation, 16 different Moving Averages are available to choose from:
ALMA (Arnaud Legoux Moving Average)
DEMA (Double Exponential Moving Average)
EMA (Exponential Moving Average)
FRAMA (Fractal Adaptive Moving Average)
HMA (Hull Moving Average)
JURIK (Jurik Moving Average)
KAMA (Kaufman Adaptive Moving Average)
Kijun (Kijun-sen / Tenkan-sen of Ichimoku)
LSMA (Least Square Moving Average)
RMA (Running Moving Average)
SMA (Simple Moving Average)
SuperSmoothed (Super Smoothed Moving Average)
TEMA (Triple Exponential Moving Average)
VWMA (Volume Weighted Moving Average)
WMA (Weighted Moving Average)
ZLEMA (Zero Lag Moving Average)
A freely determinable length allows for sensitivity adjustments that fit your own requirements.

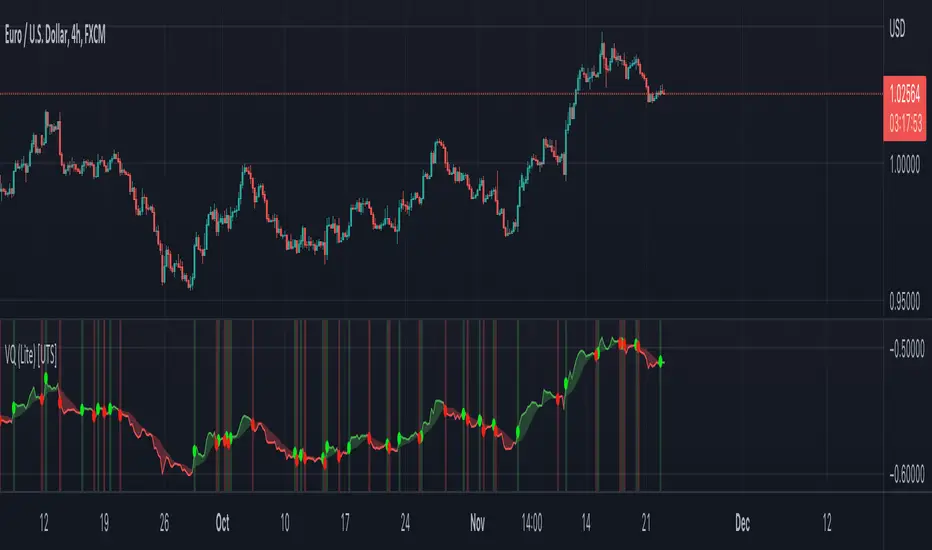
Uber VQ (Lite) - Volatility Quality Index [UTS]Name: Uber VQI (Lite) - Volatility Quality Index
Created: 2022/11/22
Copyright: © UberTradingSystems
Description:
The volatility quality index was first introduced by Thomas Stridsman in Technical Analysis of Stocks and Commodities magazine in the August 2002 edition.
This powerful indicator points out the difference between bad and good volatility in order to identify better trade opportunities in the market.
It is suggested to use this indicator as a confirmation signal together with the other indicators in your system.
Lite Version
Please note that this "Lite" version offers full functionality but is constrained to Euro / US-Dollar trading pairs only.
You can find it as "EURUSD" on many providers such as FXCM, Oanda, Capital.com, Currency.com etc.
If you like this indicator, consider checking out the original. More details under "Author's instructions" and "Signature" sections below.
General Usage
Stridsman suggested buying (or "to go long") when VQ has increased in the previous 10 bars and selling (or "to go short") when it has decreased in the previous 10 bars.
This indicator has been updated to reflect its modern iterations. One of the following signals are choosable trading signal generator:
VQ Sum
Short MA
Long MA
All three signal triggering conditions can selectively be drawn on the indicator for study and reference purposes.
In addition, generated buy and sell signals can be drawn on the indicator and are modifiable too.
Alerts
To allow alert notifications, generated signals are connected as selectable "Long Signal" and "Short Signal" to the indicator alerts.
The conditions can be found on the alert sections of the indicator.
In the menu right to the indicator name, press the three dots and select "Add alert on ...".
Under condition options select one of the following:
Long Signal
Short Signal
It is advised to select "Once per bar close" as alert execution option.
Moving Averages
To fine-tune the "Short MA" and "Long MA" calculation, 16 different Moving Averages are available to choose from:
ALMA (Arnaud Legoux Moving Average)
DEMA (Double Exponential Moving Average)
EMA (Exponential Moving Average)
FRAMA (Fractal Adaptive Moving Average)
HMA (Hull Moving Average)
JURIK (Jurik Moving Average)
KAMA (Kaufman Adaptive Moving Average)
Kijun (Kijun-sen / Tenkan-sen of Ichimoku)
LSMA (Least Square Moving Average)
RMA (Running Moving Average)
SMA (Simple Moving Average)
SuperSmoothed (Super Smoothed Moving Average)
TEMA (Triple Exponential Moving Average)
VWMA (Volume Weighted Moving Average)
WMA (Weighted Moving Average)
ZLEMA (Zero Lag Moving Average)
A freely determinable length allows for sensitivity adjustments that fit your own requirements.
Index OverlayNote: use this indicator only with New York Timezone + you need to understand ICT concepts already, this indicator simplifies the chart work.
Also, in this script I added some open-source scripts from creators here on tradingview, but I forgot to annotate their names...
If you recognize your script, please text me and I'll add your credits.
features
- displays Midnight and Sunday open lines
- day separation (from midnight)
- FVGs
- VWAP (calculated from midnight open)
- daily labels
- TDH & TDL (liquidity)
- trading time window (from 9:30 to 12:00 ny time)
HOW TO USE
Combined with daily bias, the idea is to wait for 9:30 to open, and then wait for a liquidation of TDH (plotted in blue) or TDL (in red).
Once it happens, you can look for ICT buy / sell model, ideally in the 5m TF.

Alex's Dikfat Velocity 2hr CCI Color SignalerAlex's Dikfat Velocity 2hr CCI Color Signaler
As most traders have experienced at one time or another, over bought and oversold readings are relative in nature and do not always work as a standalone reading.
Momentum indicators such as the Commodity Channel Index ( CCI ) have to be understood and read correctly to determine the value in a momentum reading.
When an asset is "Overbought" or "Oversold" the reading can remain in this region Irrationally for extended periods as the market remains in irrational trend.
In order to better understand this and other readings on a momentum indicator clues such as divergence, exhaustion, continuation, time and frequency as well as the actual velocity of the movement must be measured. In addition, there are very specific measurement lines on the CCI that must be read and that can reject or break and result in the asset either loosing or gaining momentum in one direction or the other. These are the dashed lines in the background.
For the purposes of this Indicator, the actual function, characterization and use of CCI will not be explained here as the colored indications themselves will do all the work for you.
It is very important to know that the calculations used to signal the color filling ARE NOT based on simple breaks of the dashed background lines as traditionally read with a CCI indicator.
The calculations used in this Indicator are based on a very fine tuned mathematical algorithm that measure an unseen element within the CCI . When the VELOCITY of a move in momentum is met, the color fills will begin. When the VELOCITY of the move changes, so to will colorization. This has led to some of the best High Probability Long and Short Sale signaling in any CCI indicator. Pairing this with your favorite chart indicators and personal analysis will result in high tradability but can also be used stand alone.
Remember: No one single indicator should ever be used to determine market signaling.
A basic understanding of a CCI indicator is recommended before using this indicator.
This indicator and the proprietary calculations used were built and meant to be used on the 2 Hour Timeframe. The indicator is open to all time frames and accuracy increases as the time frame increases.
It is recommended that if you use this indicator on a lower timeframe, to pull CCI readings from a higher Timeframe as found in the settings.
This indicator signals long and short opportunities. High Probability long and short trades, bullish and bearish divergence building, market time traps and bullish / bearish continuation as well as exhaustion of these moves.
There is also a companion indicator which will signal the High Probability Long and Short trades on the candle chart called "Alex's Dikfat CCI Equity Signaler" Which will place white Triangles on the candle chart showing high probability long entries and Orange Triangles for High Probability short entries. These are also built into the CCI line and can be turned on in this indicator.
Color Code:
Bullish Continuation: (Background Color Black)
The function of the black background colorization is to alert the user that a bullish move has begun and is currently in a strong continuation period. the longer the black background color draws, the more sustained or trending up the current move is. When these background lines begin to break and start to appear as more frequent broken background lines, exhaustion in the move can be assumed. When the black stops drawing all together, the strength of the continuation move is gone.
Bearish Continuation: (Background Color Fuchsia)
The function of the fuchsia background colorization is to alert the user that a bearish move has begun and is currently in a strong continuation period. the longer the fuchsia background color draws, the more sustained or trending down the current move is. When these background lines begin to break and start to appear as more frequent broken background lines, exhaustion in the move can be assumed. When the fuchsia stops drawing all together, the strength of the continuation move is gone.
High Probability Long/Short:
These buy and sell opportunities were designed to give a trader the best signal/entry on a Long or a Short with the highest probability of making a large and typically sustained impulse move.
High Probability Long: (White Color Fill)
The High Probability Long is a signal to BUY with the best possible entry on an a pending large impulse move to the upside. When White begins to fill, The long is extremely likely. The signal is confirmed on the close of the following candle after white begins to draw unless an opposing color immediately follows, or white dips below the zero line. White will always usually start just below the zero line in the highest probability scenarios.
High Probability Short: (Orange Color Fill)
The High Probability Short is a signal to SELL SHORT with the best possible entry on a pending large impulse move to the downside. When Orange begins to fill, The Short is extremely likely. The signal is confirmed on the close of the following candle after orange begins to draw unless an opposing color immediately follows. Some of the best entries for Orange are when it starts at the END of a black stripe in the background and better so when Orange dips below zero for entry. The signal was designed to color early enough to get in a short during consolidation before the move.
Long and Short Opportunities: Long and Short opportunities are just as they sound. Coloring will signal green for a long opportunity and red for a short opportunity. These opportunities are not always guaranteed and usually result in an lesser impulse move in one direction with a shorter duration.
Long Opportunity: (Green)
The Long Opportunity is a signal that a Long is possible however with less likely odds of a larger more sustained move. When Green begins to fill, a long opportunity is available. The signal is confirmed on the close of the following candle after green begins to draw unless an opposing color immediately follows, or green dips below the zero line. Green will always usually start just above the zero line and have the best opportunities at the end of Bullish Divergence (Blue) at the end of Bearish Continuation (Fuchsia) or a non filled CCI .
Short Opportunity: (Red)
The Short Opportunity is a signal that a Short is possible however with less likely odds of a larger more sustained move. When Red begins to fill, a short opportunity is available. The signal is confirmed on the close of the following candle after red begins to draw unless an opposing color immediately follows. Some of the best entries for Red are when it starts at the END of a black stripe in the background (higher odds than other red signaling). The signal was designed to color early enough to get in a short during consolidation before the move and better so if orange develops after red.
Bullish Divergence: (Dark Blue)
Dark Blue colors when Bullish Divergence is detected. Bullish divergence is a signal that momentum is building higher within the asset for an up move while price action in the candle chart makes lower lows. Bullish Divergence is not a signal to buy or sell but rather a sign post to say WAIT. Bullish divergence is building and a Long is coming. Some traders will buy bullish divergence in anticipation of a move and is only equitable if you have the cash and resolve to follow it through for as long as it is developing. Buying or selling divergence right away is not always the best practice unless a hard dip below all momentum lines followed by an immediate buy signal from white or green resulting in a drop base rally.
Bearish Divergence: (Dark Maroon)
Dark Maroon colors when Bearish Divergence is detected. Bearish divergence is a signal that momentum is dropping out of the asset for a move lower while price action in the candle chart makes higher highs. Bearish Divergence is not a signal to buy or sell but rather a sign post to say WAIT. Bearish divergence is building and a Short is coming. Some traders will sell bearish divergence in anticipation of a move and is only equitable if you have the cash and resolve to follow it through for as long as it is developing. Buying or selling divergence right away is not always the best practice unless a hard rip above all momentum lines followed by an immediate sell signal from red or orange resulting in a rally base drop.
No Color Fill:
When CCI has no color fill whatsoever it is telling the trader there are no high velocity movements in momentum in any direction. Best practice is to do nothing and wait out the Time Trap currently on the chart until signaling develops.
Time and Frequency:
Time and frequency is notable throughout the indicator. First and foremost when CCI is not being filled it is best practice to do nothing as there is NO Velocity of Movement within the asset at that time. This is one of the most obvious of Time Traps.
Bullish and Bearish Divergence is also a type of Time Trap. The longer these develop, the more weak hands are shaken out of the market and derivatives traders have their premium burned. Best practice with divergences is also to wait until adequate signaling develops, or be willing to buy or sell the appropriate divergence by accumulating or distributing for as long as it develops; or simply to buy/sell and hold for the move.
Any Sustained color for extended periods of time is also a time trap signaling to the trader that the asset is being irrational in its present move.
Bullish and Bearish Continuation:
These also deal with time and frequency most importantly. When we are on a sustained Bull Run, black will color in the background continuously. When the black starts to barcode or break up, exhaustion of the bull run is assumed as the frequency of the run becomes erratic. Inversely, When we are on a sustained Bear Run, fuchsia will color in the background continuously. When the fuchsia starts to barcode or break up, exhaustion of the bear run is assumed as the frequency of the run becomes erratic.
The color scheme is designed to be read from darkest to lightest when a sequence of events is found. I.E Dark Maroon>Red>Orange or Inversely Dark Blue>Green>White
In keeping with the best practices and traditions of TradingView, we have published this as a public script with the best intentions of aiding the TradingView community in unique and valuable ways. While some of our best indicators are by invite only, we feel an addition to the community of this magnitude will add to the fabric and substance of community.

[TTI] Stage Analysis Alert IndexHISTORY AND CREDITS –––––––––––––––––––––––––––––––––––––––––––––––––––––––
The script is created based on lessons and interviews from Stan Weinstein. The Alert Index is being used by Stan and his team to gauge the general markets.
WHAT IT DOES– ––––––––––––––––––––––––––––––––––––––––––––––––––––––
This is an internal fundamental indicator that Stan and its team uses, that gauges the relationship between the 3 month T bill yield and the AAA bonds. The indicator uses the 3 colored system to determine favorable trading conditions in the market.
🟨 Yellow – OK conditions
🟩 Green – Great conditions
🟥 Red – Unfavorable conditions
Remember this is a fundamentals indicator and looks at the market from a much more macro picture.
HOW TO USE IT –––––––––––––––––––––––––––––––––––––––––––––––––––––––––––––
The indicator is to be used in order to determine the agressiveness of the position sizing in the market. Green conditions show very favorable market for long positions and yellow show ok conditions. However, during red condition the trader is advised not to be aggressively exposed in the market

MTF Commodity Oddity Index (CCI+)MTF Commodity Oddity Index (CCI+)
This chart overlay indicator is based upon the Commodity Channel Index (CCI) and can signal multiple triple-timeframe CCI overbought and oversold confluences directly onto your chart, intended for use as a confluence either for reversal trade entries, or potential trade exits, indicating where price may be probable to reverse.
Features include:
- Primary set of fully configurable triple-timeframe overbought and oversold signals, indicating where 3 selected timeframes are all overbought or all oversold at the same time. Enabled by default.
- Secondary set of fully configurable triple-timeframe overbought and oversold signals, indicating where 3 selected timeframes are all overbought or all oversold at the same time. Enabled by default.
- Optional drawing of background colours and/or ribbon seen at bottom of the chart image.
- The default primary MTF #1 timeframes are set to 1 minute, 5 minute and 15 minute. These are highly suitable for low timeframe scalpers trading on < 5m charts, and can often pin point price reversals.
- The default Secondary MTF #2 timeframes are set to 15 minute, 30 minute and 120 minute. These are suitable for both low timeframe scalpers and considerably higher timeframe traders.
- Independent alerts for MTF #1 and MTF #2 triple-timeframe confluences, including options for alerting MTF overbought and MTF oversold individually, as well as an option for alerting either overbought or oversold in a single combined alert.
- Also includes standard configurable CCI options, including CC length and source type.
Note: The features listed above are accurate at the time of publishing but maybe updated or added to in future.
A similar MTF CCI indicator is also available as a panel indicator here .
This indicator is based upon the original MTF Fantastic Stochastic (FS+) available here .
What is the Commodity Channel Index (CCI)?
Investopedia has described the popular oscillator as follows:
“The Commodity Channel Index (CCI) is a momentum-based oscillator used to help determine when an investment vehicle is reaching a condition of being overbought or oversold.
Developed by Donald Lambert, this technical indicator assesses price trend direction and strength, allowing traders to determine if they want to enter or exit a trade, refrain from taking a trade, or add to an existing position. In this way, the indicator can be used to provide trade signals when it acts in a certain way.”
You can read more about the CCI , its use cases and calculations here .
How do traders use overbought and oversold levels in their trading?
The oversold level, that is traditionally when the CCI is above the 100 level is typically interpreted as being 'overbought', and below the -100 level is typically considered 'oversold'. Traders will often use the CCI at an overbought level as a confluence for entry into a short position, and the CCI at an oversold level as a confluence for an entry into a long position. These levels do not mean that price will necessarily reverse at those levels in a reliable way, however. This is why this version of the CCI employs the triple timeframe overbought and oversold confluence, in an attempt to add a more confluence and reliability to this usage of the CCI . While traditionally, the overbought and oversold levels are below -100 for oversold, and above 100 for overbought, the default threshold settings of this indicator have been increased to provide fewer, stronger signals, especially suited to the low timeframes and highly volatile assets.

MTF CCI + Realtime DivergencesMulti-timeframe Commodity Channel Index (CCI) + Realtime Divergences + Alerts
This version of the CCI includes the following features:
- Optional 2x sets of triple-timeframe overbought and oversold signals with fully configurable timeframes and overbought and oversold thresholds, can indicate where 3 selected timeframes are all overbought or all oversold at the same time, with alert option.
- Optional divergence lines drawn directly onto the oscillator in realtime, with alert options.
- Configurable pivot periods to fine tune the divergences drawn in order to suit different trading styles and timeframes, including the ability to enable automatic adjustment of pivot period per chart timeframe.
- Alternate timeframe feature allows you to configure the oscillator to use data from a different timeframe than the chart it is loaded on.
- 'Hide oscillator' feature allows traders to hide the oscillator itself, leaving only the background colours indicating the overbought and oversold periods and/or MTF overbought and oversold confluences, as seen in the chart image.
- Also includes standard configurable CCI options, including CCI length and source type. Defaults set to length 20, and hlc3 source type.
- Optional Flip oscillator feature, allows users to flip the oscillator upside down, for use with Tradingviews 'Flip chart' feature (Alt+i), for the purpose of manually spotting divergences, where the trader has a strong natural bias in one direction, so that they can flip both the chart and the oscillator.
- Optional 'Fade oscillator' feature, which will fade out all but the most recent period, reducing visual noise on the chart.
While this version of the CCI has the ability to draw divergences in realtime along with related alerts so you can be notified as divergences occur without spending all day watching the charts, the main purpose of this indicator was to provide the triple-timeframe overbought and oversold confluence signals, in an attempt to add more confluence, weight and reliability to the single timeframe overbought and oversold states, commonly used for trade entry confluence. It's primary purpose is intended for scalping reversal trades on lower timeframes, typically between 1-15 minutes, which can be used in conjunction with the regular divergences the indicator can highlight. The triple timeframe overbought can often indicate near term reversals to the downside, with the triple timeframe oversold often indicating neartime reversals to the upside. The default timeframes for this confluence are set to check the 1m, 5m and 15m timeframes together, ideal for scalping the < 15 minute charts. The default settings for the MTF #1 timeframes (1m, 5m and 15m) are best used on a <5 minute chart.
Its design and use case is based upon the original MTF Stoch RSI + Realtime Divergences found here .
Commodity Channel Index (CCI)
Investopedia has described the popular oscillator as follows:
“The Commodity Channel Index (CCI) is a momentum-based oscillator used to help determine when an investment vehicle is reaching a condition of being overbought or oversold.
Developed by Donald Lambert, this technical indicator assesses price trend direction and strength, allowing traders to determine if they want to enter or exit a trade, refrain from taking a trade, or add to an existing position. In this way, the indicator can be used to provide trade signals when it acts in a certain way.”
You can read more about the CCI, its use cases and calculations here .
How do traders use overbought and oversold levels in their trading?
The oversold level, that is traditionally when the CCI is above the 100 level is typically interpreted as being 'overbought', and below the -100 level is typically considered 'oversold'. Traders will often use the CCI at an overbought level as a confluence for entry into a short position, and the CCI at an oversold level as a confluence for an entry into a long position. These levels do not mean that price will necessarily reverse at those levels in a reliable way, however. This is why this version of the CCI employs the triple timeframe overbought and oversold confluence, in an attempt to add a more confluence and reliability to this usage of the CCI. While traditionally, the overbought and oversold levels are below -100 for oversold, and above 100 for overbought, he default threshold settings of this indicator have been increased to provide fewer, stronger signals, especially suited to the low timeframes and highly volatile assets.
What are divergences?
Divergence is when the price of an asset is moving in the opposite direction of a technical indicator, such as an oscillator, or is moving contrary to other data. Divergence warns that the current price trend may be weakening, and in some cases may lead to the price changing direction.
There are 4 main types of divergence, which are split into 2 categories;
regular divergences and hidden divergences. Regular divergences indicate possible trend reversals, and hidden divergences indicate possible trend continuation.
Regular bullish divergence: An indication of a potential trend reversal, from the current downtrend, to an uptrend.
Regular bearish divergence: An indication of a potential trend reversal, from the current uptrend, to a downtrend.
Hidden bullish divergence: An indication of a potential uptrend continuation.
Hidden bearish divergence: An indication of a potential downtrend continuation.
How do traders use divergences in their trading?
A divergence is considered a leading indicator in technical analysis , meaning it has the ability to indicate a potential price move in the short term future.
Hidden bullish and hidden bearish divergences, which indicate a potential continuation of the current trend are sometimes considered a good place for traders to begin, since trend continuation occurs more frequently than reversals, or trend changes.
When trading regular bullish divergences and regular bearish divergences, which are indications of a trend reversal, the probability of it doing so may increase when these occur at a strong support or resistance level . A common mistake new traders make is to get into a regular divergence trade too early, assuming it will immediately reverse, but these can continue to form for some time before the trend eventually changes, by using forms of support or resistance as an added confluence, such as when price reaches a moving average, the success rate when trading these patterns may increase.
Typically, traders will manually draw lines across the swing highs and swing lows of both the price chart and the oscillator to see whether they appear to present a divergence, this indicator will draw them for you, quickly and clearly, and can notify you when they occur.
Setting alerts.
With this indicator you can set alerts to notify you when any/all of the above types of divergences occur, on any chart timeframe you choose, and also when the triple timeframe overbought and oversold confluences occur.
Configurable pivot period.
You can adjust the default pivot period values to suit your prefered trading style and timeframe. If you like to trade a shorter time frame, lowering the default lookback values will make the divergences drawn more sensitive to short term price action. By default, this indicator has enabled the automatic adjustment of the pivot periods for 4 configurable timeframes, in a bid to optimise the divergences drawn when the indicator is loaded onto any of the 4 timeframes. These timeframes and the auto adjusted pivot periods on each of them can also be reconfigured within the settings menu.
Disclaimer: This script includes code adapted from the Divergence for Many Indicators v4 by LonesomeTheBlue . With special thanks.

[TTI] Stage Analysis Momentum Index––––History & Credit
The credit to this indicator goes to Stan Weinstein, the father of Stage Analysis. By studying his books and methods he has disclosed the exact way of calculating the Momentum Index that is being used by him and his team in order to gauge the market.
–––––What it does
The indicator falls into the category of technical indicators used by Stan. It calculates an simple moving average based on the difference between the Advancing and Declining issues on various markets.
The settings of the indicator allow to adjust the length of the moving average as well to choose 1 of the 3 markets for which it has been scripted to work: NYSE, NASDAQ or Total US Stocks.
–––––How to use it
The indicator ought to be used on the daily chart
The most important thing to look for is if the indicator is if it is above zero and below zero. A below zero Momentum index is an outright bearish signal and traders should consider stepping out of the market or initiate short positions.
The other things that ought to be considered are the depth and length of the prior to a violating action. In a nutshell the longer, stronger the above zero action the more powerful a below zero cross will be.

Relative Strength Index (RSI) + Realtime DivergencesRelative Strength Index (RSI) + Realtime Divergences
This version of the RSI indicator includes the following features:
- Optional divergence lines drawn directly onto the oscillator in realtime.
- Configurable alerts to notify you when divergences occur.
- Configurable lookback periods to fine tune the divergences drawn in order to suit different trading styles and timeframes.
- Background colouring option to indicate when the RSI oscillator has crossed above or below its centerline.
- Alternate timeframe feature allows you to configure the oscillator to use data from a different timeframe than the chart it is loaded on.
- Fadeout oscillator feature will fade out all but the most recent history, leaving your chart free of visual noise.
- Flip oscillator feature can be used with the Tradingview 'Flip chart' feature (Alt+i) in order to flip both the chart and the oscillator, too. This feature is to help traders manually spot divergences that may have a strong natural bias in one direction.
- Optional centerline and range bands.
- Various optional moving average types, bollinger bands etc.
This indicator adds additional features onto the standard RSI whose core calculations remain unchanged. Namely, the configurable option to automatically, quickly and clearly draw divergence lines onto the oscillator for you as they occur in realtime. It also has the addition of unique alerts, so you can be notified when divergences occur without spending all day watching the charts. Furthermore, this version of the RSI comes with configurable lookback periods, which can be configured in order to adjust the sensitivity of the divergences, in order to suit shorter or higher timeframe trading approaches.
What is the Relative Strength Index ( RSI )?
Investopedia describes the Relative Strength Index as follows:
“The relative strength index (RSI) is a momentum indicator used in technical analysis. RSI measures the speed and magnitude of a security's recent price changes to evaluate overvalued or undervalued conditions in the price of that security. The RSI is displayed as an oscillator (a line graph) on a scale of zero to 100. The indicator was developed by J. Welles Wilder Jr. and introduced in his seminal 1978 book, New Concepts in Technical Trading Systems.
The RSI can do more than point to overbought and oversold securities. It can also indicate securities that may be primed for a trend reversal or corrective pullback in price. It can signal when to buy and sell. Traditionally, an RSI reading of 70 or above indicates an overbought situation. A reading of 30 or below indicates an oversold condition.”
The RSI is also commonly used to spot divergences.
You can read more about the RSI and its calculations here
What are divergences?
Divergence is when the price of an asset is moving in the opposite direction of a technical indicator, such as an oscillator, or is moving contrary to other data. Divergence warns that the current price trend may be weakening, and in some cases may lead to the price changing direction.
There are 4 main types of divergence, which are split into 2 categories;
regular divergences and hidden divergences. Regular divergences indicate possible trend reversals, and hidden divergences indicate possible trend continuation.
Regular bullish divergence: An indication of a potential trend reversal, from the current downtrend, to an uptrend.
Regular bearish divergence: An indication of a potential trend reversal, from the current uptrend, to a downtrend.
Hidden bullish divergence: An indication of a potential uptrend continuation.
Hidden bearish divergence: An indication of a potential downtrend continuation.
How do traders use divergences in their trading?
A divergence is considered a leading indicator in technical analysis , meaning it has the ability to indicate a potential price move in the short term future.
Hidden bullish and hidden bearish divergences, which indicate a potential continuation of the current trend are sometimes considered a good place for traders to begin, since trend continuation occurs more frequently than reversals, or trend changes.
When trading regular bullish divergences and regular bearish divergences, which are indications of a trend reversal, the probability of it doing so may increase when these occur at a strong support or resistance level . A common mistake new traders make is to get into a regular divergence trade too early, assuming it will immediately reverse, but these can continue to form for some time before the trend eventually changes, by using forms of support or resistance as an added confluence, such as when price reaches a moving average, the success rate when trading these patterns may increase.
Typically, traders will manually draw lines across the swing highs and swing lows of both the price chart and the oscillator to see whether they appear to present a divergence, this indicator will draw them for you, quickly and clearly, and can notify you when they occur.
Setting alerts.
With this indicator you can set alerts to notify you when any/all of the above types of divergences occur, on any chart timeframe you choose.
Configurable pivot periods.
You can adjust the default pivot periods to suit your prefered trading style and timeframe. If you like to trade a shorter time frame, lowering the default lookback values will make the divergences drawn more sensitive to short term price action.
Disclaimer: This script includes code from the stock RSI by Tradingview as well as the Divergence for Many Indicators v4 by LonesomeTheBlue.
