OPEN-SOURCE SCRIPT
Relative Volume Force Index
ที่อัปเดต:
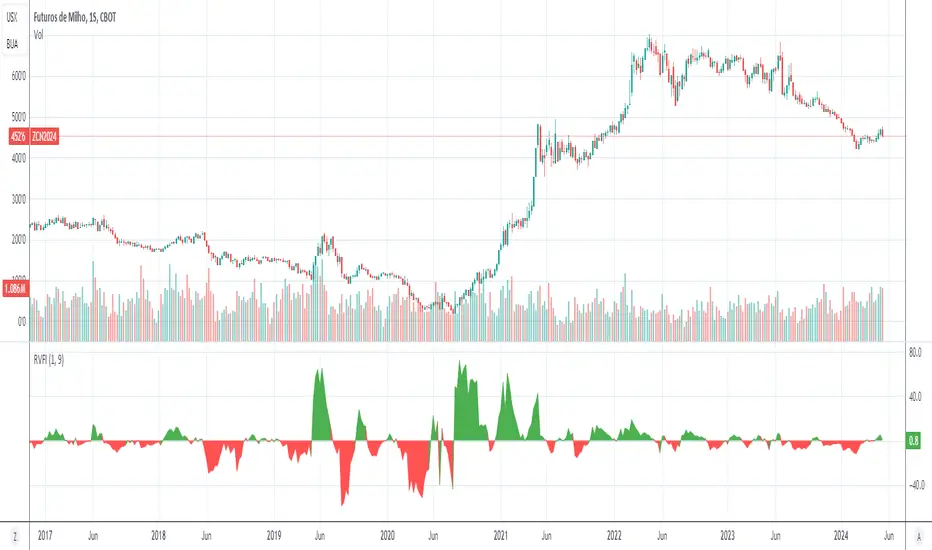
This indicator can anticipate the market movements. Its posible because it calculates how much force (volume) it's necessary to move the price up or down. If it's necessary a lot of volume to move the price a little it's a reversion signal, but if a little volume could change the price whit elevate volatility, it's signal of reversion too. The indicator plots red if the market is down, and green if it's up, the size and the color of the bars cand demonstrate the movement relative force. Does it by the configurable averages. Not works well whit poor liquidity.
เอกสารเผยแพร่
Cleaning the code and insert time start.เอกสารเผยแพร่
Update chart สคริปต์โอเพนซอร์ซ
ด้วยเจตนารมณ์หลักของ TradingView ผู้เขียนสคริปต์นี้ได้เผยแพร่เป็นโอเพนซอร์ส เพื่อให้เทรดเดอร์สามารถเข้าใจและตรวจสอบได้ ต้องขอบคุณผู้เขียน! ที่ให้คุณใช้ได้ฟรี แต่การนำโค้ดนี้ไปใช้ในการเผยแพร่ซ้ำจะต้องอยู่ภายใต้ กฎระเบียบการใช้งาน คุณสามารถตั้งเป็นรายการโปรดเพื่อใช้บนชาร์ตได้
คำจำกัดสิทธิ์ความรับผิดชอบ
ข้อมูลและบทความไม่ได้มีวัตถุประสงค์เพื่อก่อให้เกิดกิจกรรมทางการเงิน, การลงทุน, การซื้อขาย, ข้อเสนอแนะ หรือคำแนะนำประเภทอื่น ๆ ที่ให้หรือรับรองโดย TradingView อ่านเพิ่มเติมที่ ข้อกำหนดการใช้งาน