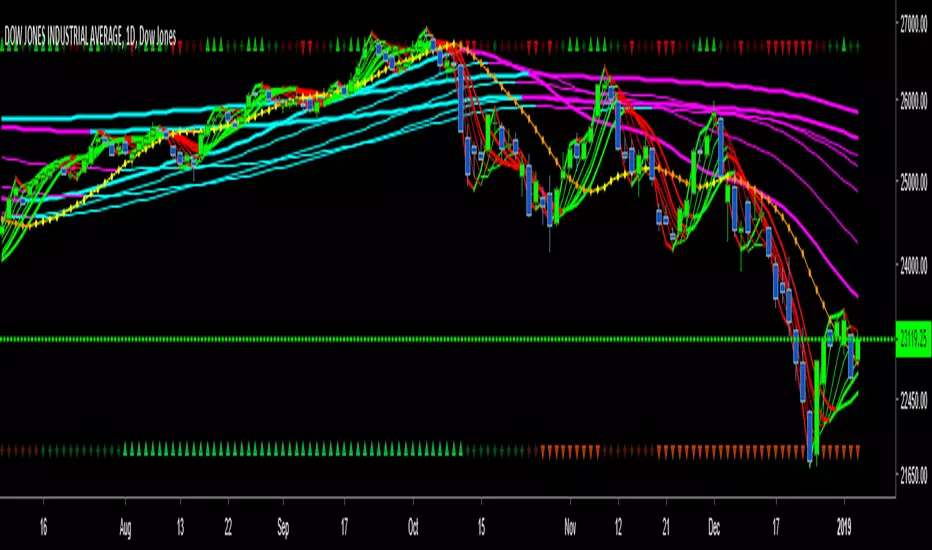
Multiple Moving Average Colors7 moving averages in 1 indicator, including the Hull Moving Average.
I've updated with some graphics that print at the top of the chart (you can change color and placement on the indicator settings page)
All 7 MAs Up - Green and up triangle
All 7 MAs Down - Red and down triangle
4, 5 or 6 MAs Up - Dark green and a square
4, 5 or 6 MAs Down - Maroon and a square
Hullmovingaverage

inwCoin HMA10/50Just simple HMA 10/50 with color change when trend change ( Red = downtrend / Green = uptrend )
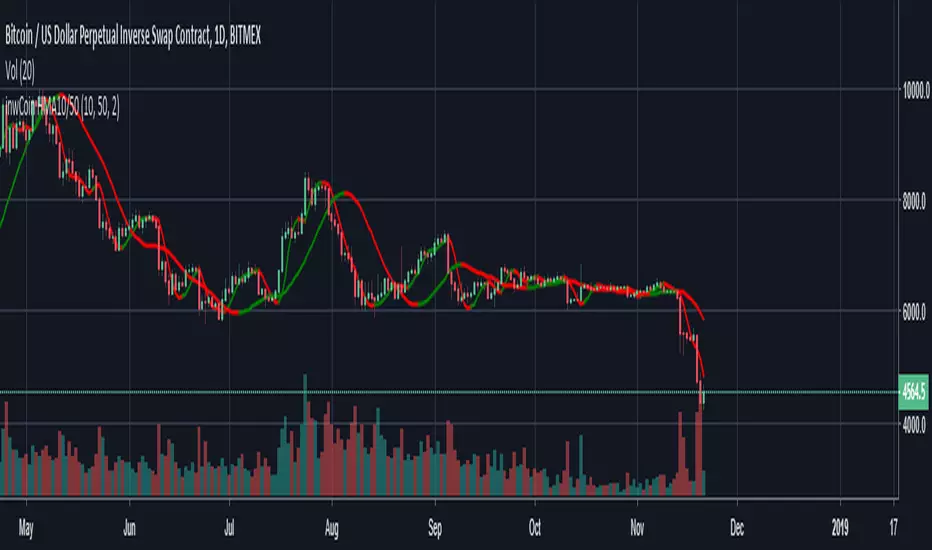
Hull50Signals are based on Hull 50 length
You can change the length if you want it to buy more or less
have fun

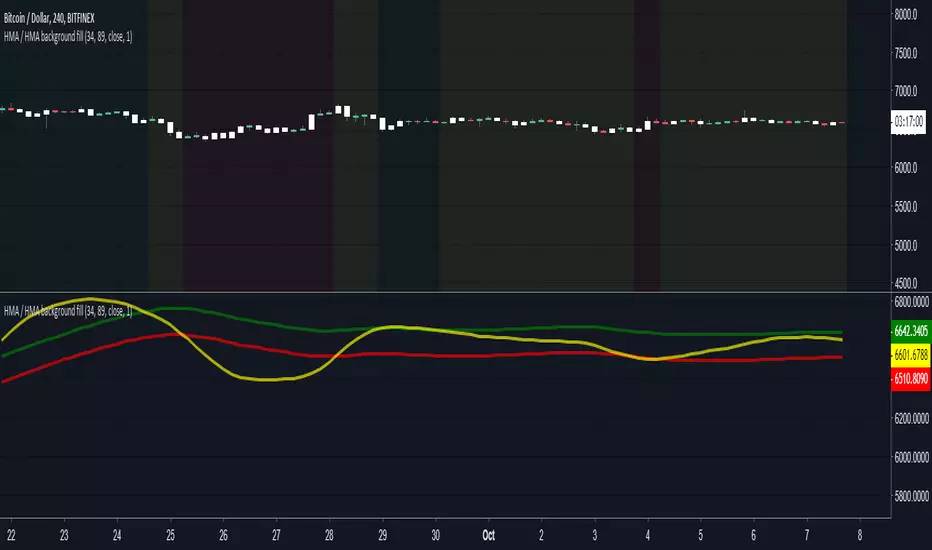
HMA + HMA + Dispersion background fill (ver 2.0)fast HMA • slow HMA • Dispersion Zone| background color's
---
Background colors: Red, Green and Yellow. Default transperent = 5%
• Green background: fast HMA above the dispersion zone
• Red background: fast HMA below the dispersion zone
• Yellow background: fast HMA inside the Dispersion Zone
---
# Alerts only for cross Yellow to Green and Yellow to Red zones.
---
• The dispersion zone is calculated relative to the slow HMA.
Fast - Slow HMA background fillfast HMA • slow HMA | background
---
Background colors: Red and Green. Default transperent = 2%
• Green background: "fastHMA" crossover "slowHMA"
• Red background: "fastHMA" crossdown "slowHMA"

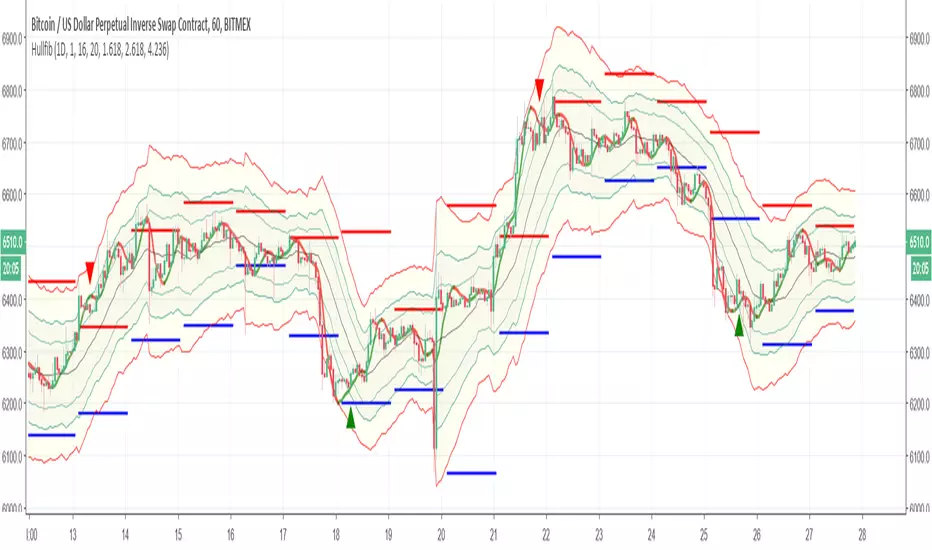
HullfibSo this indicator is just to show a concept
it based on Bollinger type of fibs with regular daily fibs (upper =red,lower= blue) and the signal produce by the Hull moving average
the idea is to compare the regular fibs and the Bollinger type of fibs so it easy in this way to see where the real low and where the real high
the hull moving average can be set to be faster or shorter for the buy signal. since it open code you can add or change what ever you want
have fun
Uncle Mo's Ultimate Ichimoku V1Main features:
2 x Ichimoku Cloud
5 x EMA
2 x MA
1 x HullMA
Williams Fractals
Study is based around trader @br0qn 's Ichimoku script.
Credits also go to:
@RicardoSantos for the Bill Williams Fractals
@EmilianoMesa for the EMAs/MAs
@mohamed982 for the HullMA
The script is open source so please feel free to change it around. I'd greatly appreciate it if you could suggest ways to improve it.
Happy trading!

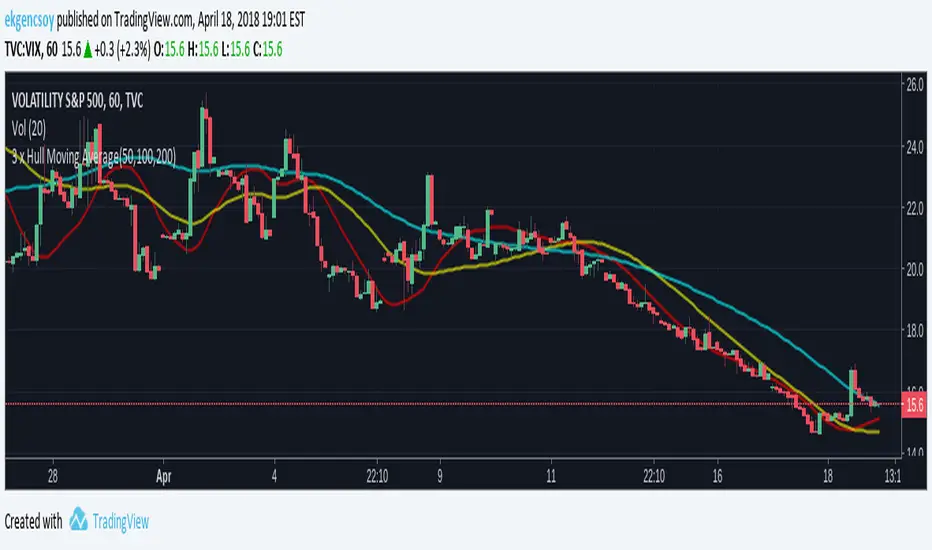
CryptogramTR with OPEN CODEIndicator is obtained by importing RSI(14) into HULL moving average source with 2 different periods, as one is long period and the other is short.
When green line (short period) cross upward the red line (long period) , this is a BUY; vice versa it is a SELL.
When HMA Short Period is set to 1 (one), yielding line is absolutely the same line of RSI (14). You can change it into 8(eight) preferably.
İndikatör, RSI(14) indikatörünün, hull hareketli ortalamasının kod kaynağı olarak atanması ile elde edilmiştir. Uzun ve kısa olmak üzere 2 ayrı periyot kullanılmıştır.
Yeşil çizgi yani kısa periyotlu çizgi, kırmızı yani uzun periyotlu olanı yukarı keserse AL, tersi durum SAT olarak düşünülmelidir.
Hull Kısa Periyodu 1 iken oluşan yeşil çizgi, RSI(14) indikatörünü vermektedir. Kısa periyot olarak tercihinize göre bu değeri 8 olarak da kullanabilirsiniz.

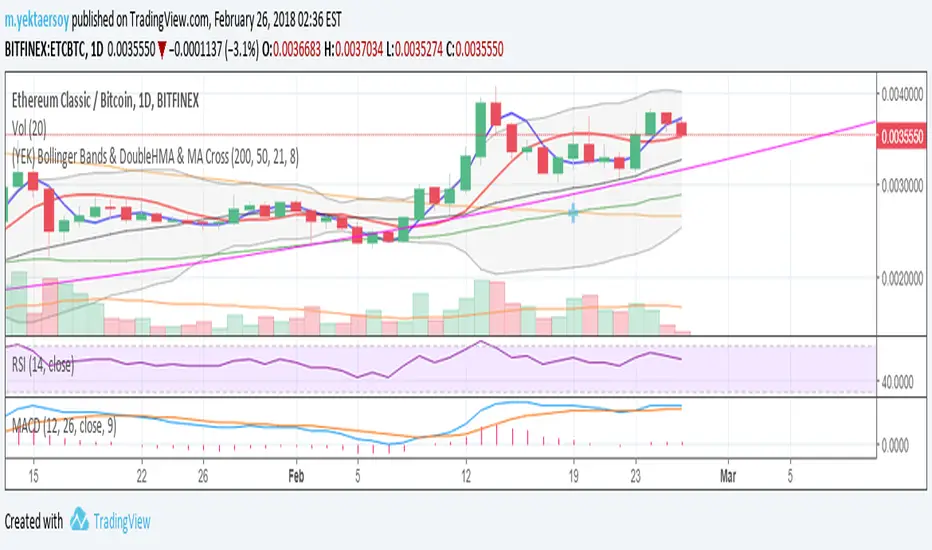
(YEK) Bollinger Bands & DoubleHMA & MA CrossMy favorite indicators ALL-IN-1: Bollinger Bands, Double Hull Moving Average (21,8), Double Moving Average (200,50)
Hull Moving Average + Bollinger BandsThis study make use of Hull Moving Average and Bollinger Bands.
The crosses give signal about HMA and BB crossovers, they are a bit lagging, if you stare well you will spot them a little earlier. It look like a good idea to buy and sell when HMA is near or on the outside of the outer bands.
By default the Bollinger Bands uses Simple Moving Average with 21 periodes, and Hull Moving Average use 9 periodes. You can alter the settings in the format dialog.
Please use as pleased, and if you do something clever with it I'll be happy to know :D


Double HULL Moving AverageTHIS IS A COMBINATION OF TWO HULL MOVING AVERAGE LINES
-ONE WITH LONGER PERIOD
-OTHER WITH SHORTER PERIOD TO INDICATE BUY/SELL SIGNALS
AS THE KNOWN GENERAL RULE;
IT WOULD BE A BUY SIGNAL WHEN SHORTER(BLUE LINE) HULL CROSSES ABOVE LONGER (RED LINE) ONE
AND CONVERSELY A SELL SIGNAL WHEN LONGER HULL CROSSES ABOVE SHORTER ONE
THIS STUFF IS USEFUL FOR USERS COMPLAINING ABOUTREACHING THE MAXIMUM NUMBER OF INDICATORS :)
KıvanÇ
@fr3762 on twitter (only tweeting in TURKISH)
fr3762 on youtube for indicator explanations in TURKISH)
TURKISH EXPLANATION:
2 HULL hareketli ortalaması aynı grafikte:
Kısa periyotlu (mavi) olan uzunu yukarı kestiğinde AL
Uzun periyotlu (kırmızı) olan kısayı yukarı kestiğinde SAT sinyalleri üretir
Varsayılan periyotlar, birer Fibonacci sayıları olan 8 ve 21 olarak belirlenmiştir, değiştirilebilir.
İndikatör sayısı sınırlamasının önüne geçmek amacıyla geliştirilmiştir.

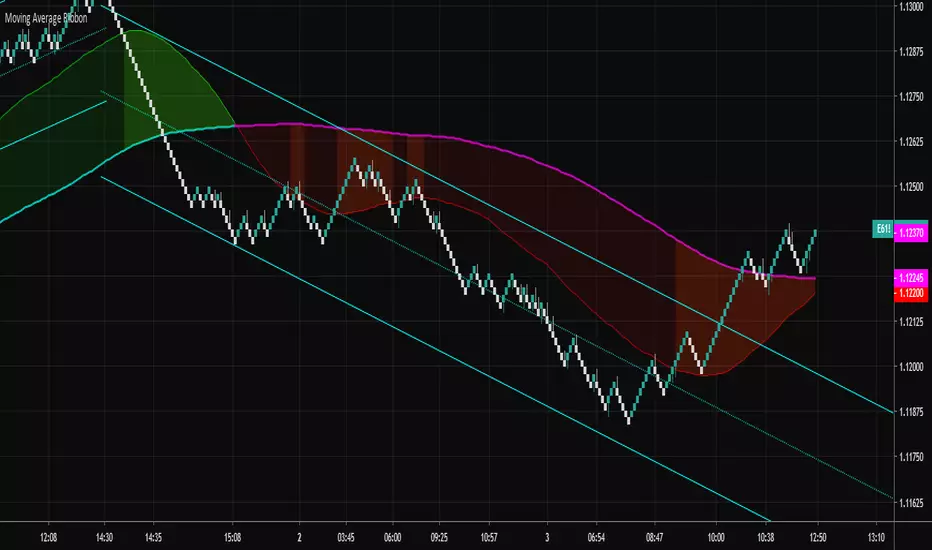
Moving Average RibbonA ribbon that uses a fast EMA, a slow EMA, and a signal EMA. By default the signal EMA is invisible.
When the fast EMA > slow EMA the default fill is green, and then red when the fast EMA < slow EMA. The signal EMA adds a 2nd flavor to the ribbon. When the fast EMA > slow EMA, if the signal is beneath the fast EMA, the ribbon fill changes its color to a brighter green. When the fast EMA < slow EMA, if the signal is above the fast EMA, the ribbon fill changes its color to a brighter red. Many times these little "fishhook" pullbacks are buying/shorting opportunities in the dominate trend.
Try settings of 8/21/8 Fast/Slow/Signal, with the "Zero-Lag Signal" check box checked. Zero-Lag is a simple algorithm that tries to remove as much lag as possible from an EMA. An 8 EMA will run "slower" than an 8 Zero-Lag EMA.
Additionally, 2 simple alerts are available for whenever the fast EMA crosses above the slow EMA, and the opposite.
Cheers.