HTF Liquidity Levels█ OVERVIEW
The indicator introduces a new representation of the previous days, weeks, and months highs & lows ( DWM HL ) with a focus on untapped levels.
█ CONCEPTS
Untapped Levels
It is popularly known that the liquidity is located behind swing points or beyond higher time frames highs/lows (in a sense, an intraday swing point is a day high/low). These key areas are said "liquid" because of the accumulation of resting orders, mainly in the form of stop-loss orders. And this more significantly on higher time frames which have more time for stacking orders. As the result, the indicator aims to keep track of untapped levels that have their liquidity states intact.
Liquidity Pools
Once a liquidity level identified, or better, a cluster of liquidity levels work as magnets for the market. The price is more likely to make its way towards heavier pockets of liquidity, by proximity (the closest liquidity pool), and by difficulty (path with less obstacles). This phenomenon is referred as liquidity run, raid, purge, grab, hunt, sweep, you name it. Consequently, the indicator can help you frame a directional bias during your trading session.
█ NOTES
Drawings
Once a level is tapped, it is highlighted. At the end of each day, all tapped levels are cleared.
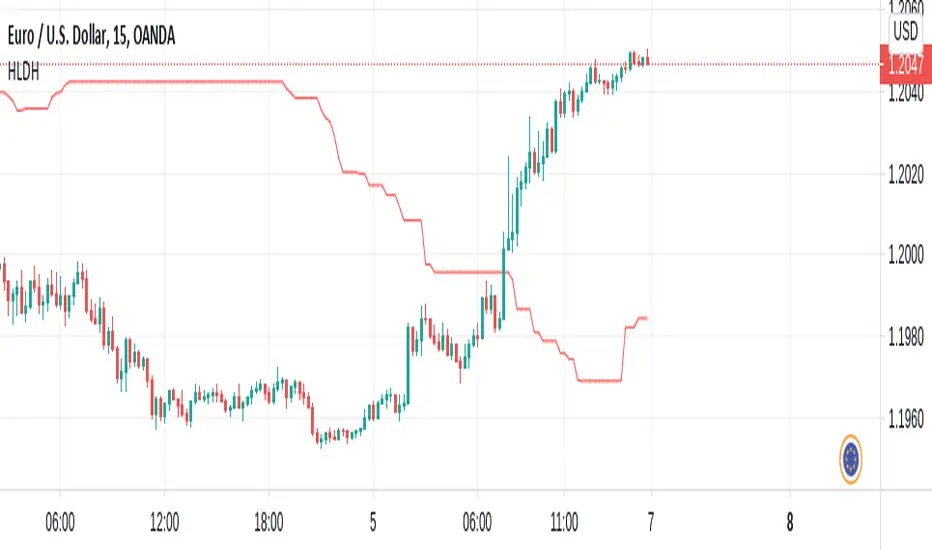
Highlow

Session LevelsThis indicator plots important session (intraday) levels for the day. It plots high and low of previous day, week, month, 52 week and all time. Also plots the vix range which shows the daily expected trading range of the instrument. These levels acts as important support/resistance for the day.
For example, if price closes above previous day, week, or month high/low it indicates bullish sentiment and vice versa for bearish.
Vix Range plots top, center, bottom line for expected trading range for the day. It is calculated based on the volatility index selected (NSE:India VIX is used by default).

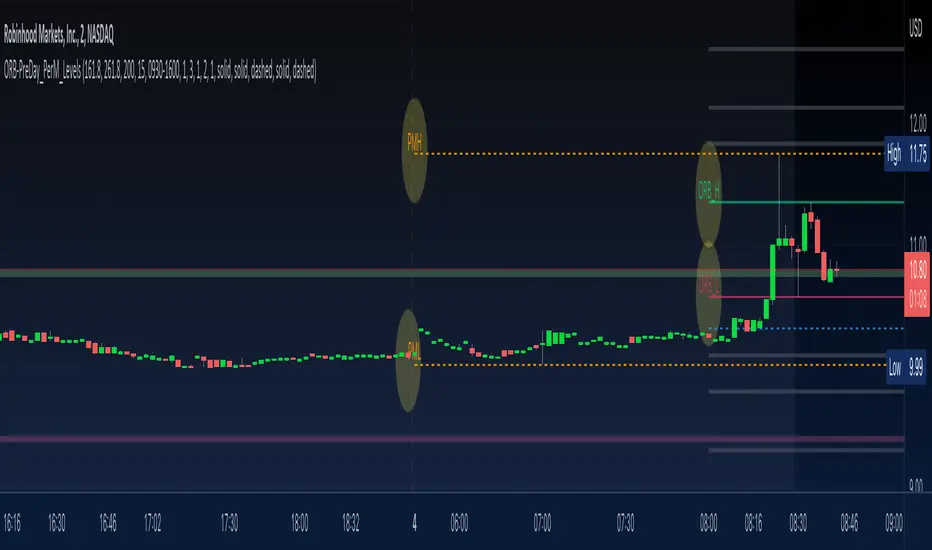
ORB-PreDay_PerM_LevelsThis script provides following levels:
1. ORB Level - You can adjust the timeframe of Opening Range (plots from 9am to 4pm)
2. ORB Fib Extension - 1.618 and 2.618 Fibonacci Extension of ORB High and Low (plots from 9am to 4pm)
3. Previous Day High/Low/Close - You can adjust color/thickness of the lines (plots from two days ago so that you can clearly see the levels)
4. Previous Two Days High/Low (plots from two days ago so that you can clearly see the levels)
5. Pre-Market High/Low (plots from 6:30am to 11am)
All in one indicator gives much better clarity of where current instrument is trading in relation to ORB, Previous Day Levels and Previous Two Days Levels along with Pre Market Levels.
You could combine these levels with your favorite EMA or EMA Cloud to create a trading system.
You could combine these levels with MA Cloud and ATR vs DTR script to gauge the move.
Look at the TWTR Chart today and see how these levels are respected.
Previous N Days/Weeks/Months High LowJapanese below / 日本語説明は下記
This indicator displays previous N days/weeks/months’ highs and lows simultaneously.
N is user input and users can separately input different N for highs and lows.
For instance, if you would like to show past 20days high and 10days low, you specify 20 for high and 10 for low.
Similar to highs and lows of yesterday, last week and last month which I previously developed a indicator for(see the link below), highs and lows of specific terms such as quarters are also respected as supports and resistances.
A legendary trader group, Turtles also uses 20days high/low break as one of their strategies.
Alerts can be set with the conditions below.
-Crossing over previous day’s high
-Crossing under previous day’s low
-Crossing over previous week’s high
-Crossing under previous week’s low
-Crossing over previous month’s high
-Crossing under previous month’s low
Please note that when we say past 2 days in this indicator, past 2days mean yesterday and day before yesterday, so “today” is not included as “today’s” high/low have yet to be fixed.
Related indicator: High/Low Yesterday&Last week&Last month&Last Year
By combining with this indicator, you can highlight important support and resistance.
—————————————————————
過去N日/N週間/Nヶ月の高値·安値を同時に表示することのできるインジケーターです。
Nはパラメーターとなっており、また高値と安値で異なる期間を指定することができます。
例えば、過去20日間の高値と過去10日間の安値という指定が可能です。
昨日、先週、先月の高値·安値と同様に、四半期などの過去一定期間の高値·安値はサポート·レジスタンスとして良く意識されます。
伝説のトレーダー集団タートルズも20日間の高値·安値のブレイクを取引ルールの一つとして使用していたことで有名です。
また、以下の条件でアラート設定が可能です。
-過去N日高値の上方ブレイク
-過去N日安値の下方ブレイク
-過去N週間高値の上方ブレイク
-過去N週間安値の下方ブレイク
-過去Nヶ月高値の上方ブレイク
-過去Nヶ月安値の下方ブレイク
このインジケーターで過去2日間の高値·安値といった場合、過去2日間とは昨日と一昨日の2日間を指します。まだ高値·安値の確定していない本日は含まないことに注意してください。
関連インジケーター: High/Low Yesterday&Last week&Last month&Last Year
当インジケーターと合わせて使用することで、主要なサポートレジスタンスを表示することができます。

HighLow Box Highlight between EarningsHighLow Box Highlight between Earnings
This is an indicator to highlight area between two earning periods and their highest and lowest points.
It also alternates the highlight color in each subsequent block.
Tested to work in 1D charts and 1M charts
Just drop a message, if you want this further developed with more features.
Note: This was requested by user Meatpye on a forum.

Price Clouds Oscillator (PCO)This is the oscillator version of Price Clouds (PS). Use this with (PS) for best results.
This indicator shows you over bought and over sold regions similarly to to rsi or stochastic. This indicator centers a moving average around the hl2 of the price. This is calculated as the difference of four moving averages. The signal line shows you how much momentum in any given direction you have. You can also see how much volatility there is by the band width. Just like the Bollinger band high volatility comes before low volatility and visa versa. You can also see what the market is doing based on the signal crosses. If the fast line is above the slow line you are going up and visa versa. This indicator works in most markets, especially crypto. There is a tool tip for every aspect of this indicator explaining how everything works.
Key Feature:
>See where the price is relative to a mean price
>Measure volatility
>Clean global settings
>Normalization feature lets you scale the band from 0 to 1. You loose some information but its easier to use if you aren't measuring volatility.
I hope you are very profitable with this one!
If you find this indicator is useful to you, Star it, Follow, Donate, Like and Share.
Your support is a highly motivation for me.
PCO
----------------------/\-----
-------------/\----/----\---
\----------/----\/--------\-
--\------/------------------
----\_/---------------------

GT - Recent High/Low█ OVERVIEW
This indicator will help traders identify the recent high and low of the current trend so we know where we are in the trend. If recent high/low broken it could be that the trend is changing. This indicator is based on price action.
█ HOW IT WORKS
Basically, a trend is when the prices move up and down in a stair-step fashion. In an uptrend, The indicator keeps track of the up and down movement and remember the last high and once the price pull back and broke the recent high it will mark out the new high. When prices pull back in and uptrend it must not broken the recent low. If the pull back move broke the recent low it could means that the trend is changing and we could see prices start going down. Downtrend is the reverse of uptrend.
Whenever the price broke the recent high or low the script will go back from the candle that broken the previous high to find the recent low. As long as the high of previous candle is lower than each other consecutively backward, all of those candle will be counted as part of the up move. The lowest low of these candles will be counted as the recent low. If one of the candles that are part of the up move is an inside bar then the recent low is the low of that inside bar candle (for downtrend it will be the high). Inside bar candle is a candle that it's high and low are both inside the high and low of the candle preceding it (to its left).
█ DISCLAIMERS
The content of this post is NOT investment advice and I am not a financial advisor.
This is for educational purpose only.
Always do you own research. Do not blindly trust a random stranger online.
█ HOW DOES IT HELP YOU
Moving the recent high and low every time a candle break out is a very tedious job. Plus, you cannot set an automatic alert system whenever price broke a recent high or low. This indicator allow you to create an alert whenever a recent high or low is broken.
You can use this indicator as a trailing stop loss strategy. Move the stop loss of your long position to the recent low level whenever price broke recent high or move the stop loss of your short position to the recent high level whenever price broke recent low.
The bullet line is the minor recent high or low before the prices broke the major recent high/low. This line could be the level where prices touch before continue with the trend.
█ TRADING IDEAS
Based on how a candle broke the recent high or low, if it breaks impulsively you can develop your strategy to trade the pullback and hoping on the trend before it continue to move up or down.
█ CURRENT FEATURES
Recent high/low.
Previous high/low.
Inside bar marker.
Alert for when high/low broken. Configurable message format either in JSON or plain text, useful when using with webhook alert.
Bullet line (trend continuation line).
Toggle switch to redraw in realtime. CAUTION: this will cause repainting and alert will fire multiple time during a real-time bar.
█ NOTES
- I am very new to pine script. So there could be a way to handle the alert in realtime to not fire multiple time, Once I found a way I will update the indicator. However, redrawing in realtime will definitely cause repainting of high/low or bullet line, as far as I know this cannot be fixed because it is how pine script compiler works.
- If you like the indicators and it helps you please be sure to leave a like.
█ CREDITS
This indicator is made by me but the idea is inspired by Guerrilla Trading course. Which is why this indicator is closed-source. Guerrilla doesn't support the use of indicators and they believe in mastering reading candle sticks using price action on a naked chart. However, I'm a visual learner, I do my due diligent in backtesting and learning how to read the chart. I think that a little help with indicator to smooth my learning curve or make it easier to identify important level is very useful.
!IMPORTANT!: If you are a member of Guerrilla please do not advertise this indicator on their forum as they do not support the idea of using indicators.
While using the indicator if you found any bugs or the lines draw incorrectly please report it directly to me by leaving a comment or message me directly. Do not report the bugs of this indicator to Guerrilla Trading as this has nothing to do with them and they are not the maintainer.
If you are not a member of Guerrilla but you are considering joining Guerrilla Trading. You can support me out by using my affiliate link in my Signature . Thank you very much!
█ CONTRIBUTE
If you are a developer and a member of Guerrilla and you would like to contribute to this indicator please message me.

High - Low Difference (Forex)This script is created to read and label the difference between High and Low of a candle in points term & in percentage term.
This is basically made for Forex Trading.
Do explore the settings of the scrip.

Average Candle RangeThis indicator calculates for you the average candle range for the current 24H trading session for the selected timeframe. The calculation starts from 00:00UTC until the current moment. The indicator is not time zone dependent, works well on every time zone.

Position Size CalculatorCME_MINI:ES1!
Script allows for automatic position size calculation based on an adjustable percentage of total account size. Entries and exits are determined based on a bar break basis (for longs entries will be made on the break of the previous bar's high and stops set on the previous bar's low with an adjustable "wiggle room" based on previous bar's range). This script facilitates position size calculation and calculation of the total dollar cost of initiating the position quickly for people who make entries based on breaks of prior bar highs/lows

QF LevelsQF LEVELS is an Indicator that displays various Levels and Session Ranges .
Daily / Weekly / Monthly / Quarterly / Yearly - Open levels
Previous DWMQY - Open levels
Monday - High / Mid / Low - Levels
Intraday (4H) Levels
London / New York / Asian - Sessions
Automatic Coloring based on Support / Resistance
Full Color Customization
Themes coming in next update

High - Low DifferenceThis script is created to read and label the difference between High and Low of a candle in percentage term.

Gann High Low Activator AlertsA Gann High Low Activator within a fixed range meant for alerts. A value of 1 means we're in an uptrend, a value of -1 a downtrend, and a value of 0 is neutral.
Thank you and happy trading

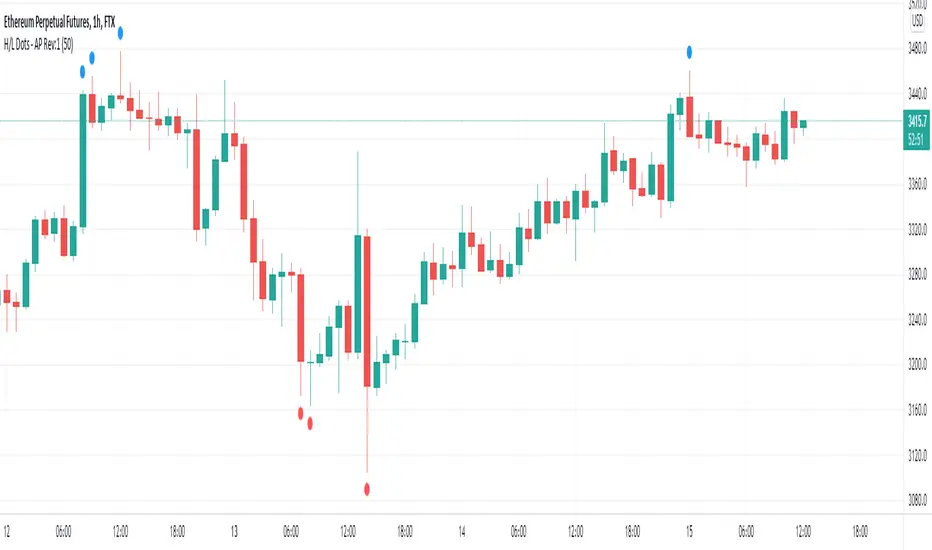
Recent High/Low Dots by Alejandro PSimple indicator that plots a dot in the chart when a candle breaks the high of the past X candles.
This is useful to easily visualize when the market is coming out of a range and making fresh highs or lows relative to the past X candles.
It can be used in trend following systems as an additional filter for validation.
High/Low Anchored VWAPHigh/Low Anchored VWAP simply plots an Anchored VWAP at High and Low, within a set range (D,W,M) , with a central "Basis" plot of the High and Low anchored VWAPs
*DISCLAMER* This indicator repaints. DO NOT set alerts or backtest using this indicator.

Center Of Gravity OscillatorThe COG Oscillator (center of gravity) is an indicator based on statistics and the Fibonacci golden ratio. It uses ALMA as a trigger and LSMA as "zero line". The trigger is set tight by default but can be tweaked by adjusting the window size and sigma in settings. This is a great indicator for setting up trades and spotting reversals. There are 2 main strategies that come with this indicator:
Strategy 1: Long positions are entered when current low point is higher than previous low. Short positions are entered as current high is lower than previous high. (Shown in image above)
Strategy 2 : If market is bullish long trades are entered as COG line crosses over red LSMA line. Traders have the option of scalping the first crossover or even scaling out of trade to close on second exit. This works the opposite for shorts when market is bearish.
Above shows different configurations of the indicator. Top shows length of 50, Middle has length of 21 and bottom is default 9.

Simple charting tool box (5 tools)This is a simple charting tool box that allows you to do 5 things:
1. Highlight custom time range with transparent background.
2. Plot High, Low of the custom time range and extension.
3. Plot previous day High, Low
4. Highlight market sessions (Sydney, Tokyo, London, New York), session times are customizable.
5. Plot ATR Projections
The drawings use exchange time of your data feed. For Oanda feed, it is NY time (UTC-4).
Hope the tool helps. Enjoy!

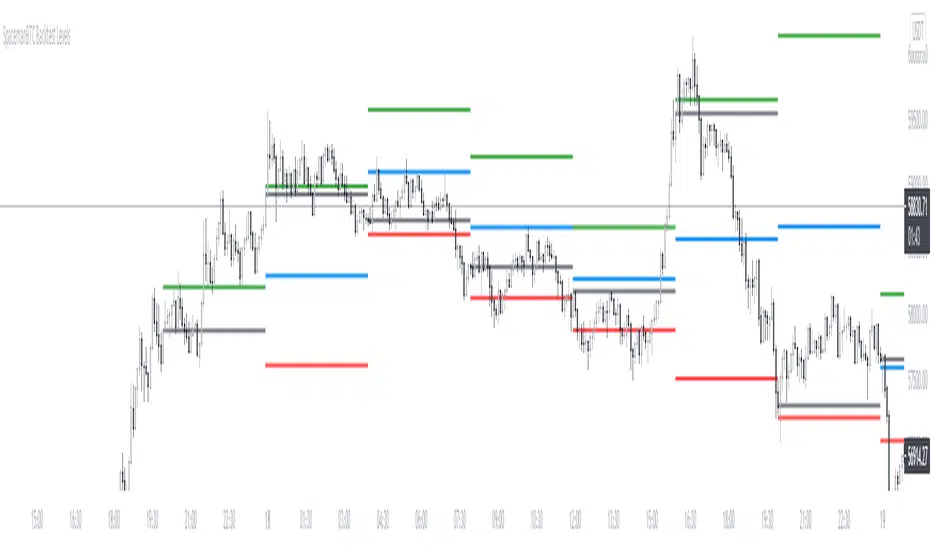
Key Levels CustomTF + Backtest: SpacemanBTCKey Levels Backtest, same logic as the key levels script, provide levels based:
High, Low, Mid and Close.
This was requested, took a long time to post as I fell sick and was given a lot of Dev Work.
Hope this helps those who use it, very useful to see liquidity grabs in my opinion.
Input time in minutes!
Result of a user request.
ATR - ATR from Low, ATR from High LabelsChecks what the average true range is for the X amount of trading days. Then will also label the ATR from the low, and the ATR from the high of the current day.
A second label can be created dependent on current days RVOL %. If RVOL is not 0 or 1, then it will create the second label. Otherwise it will just leave it as the standard label.
The calculation for second label is RVOL * ATR.

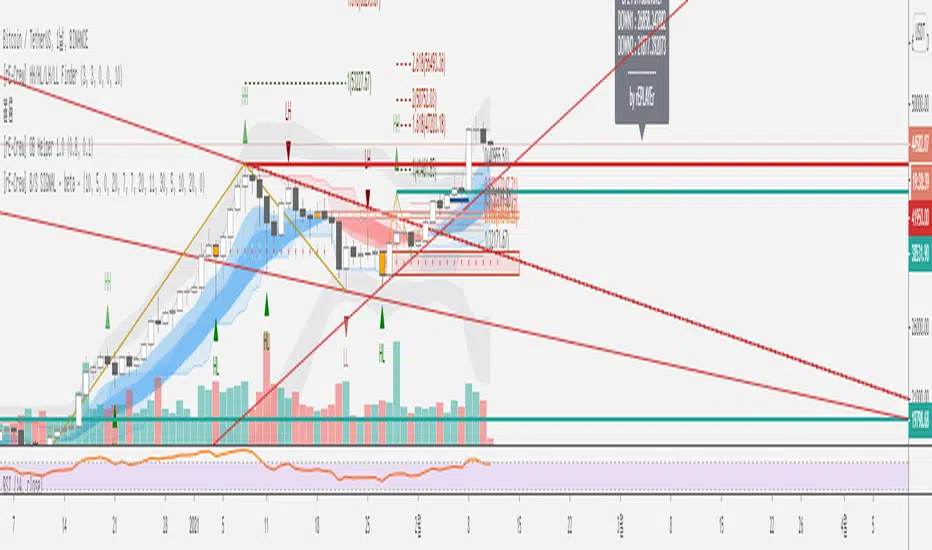
[rE-Crew] HH/HL/LH/LL Finder Open versionMy English is poor.
So I ask for your understanding.
You can find HH/HL/LH/LL using this indicator
HH : Higher High
HL : Higher Low
LH : Lower High
LL : Lower Low
This indicator is useful for Dow-Theory.
enjoy :)
이 지표는 HH/HL/LH/LL 을 찾아주는 지표입니다.
다우 이론에 유용하게 쓰여질 수 있습니다.
영어를 잘못하니 이해해주시면 감사하겠습니다 ^^;
High/Low X Bars AgoThis indicator will plot a line on your chart that shows the highest high point between two previous points on the chart. It does this by reporting the highest point of X number of candles, and begins the look-back X number of candles ago.
Default candle group size is 50, and default look-back begins 50 candles back.
With these settings, the script will essentially plot the highest high point between the candle that printed 100 candles ago, and the candle that printed 50 candles ago.
Options are available for looking for the highest point, or lowest point, with configurable distances in the look-back and candle group ranges.
This script was custom built by Pine-Labs for a user who requested it.
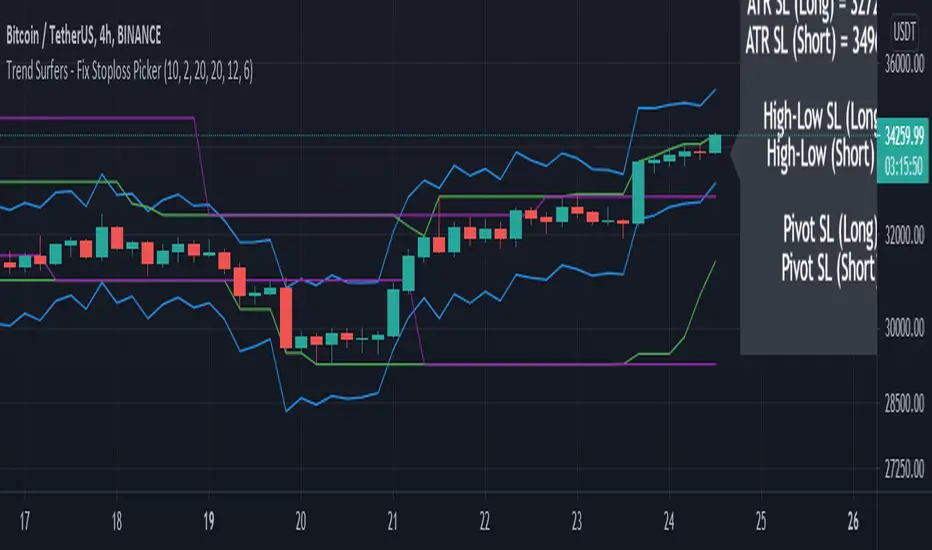
Trend Surfers - Fix Stoploss PickerThis study include 3 types of stop-loss (ATR, High/Low and Pivot point)
This script aimed to help new traders to respect risk management.
Simply select which stop-loss you would like to use in the settings and the suggested stop-loss will be displayed on the chart for Long and Short positions.
Please let me know in the comment if you would like me to add more indicators for the stop-loss in this script.
Hope you like it!
Rabbit HoleHow deep is the Rabbit hole? Interesting experiment that finds the RISING HIGHS and FALLING LOWS and place the difference between the highs and lows into separate arrays.
== Calculations ==
In case current high is higher than previous high, we calculate the value by subtracting the current highest high with the previous High (lowest high) into array A,
same method for the lows just in Array B.
Since we subtract highs and lows it means velocity is taken into consideration with the plotting.
After adding a new value we remove the oldest value if the array is bigger than the Look back length. This is done for both lows and highs array.
Afterwards we sum up the lows and highs array (separately) and plot them separately, We can also smooth them a bit with Moving averages like HMA, JMA, KAMA and more.
== RULES ==
When High Lines crosses the Low Line we get a GREEN tunnel.
When Low Lines crosses the High line we get the RED tunnel.
The Greenish the stronger the up trend.
The Redish the stronger the downtrend.
== NOTES ==
Bars are not colored by default.
Better for higher time frames, 1 hour and above.
Enjoy and like if you like!
Follow up for new scripts: www.tradingview.com
