Trend FilterTrend Filter
Summary
Trend Filter is a multi-factor trend-confidence indicator that produces a simple, actionable output: Direction (Up / Down / Ranging) and a normalized Confidence %. It is intended as a decision-support overlay to help traders quickly identify whether a market is trending or rangebound, and how strong that directional bias is.
What it shows
A single line in the on-chart table: Direction (Up / Down / Ranging).
A Confidence % (0–100) that combines multiple normalized market signals into a single score.
Optional notification row when a manually-selected reference timeframe does not match the chart timeframe.
Alert conditions when direction changes to Up, Down, or Ranging.
How the indicator works (concise, non-proprietary explanation)
Trend Filter computes a weighted confidence score from several complementary components, each normalized to a 0–100 scale and combined into a single confidence value. The components and their roles are:
EMA structure & spread (trend breadth)
-Uses three EMAs (fast / mid / slow) computed at lengths that scale with the selected/reference timeframe. The EMA spread (fast vs slow) quantifies directional separation.
HH/HL structure and streaks (price structure)
-Counts higher highs/higher lows (and the reverse) across a scaled lookback to measure whether price structure is predominantly bullish, bearish or mixed.
EMA slope (momentum of trend)
-A robust slope approximation (smoothed) measures whether the short EMA is rising/falling relative to its own smoothed history.
ADX / DMI (trend strength)
-Uses a standard ADX-style component to capture directional persistence and dampen the confidence score when the ADX is weak.
ATR (volatility context)
-ATR expressed as a percentage of price helps detect abnormal volatility regimes which affect the validity of trend signals.
Volume context
-Simple volume vs a short SMA gives a participation signal that increases confidence when moves occur with higher volume.
Each component is capped to avoid outsized influence. Components are scaled by a set of weights (configurable in code) and then combined. The final confidence is lightly smoothed before being used to determine direction and to feed alert conditions.
Important implementation & safety design choices (why it’s not a simple mashup)
Adaptive timeframe scaling: EMA lengths and lookbacks are proportionally scaled based on the chosen reference timeframe (Auto or manual). This preserves relative indicator behavior across 1-minute → Daily timeframes without manual retuning of each parameter.
HH/HL structure plus streaks: Instead of relying solely on moving averages or ADX, the script explicitly measures price structure (HH/HL counts and streaks) and blends that with slope/ADX. This reduces false trending signals on noisy price action.
Normalized, weighted combination with caps: Each component is normalized (0–100) and combined by predefined weights; cap thresholds prevent extreme component values from dominating the result. This is a design intended to produce interpretable confidence % rather than opaque binary outputs.
History and loop safety: The code enforces a cap and protects loop lengths against available historical bars to avoid runtime errors and to ensure the script remains stable on short data series.
Practical guardrails: The script includes notification behavior to highlight manual timeframe mismatches and avoids dynamic indexing patterns that can cause unreliable results on small bar histories.
These design decisions — adaptive scaling, structural HH/HL scoring, capped normalization and explicit safety limits — are the elements that distinguish Trend Filter from simple, single-indicator overlays (EMA-only, ADX-only, etc.) and form the basis for why closed-source protection is reasonable for commercial/invite-only publication.
User controls & recommended usage
Reference Timeframe: Auto (uses chart TF) or choose a manual reference TF (1min → D). When manual TF is selected, the table shows a mismatch warning if the chart TF differs.
Table placement & colors: Positioning and appearance of the on-chart table are configurable.
Confidence thresholds: The indicator uses internal thresholds to mark high/medium/low confidence. Users can interpret the Confidence % relative to those ranges.
Alerts: Built-in alerts fire only on direction changes (to Up, Down, or Ranging). Use alerts as a signal to review the chart rather than an instruction to trade automatically.
How traders typically use it
Add Trend Filter as an overlay to your chart.
Confirm that the recommended reference timeframe is appropriate (Auto will adjust automatically).
Use Direction and Confidence % together: high Confidence + Up (or Down) suggests staying with trend; Ranging suggests avoiding trend-following entries.
Combine this filter with your entry/exit rules (price structure, support/resistance, or your preferred signal generator).
Disclaimers & limitations
This is a decision-support indicator, not an automated execution strategy. It does not place orders and does not provide P/L or backtesting statistics.
Confidence % is an aggregated measure — treat it as context, not a guarantee.
Results vary across symbols and timeframes; use appropriate position sizing and risk controls.
The code intentionally includes history and loop safeguards; on very short histories the indicator may display conservative results.
Higherhigh

Higher High Lower Low Higher High Lower Low 🦉{Phanchai} — TradingView Description
Structure detector with dynamic Support/Resistance, customizable labels, and ready-made alerts (Pine v6).
This script marks market structure turning points — HH (Higher High), HL (Higher Low), LH (Lower High), LL (Lower Low) — and builds segmented Support/Resistance lines from those turns. Labels and colors are fully customizable and the script ships with multiple alert conditions.
What it does
Detects swing pivots using left/right bar windows, then classifies each confirmed swing as HH/HL/LH/LL.
Plots compact labels at the confirmed pivot bars with tooltips (English).
Derives dynamic Support / Resistance : every time structure flips, the previous level is closed and a new segment starts, extending to the right .
Provides alert conditions for any label and for specific first-occurrence shifts (e.g., first HH after a bearish label).
How it works (in short)
A pivot high/low confirms only after Right Bars candles have closed; labels and S/R appear at that confirmation bar.
An internal backbone (zigzag-like) is built from confirmed pivots, with light consistency checks to avoid contradictory sequences.
Structure rules compare the recent five pivots (A…E) to decide HH/HL/LH/LL.
S/R is updated from structure: e.g., in an up leg, new HLs refresh Support; in a down leg, new LHs refresh Resistance.
Alerts included
Any structure label (HH/HL/LH/LL) — Fires on any new label.
First LL after HL/HH — First bearish break after a bullish label.
First HH after LL/LH — First bullish break after a bearish label.
LL or HL formed — Any low-side label.
LH or HH formed — Any high-side label.
HL formed
HH formed
LL formed
LH formed
How to use (quick start)
Add the indicator to your chart.
Choose Left/Right Bars for your timeframe (e.g., 5–10 for intraday; larger for higher timeframes).
Pick your label colors/sizes and S/R style.
Right-click the chart → Add alert… → Condition: this indicator → select the desired alert.
Notes & tips
Because pivots require Right Bars to confirm, labels and S/R appear with a natural delay of that many bars. This avoids repainting.
Raising Left/Right Bars reduces noise and increases the average distance between pivots; lowering them increases sensitivity.
Structure is strict: sometimes you may see two HL (or two LH) in a row if the intermediate opposite swing didn’t qualify as HH/LH (or LL/HL).
S/R segments are drawn with line objects ; they are controlled via Inputs (style/width/color), not the Style tab.
This tool highlights structure; it’s not a standalone entry/exit system. Combine with volume, trend, or risk management rules.
Built with Pine v6. Clean, compact labels; segmented S/R that updates only on confirmed changes; comprehensive alerts ready for automation.

WLI Swing High/Low advnc indicatorfor Class members
else
label.set_xy(lowMsg, bar_index, close)
label.set_text(lowMsg, "making New Low")
label.set_color(lowMsg, newSwingLowColor)
label.set_textcolor(lowMsg, color.white)
else
if not na(lowMsg)
label.delete(lowMsg)
lowMsg := na

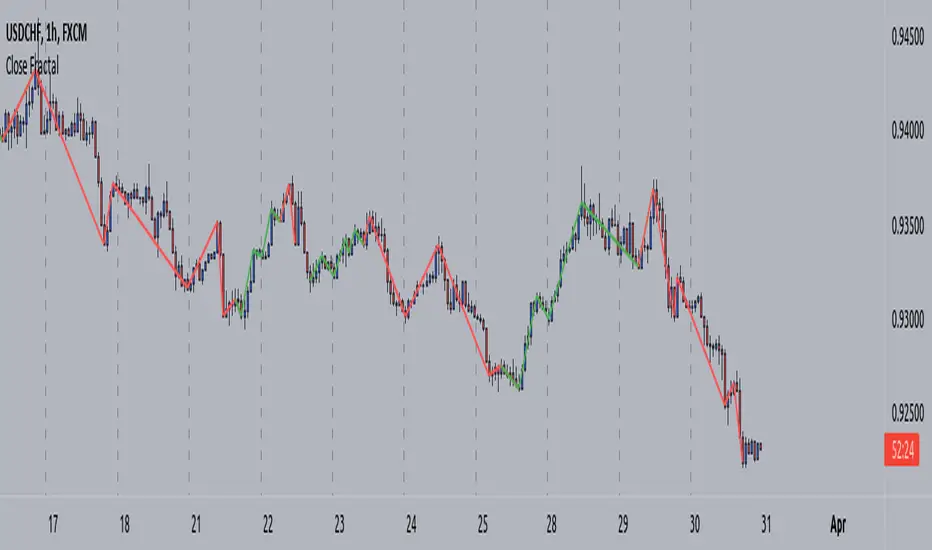
Fractal Breakout Trend Following System█ OVERVIEW
The Fractal Breakout Trend Following System is a custom technical analysis tool designed to pinpoint significant fractal pivot points and breakout levels. By analyzing price action through configurable pivot parameters, this indicator dynamically identifies key support and resistance zones. It not only marks crucial highs and lows on the chart but also signals potential trend reversals through real-time breakout detections, helping traders capture shifts in market momentum.
█ KEY FEATURES
Fractal Pivot Detection
Utilizes user-defined left and right pivot lengths to detect local highs (pivot highs) and lows (pivot lows). This fractal-based approach ensures that only meaningful price moves are considered, effectively filtering out minor market noise.
Dynamic Line Visualization
Upon confirmation of a pivot, the system draws a dynamic line representing resistance (from pivot highs) or support (from pivot lows). These lines extend across the chart until a breakout occurs, offering a continuous visual guide to key levels.
Trend Breakout Signals
Monitors for price crossovers relative to the drawn pivot lines. A crossover above a resistance line signals a bullish breakout, while a crossunder below a support line indicates a bearish move, thus updating the prevailing trend.
Pivot Labelling
Assigns labels such as "HH", "LH", "LL", or "HL" to detected pivots based on their relative values.
It uses the following designations:
HH (Higher High) : Indicates that the current pivot high is greater than the previous pivot high, suggesting continued upward momentum.
LH (Lower High) : Signals that the current pivot high is lower than the previous pivot high, which may hint at a potential reversal within an uptrend.
LL (Lower Low) : Shows that the current pivot low is lower than the previous pivot low, confirming sustained downward pressure.
HL (Higher Low) : Reveals that the current pivot low is higher than the previous pivot low, potentially indicating the beginning of an upward reversal in a downtrend.
These labels provide traders with immediate insight into the market structure and recent price behavior.
Customizable Visual Settings
Offers various customization options:
• Adjust pivot sensitivity via left/right pivot inputs.
• Toggle pivot labels on or off.
• Enable background color changes to reflect bullish or bearish trends.
• Choose preferred colors for bullish (e.g., green) and bearish (e.g., red) signals.
█ UNDERLYING METHODOLOGY & CALCULATIONS
Fractal Pivot Calculation
The script employs a sliding window technique using configurable left and right parameters to identify local highs and lows. Detected pivot values are sanitized to ensure consistency in subsequent calculations.
Dynamic Line Plotting
When a new pivot is detected, a corresponding line is drawn from the pivot point. This line extends until the price breaks the level, at which point it is reset. This method provides a continuous reference for support and resistance.
Trend Breakout Identification
By continuously monitoring price interactions with the pivot lines, the indicator identifies breakouts. A price crossover above a resistance line suggests a bullish breakout, while a crossunder below a support line indicates a bearish shift. The current trend is updated accordingly.
Pivot Label Assignment
The system compares the current pivot with the previous one to determine if the move represents a higher high, lower high, higher low, or lower low. This classification helps traders understand the underlying market momentum.
█ HOW TO USE THE INDICATOR
1 — Apply the Indicator
• Add the Fractal Breakout Trend Following System to your chart to begin visualizing dynamic pivot points and breakout signals.
2 — Adjust Settings for Your Market
• Pivot Detection – Configure the left and right pivot lengths for both highs and lows to suit your desired sensitivity:
- Use shorter lengths for more responsive signals in fast-moving markets.
- Use longer lengths to filter out minor fluctuations in volatile conditions.
• Visual Customization – Toggle the display of pivot labels and background color changes. Select your preferred colors for bullish and bearish trends.
3 — Interpret the Signals
• Support & Resistance Lines – Observe the dynamically drawn lines that represent key pivot levels.
• Pivot Labels – Look for labels like "HH", "LH", "LL", and "HL" to quickly assess market structure and trend behavior.
• Trend Signals – Watch for price crossovers and corresponding background color shifts to gauge bullish or bearish breakouts.
4 — Integrate with Your Trading Strategy
• Use the identified pivot points as potential support and resistance levels.
• Combine breakout signals with other technical indicators for comprehensive trade confirmation.
• Adjust the sensitivity settings to tailor the indicator to various instruments and market conditions.
█ CONCLUSION
The Fractal Breakout Trend Following System offers a robust framework for identifying critical fractal pivot points and potential breakout opportunities. With its dynamic line plotting, clear pivot labeling, and customizable visual settings, this indicator equips traders with actionable insights to enhance decision-making and optimize entry and exit strategies.

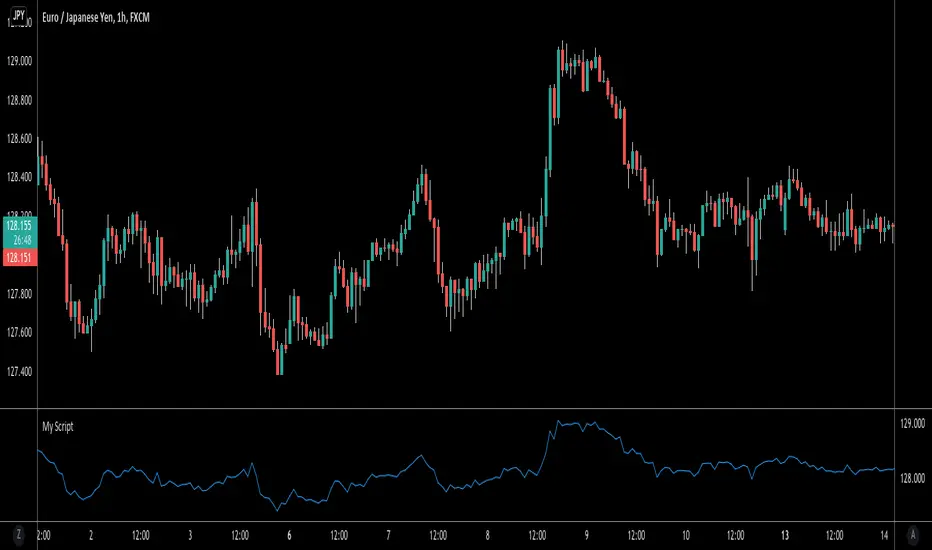
Predict Trend [Cometreon]Predict Trend is a forward-looking indicator that compares the current market trend with historical patterns, providing statistically based forecasts. Using advanced algorithms, it continuously scans for price behaviors similar to those in the past and projects average outcomes based on those patterns.
This innovative approach offers traders a powerful tool to anticipate market movements, refine strategies, and make data-driven decisions.
🔷 Key Features
🟩 Historical Pattern Analysis:
The indicator identifies and compares the current trend with similar historical patterns, providing predictions based on concrete and historical data.
🟩 Customizable Precision:
Offers the ability to adjust various parameters such as distance and percentage variation between levels, improving the accuracy of pattern search.
🟩 Historical Average-Based Predictions:
Displays the predicted movement based on the average of all historical patterns found, allowing for informed trading decisions.
🟩 Specific Pattern Search:
In addition to automatic search based on the active trend, Predict allows searching for specific patterns by manually entering the necessary data for analysis.
🟩 Forecast Visualization:
Provides a detailed table with all values found and a line representing the average of results, offering a clear view of predictions based on historical data.
🔷 Technical Details and Customizable Inputs
1️⃣ Precision Parameters - Allows adjusting the length of levels, pattern precision, and the number of subsequent values to obtain after identifying historical patterns.
2️⃣ Specific Pattern Search - Allows manual data entry to search for specific patterns, offering greater flexibility in analysis.
3️⃣ Timeframe - Predict works on any timeframe, with greater precision on higher timeframes.
4️⃣ Chart Compatibility - It is compatible with all chart types, allowing analysis and comparison of historical patterns regardless of the chart type used.
5️⃣ Level 1 - First correlation level for patterns. "Last Bar to Check" allows choosing the number of Pivots to check for searching patterns in the past with the same values (e.g., HH, LL, LH, and HL).
6️⃣ Level 2 - Checks the candle distance between each level. "Error Value Up-Down" allows adding a margin value between distances.
7️⃣ Level 3 - Verifies the percentage distance between levels. "Error Percent" allows adding an error margin to the percentage distance.
8️⃣ Bar to Have - Determines how many values after each pattern to display in the table.
9️⃣ Timezone - Enter the chart's time zone to display the precise start time of the pattern.
🔟 Manual Search - Allows searching for specific patterns by manually entering up to 8 values, including special values such as:
High Value : "HH" (Higher High) or "LH" (Lower High)
Low Value : "LL" (Lower Low) or "HL" (Higher Low)
Top / Bottom : "HH" or "LL"
Mid Level : "LH" or "HL"
1️⃣1️⃣ Approximate Trend - Shows a trend based on the average of values for each pattern in each section. Allows customizing up to 4 colors, line thickness, and style.
1️⃣2️⃣ Pattern Table - Shows the values of identified patterns. You can customize the number of patterns to show, display order, position, size, and table style.
1️⃣3️⃣ Displayed Elements - Customize elements shown on the table, such as Number, Date, or subsequent Swing values.
1️⃣4️⃣ Style Label - Modify the visual appearance of labels by selecting colors for background and text.
These options allow optimizing the indicator for different trading styles and market conditions, ensuring accurate and customized technical analysis.
🔍 How to Use Predict Trend
📌 Past Movement Analysis
Use the patterns found to compare past movements with the current trend, gaining a clear vision of possible future directions.
📊 Using Value Averages
Analyze the average of values from found patterns to get a more direct and synthetic view of past market behavior.
🎯 Specific Pattern Search
In addition to automatic search based on the active trend, Predict allows searching for specific patterns by entering the necessary data for targeted analysis.
☄️ With Predict Trend , you can simplify your market analysis, saving time and improving the accuracy of your decisions with predictions based on concrete and verifiable historical data.
Don't waste any more time and take advantage of the precision of historical pattern analysis to gain a competitive edge in the market.

Absolute ZigZagThis ZigZag Indicator is a bit unique in it's kind.
It uses my own Absolute ZigZag Lib to calculate the pivots:
Instead of using percentages or looking more than 1 bar left or right, this Zigzag library calculates pivots by just looking at the current bar highs and lows and the ones of one bar earlier. This is a very fast and accurate way of calculating pivots.
The library also features a solution for bars that have both a higher high and a higher low like seen below.
You can also use your own colors for the labels and the lines:
You can also quickly select a one-colored theme without changing all colors at once:

RSI + FIB HH LL StopLoss Finder/Contrarian TradesThis indicator is a multi-timeframe indicator that works in any timeframe.
It takes a price reading of the highest or lowest bar in the past based on Fibonacci numbers and plots it.
In addition, the RSI smoothed by a 5-day moving average can be used to detect signs that previous highs or lows will be reached in advance.
This gives insight into determining stop-loss values or entering the market in a contrarian manner.
This is an example of BTCUSDT 4Hour Chart
Here is BTCUSDT 1Hour Chart
For scalpers BTCUSDT 15min Chart Example
Fibonacci Number is 1, 1, 2, 3, 5, 8, 13, 21, 34, 55, 89, 144, 233, 377, 610, 987, 1597, ...
FIbonacci Ratio is 0.236, 0.382, 0.5, 0.618, 1, 1.618, 2.618, 4.236, ...

Broadening Formations [QuantVue]Broadening formations are common chart patterns observed by technical traders. A broadening formation is formed when the volatility of an asset increases, thus expanding the range of its price resulting in higher highs and lower lows.
The Broadening Trendline indicator, works by looking for pivot points where a higher high or lower low is made compared to the previous pivot point. If a top and bottom line are detected a broadening formation is formed.
Indicator includes alerts, custom colors and styles, the ability to see previous trendlines, and notifications when a trendline is crossed.
Don't hesitate to reach out with any questions or concerns.
We hope you enjoy!
Cheers.

*Zig Zag Price, % Change w/RSI*With immense help from ©SimpleCryptoLife who reimagined this script for me, and to ©mmoiwgg and ©ocaptain who's ideas led to this updated version 5.
This indicator is fairly straight-forward and visually appealing because you get a running zig zag price, price % change with an added bonus - RSI. However you won't find zig zag lines but the script reacts the same by changing the inputs. The higher the value the less data points you'll see on the screen.
The main objective of this indicator is to be able to spot high and low prices easily with the price % change between the same 2 data sets. Additionally and arguably more importantly, with the RSI values associated with the high and low prices, you can spot divergences easily - meaning the price is making a higher high while conversely the RSI value at the next pop (around the same price as previous high) is lower which can mean that momentum has exhausted for the time being and a reversal could be imminent.
This script is meant only as a tool to try to enrich your trading journey and I hope it helps you become a more consistent and profitable trader. If you find it invaluable drop a like and comment. Good luck!

MarketStructureLibrary "MarketStructure"
This library contains functions for identifying Lows and Highs in a rule-based way, and deriving useful information from them.
f_simpleLowHigh()
This function finds Local Lows and Highs, but NOT in order. A Local High is any candle that has its Low taken out on close by a subsequent candle (and vice-versa for Local Lows).
The Local High does NOT have to be the candle with the highest High out of recent candles. It does NOT have to be a Williams High. It is not necessarily a swing high or a reversal or anything else.
It doesn't have to be "the" high, so don't be confused.
By the rules, Local Lows and Highs must alternate. In this function they do not, so I'm calling them Simple Lows and Highs.
Simple Highs and Lows, by the above definition, can be useful for entries and stops. Because I intend to use them for stops, I want them all, not just the ones that alternate in strict order.
@param - there are no parameters. The function uses the chart OHLC.
@returns boolean values for whether this bar confirms a Simple Low/High, and ints for the bar_index of that Low/High.
f_localLowHigh()
This function finds Local Lows and Highs, in order. A Local High is any candle that has its Low taken out on close by a subsequent candle (and vice-versa for Local Lows).
The Local High does NOT have to be the candle with the highest High out of recent candles. It does NOT have to be a Williams High. It is not necessarily a swing high or a reversal or anything else.
By the rules, Local Lows and Highs must alternate, and in this function they do.
@param - there are no parameters. The function uses the chart OHLC.
@returns boolean values for whether this bar confirms a Local Low/High, and ints for the bar_index of that Low/High.
f_enhancedSimpleLowHigh()
This function finds Local Lows and Highs, but NOT in order. A Local High is any candle that has its Low taken out on close by a subsequent candle (and vice-versa for Local Lows).
The Local High does NOT have to be the candle with the highest High out of recent candles. It does NOT have to be a Williams High. It is not necessarily a swing high or a reversal or anything else.
By the rules, Local Lows and Highs must alternate. In this function they do not, so I'm calling them Simple Lows and Highs.
Simple Highs and Lows, by the above definition, can be useful for entries and stops. Because I intend to use them for trailing stops, I want them all, not just the ones that alternate in strict order.
The difference between this function and f_simpleLowHigh() is that it also tracks the lowest/highest recent level. This level can be useful for trailing stops.
In effect, these are like more "normal" highs and lows that you would pick by eye, but confirmed faster in many cases than by waiting for the low/high of that particular candle to be taken out on close,
because they are instead confirmed by ANY subsequent candle having its low/high exceeded. Hence, I call these Enhanced Simple Lows/Highs.
The levels are taken from the extreme highs/lows, but the bar indexes are given for the candles that were actually used to confirm the Low/High.
This is by design, because it might be misleading to label the extreme, since we didn't use that candle to confirm the Low/High..
@param - there are no parameters. The function uses the chart OHLC.
@returns - boolean values for whether this bar confirms an Enhanced Simple Low/High
ints for the bar_index of that Low/High
floats for the values of the recent high/low levels
floats for the trailing high/low levels (for debug/post-processing)
bools for market structure bias
f_trueLowHigh()
This function finds True Lows and Highs.
A True High is the candle with the highest recent high, which then has its low taken out on close by a subsequent candle (and vice-versa for True Lows).
The difference between this and an Enhanced High is that confirmation requires not just any Simple High, but confirmation of the very candle that has the highest high.
Because of this, confirmation is often later, and multiple Simple Highs and Lows can develop within ranges formed by a single big candle without any of them being confirmed. This is by design.
A True High looks like the intuitive "real high" when you look at the chart. True Lows and Highs must alternate.
@param - there are no parameters. The function uses the chart OHLC.
@returns - boolean values for whether this bar confirms an Enhanced Simple Low/High
ints for the bar_index of that Low/High
floats for the values of the recent high/low levels
floats for the trailing high/low levels (for debug/post-processing)
bools for market structure bias

HHLL Strategy This is simple Highest high and Lowest low strategy.
Buy when break HH+offset
Sell when break LL+offset
Offset = (HH-LL)/2

Close zig-zag labelThis indicator is a beta and is created to indicate the valid high and low close pattern, this isn't a stand alone strategy or reader of the market but can help to read the trend direction.
!ATTENCTION!
this indicator have repainting, don't thrust it until a candle close
some labels have more transparency than other, this is beacause they are lower high or higher low , the duller are the trend extention (friendly reminder, I can find the exact higher or lower close after a pullback, not running)
I don't know if I would implement other stuff in this indicator or if I'm going to remake it better, but for now I have this
Dow Theory Trend Direction VisualizerJapanese below / 日本語説明は下記
Overview
What is difficult for beginner traders is to identify trend occurrence, continuation and reversal.
This indicator visualizes market direction by changing background colors based on Dow Theory so that traders can visually grasp trends.
Sample chart
Functions
1.MTF Higher High/Lower High/Higher Low/Lower Low(HH/LH/HL/LL)
Indicator shows HH/LH/HL/LL of an upper timeframe(MTF) and those of chart’s timeframe at the same time.
As usual, HH/LH/HL/LL of chart’s timeframe can be used to identify trend continuation based on Dow Theory while MTF HH/LH/HL/LL can be used as support/resistance.
Auto and manual mode for MTF
When you select “Auto” mode, then an upper timeframe will be automatically determined as MTF based on chart’s timeframe. If “Manual “ mode selected, then you need to specify MTF timeframe.
MTF HH/LH/HL/LL are displayed only below the selected MTF timeframe so it will not disturb when you open higher timeframe.
For instance, if you select daily timeframe as MTF, then HH/LH/HL/LL of daily timeframe will be shown on 4 hour or below timeframes.
Sample chart (AUDJPY 4H + Daily timeframe HH/LH/HL/LL )
In this chart, you can see two different timeframe’s trend.
In 4hour timeframe, a new high recorded as HH and in daily timeframe, lows going up from LL to HL and high going up from LH to HH hence daily chart is uptrend.
Also, you can predict that Daily HH would be respected as resistance line.
2.Visualize trends direction with colors based on HH/LH/HL/LL.
Background color will change based on break up/down of HH/LH/HL/LL.
———————
トレードを習得する上で多くの人が苦手意識を持つ「目線付け」。
この目線付けをダウ理論を元に訓練するためのインジケーターを開発しました。
高値·安値の更新状況に応じて相場の方向性を色で可視化するため、視覚的に目線付けをすることが可能です。
サンプルチャート
ダウ理論による目線付けの二つの方法
これは僕の持論ですが、ダウ理論による目線付けの方法には、「トレンドは明確なシグナルが出るまで継続する」という原則を共通の拠り所とする二つの方法があると考えています。
一つは日本人投資家/トレーダーにも良く知られている押し安値·戻り高値を基準とする方法。そしてもう一つは高値·安値の切り上げ·切り下げのみを基準とする方法です。
このインジケーターは後者の方法で目線を可視化します。
(もちろん押し安値·戻り高値と併用した目線判断にも活用可能です。)
機能
1.上位足とチャートの時間軸両方のHigher High/Lower High/Higher Low/Lower Low(HH/LH/HL/LL)の表示(MTF機能)
上位足タイムフレームのHH/LH/HL/LLとチャートタイムフレームのHH/LH/HL/LLを同時に表示することができます。
チャートタイムフレームのHH/LH/HL/LLはダウ理論に基づくトレンドの継続・反転の判断用に、上位足のHH/LH/HL/LLは上位足での高値・安値の切り上げ/切り下げ判断及びレジスタンス・サポートとして使うことができます。
上位足の選択には自動モードとマニュアルモードが選択可能です。自動モードを選択した場合、チャートのタイムフレームに応じて上位足が自動的に決定されます。マニュアルモードの場合は選択した時間軸が上位足タイムフレームとして適用されます。
上位足のHH/LH/HL/LLは選択したタイムフレーム未満でのみ表示されます。例えば上位足のタイムフレームとして日足を選択した場合、日足のHH/LH/HL/LLは日足未満でのみ表示されます。
サンプルチャート (AUDJPY 4H に日足のHH/LH/HL/LL を表示)
このチャートでは二つの異なるタイムフレームの高値・安値更新状況を一度に把握することができます。
4Hでは高値の切り上げが発生しているため、安値を更新しなければ上昇トレンド確定です。一方日足では安値がLLからHLへ(赤の矢印)、高値がLHからHHへと切り上がり(緑の矢印)、上昇トレンドであることがわかります。
また、この場面では上位足のHHがレジスタンスとして機能する可能性も予測できます。
2.目線の方向を色で可視化
HH/LH/HL/LLの更新状況から目線を判断し、背景色とともに可視化します。
Higher High/Lower High/Higher Low/Lower Lowとは何か?
日本人投資家/トレーダーの中にはあまり馴染みのない方もいるかと思いますので、定義を記載します。
Higher High(HH)
切り上がった高値を意味します。当インジケーターでは一つ前の高値(HH/LH)から切り上がった場合にHHとしています。
Lower High(LH)
切り下がった高値を意味します。Lower Highなのでより低い方の高値という意味です。当インジケーターでは一つ前の高値(HH/LH)から切り下がった場合にLHとしています。
Higher Low(HL)
切り上がった安値を意味します。Higher Lowなのでより高い方の安値という意味です。当インジケーターでは一つ前の安値(HL/LL)から切り上がった場合にHLとしています。
Lower Low(LL)
切り下がった安値を意味します。当インジケーターでは一つ前の安値(HL/LL)から切り下がった場合にLLとしています。
使い方
高値·安値の切り上げ·切り下げの判断及びトレンド継続·転換の判断に活用

Up & Down Trend following trading strategy for BTC/USDT 3hThis strategy is based on multi time frame technical indicators such as;
1. RSI (10,50,100)
2. MFI (10,50,100)
3. RVI (10,50,100)
4. BOP (10,50,100)
5. Super Trend
6. SAR indicator
7. Higher highs and lower lows
8. SMA (9,500)
9. EMA (9,200)
After evaluating different parameters provided by those indicators, script is in a possition to determine optimul positions to enter in to market as well as exit from the market. In some cases stratergy will exit fully or partially depends on the situation. Other than that, this strategy is in a possition to calculate and specify the quantity you need to buy or sell depending on market situation. You can specify amount available for investment and how many times you are going to average (if downtrend). Parameters are optimised to BTC/USDT, 3h standerd candlestic chart.
goodluck

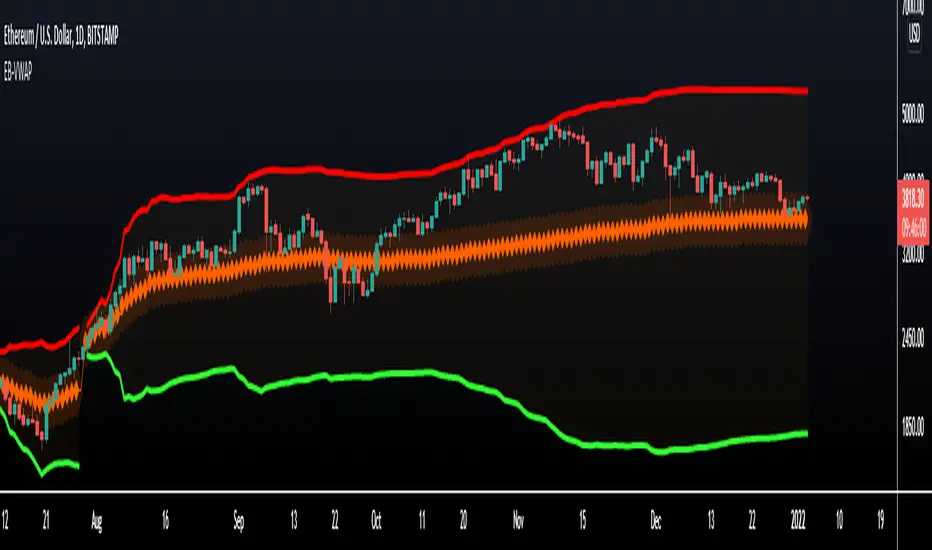
VWAP Bands - Event Based [LuxAlgo]This indicator returns VWAP bands with a degree of smoothness resetting based on various user-selected events. The bands are constructed using a VWAP based naive standard deviation.
The indicator can be anchored or start from the first bar and can be used as trailing support/resistance, in a moving average crossover system, or as source for external indicators.
Settings
Start: VWAP anchor point
Start At First Bar: Display the VWAP from the first bar instead of a specified anchor point
VWAP
Length: Controls certain characteristics of the user-selected event
Mult: Multiplicative factor for the VWAP standard deviation
Source: Price source of the indicator
Event
Event: Determines the event resetting the degree of smoothness of the VWAP
External Cross/Event: Input source used for external crosses/events
Further details about the available events are given below.
Details
Various event conditions are available to the users. When the selected event occurs, the VWAP equals the current closing price.
By default, the event is periodic, that is the VWAP resets periodically, with a period determined by the Length setting.
The Higher High event resets the VWAP when a new higher high occurs.
The Lower Low event resets the VWAP when a new lower low occurs.
The Trend Change event is similar however resets the VWAP only once a higher high or lower low occurs. Higher highs and lower lows are given by Donchian channels with a period determined by the Length setting.
The Start event reset the VWAP at the selected anchor point (or first bar if the "Start At First Bar" setting is selected). This can be useful if one only needs a regular anchored VWAP band indicator.
The External Cross event resets the VWAP when the Source price crosses the series selected in the External Cross/Event setting. In the image above the VWAP resets when the price crosses the volatility stop indicator.
The External Event resets the indicator when a series selected in the External Cross/Event setting is not equal to 0. This allows using a custom event in order to reset the VWAP. In the above example the VWAP is reset during a new session due to the External Session indicator.
SequenceSee the highs and lows easily!
Up sequence:
The close of each candle is higher from the low of the previous candle.
* The reference will always be to the low of the highest candle in the up sequence
Down sequence:
The close of each candle is lower from the high of the previous candle.
* The reference will always be to the high of the lowest candle in the down sequence
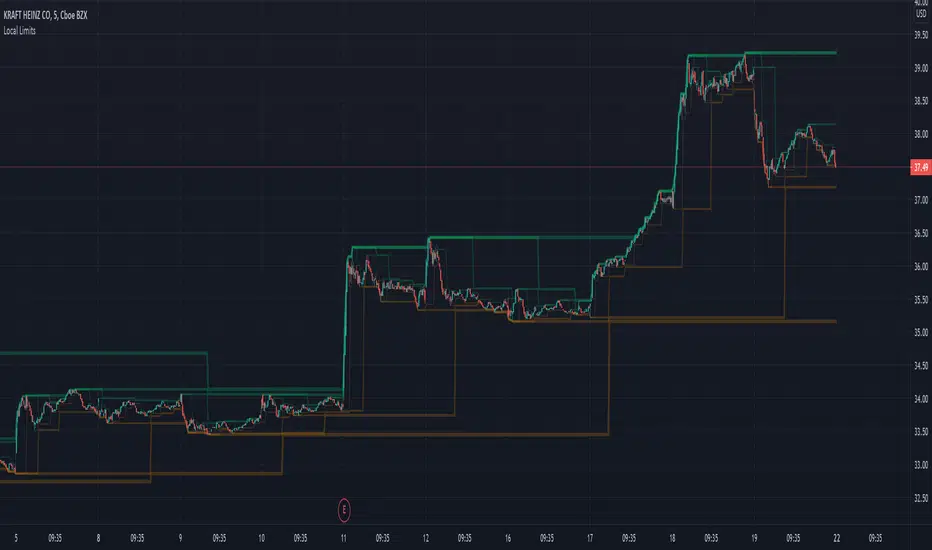
LocalLimitLibrary "LocalLimit"
Calculates the local upper or local lower limit for a given series. Applying multiple passes produces what appears like support or resistance levels.
See Local Limits for more detail.
upper(src) Produces the recent local upper limit for a given series.
Parameters:
src : The source series to derive from.
lower(src) Produces the recent local lower limit for a given series.
Parameters:
src : The source series to derive from.

Tripple super Trend + EMA + RSI StrategyGreetings!
Here I show you the Tripple Super Trend Strategy.
I discovered the strategy on a YouTube channel and tried to transfer it as a strategy into a script.
Tested with the currency pair EUR/USD in the one hour chart.
Period: beginning of 2020 until today.
The strategy should also work with cryptocurrencies. But then the settings have to be adjusted.
There is the possibility to activate only long or only short position.
The EMA can be used in a time different from the chart.
-----------------------------------------------------------------------------------
How does the strategy work?
For long positions, the candle must be above the EMA .
The candle must be closed above at least two of the supertrend lines.
The stochastic RSI must show oversold and the k line must cross over the D line.
For short positions, the candle must be below the EMA .
The candle must be closed below at least two of the supertrend lines.
The stochastic RSI must indicate overbought and the K line must cross below the D line.
The stop loss is determined with the "lowest low/highest high lookback".
The profit factor is multiplied by the value of the lowest low/highest high lookback.
The results of the strategy are without commissions and levers.
If you have any questions or feedback, please let me know in the comments.
In the future I will add other types of stop loss / take profits. (ATR; %; eg.)
If you need more information about the strategy and want to know exactly how to apply it, check out my profile.
I wish you good luck with the strategy!

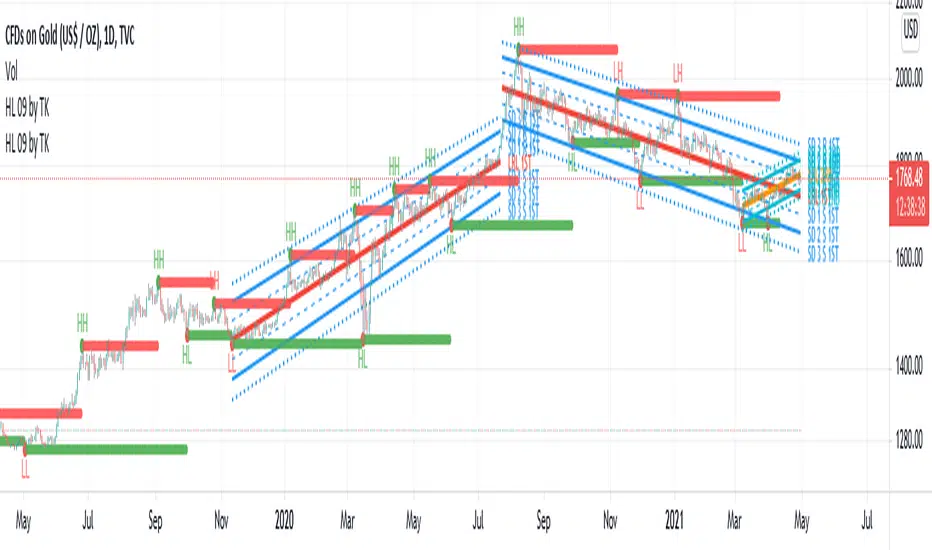
TradiKator 09 HH HL LH LL & Linear Regression
TradiKator 09 HH HL LH LL & Linear Regression indicates whether current price movement exceed the trend or not.
Here, we use Higher High,Higher low, Lower High, Lower Low to identify a possible change of trend.
Also we use 2 Linear Regression Channels (short term & long term) to identify a price trend.
I hope this indicator can help traders to estimate trend change in the essential trading behavior.
1)Higher High,Higher low, Lower High, Lower Low
Higher High and Higher Low indicates a Bull trend
Lower High and Lower Low indicates a Bear trend
Those high low pivot points is a verg good mark to judge if current trend keeps going on or not.
Setting :
Left pivot length
Right pivot length
The longer pivot length is , the less sensetive and more delay you signal will be, especially the right privot
2)Linear Regression Channels
Linear Regression Line – is a line drawn according to the least-squares statistical method which produces a best fit line
The resulting can be used to predict price trend from the same system.
Setting :
Count ---> the length of the Linear Regression, remember more data in interest = less accuracy and bigger sigma
The End bar of Linear Regression ---> If you don't want latest K bar in the Linear Regression interest (they are not in the same trend), then you can move the Linear Regression to earlier bar
This indicator is inspired by GDT who is a great coder.
Known issue:
Not yet.
LH-LL/HL-HH Confirmation Trend LineBased on Dow Theory, a series of successive higher highs (HH) and higher lows (HL) is the sign of an uptrend (bull trend) and a series of successive lower highs (LH) and lower lows (LL) is the sign of a downtrend (bear trend).
So this script indicates the trends using the concept and draws corresponding trend lines.
It took some effort to make it possible for users to see as many trend lines as they wish. Eventually the user could set the number alongside some other options in the indicator settings.
Use the script and send me your thoughts!

Local LimitsDisplays recent higher highs, lower highs, lower lows, and higher lows as a collection of local limit indicators.
In its simplicity is a lot more powerful than might appear at first glance.
Does not rely on volatility calculation.
Can be linked together to create an objective view of recent support and resistance levels.
Makes current trends more visible.
Excellent for use as a trailing stop algorithm.
Parameters
Single Bar Sensitivity: True (default) reacts to individual bars. False only responds to the alignment of 2 bars.
Margin (1-5): Adds extra distance from higher lows and lower highs to reduce the sensitivity of broken trends.
Single indicators with configurable sources:
Local Limit Higher
Local Limit Lower
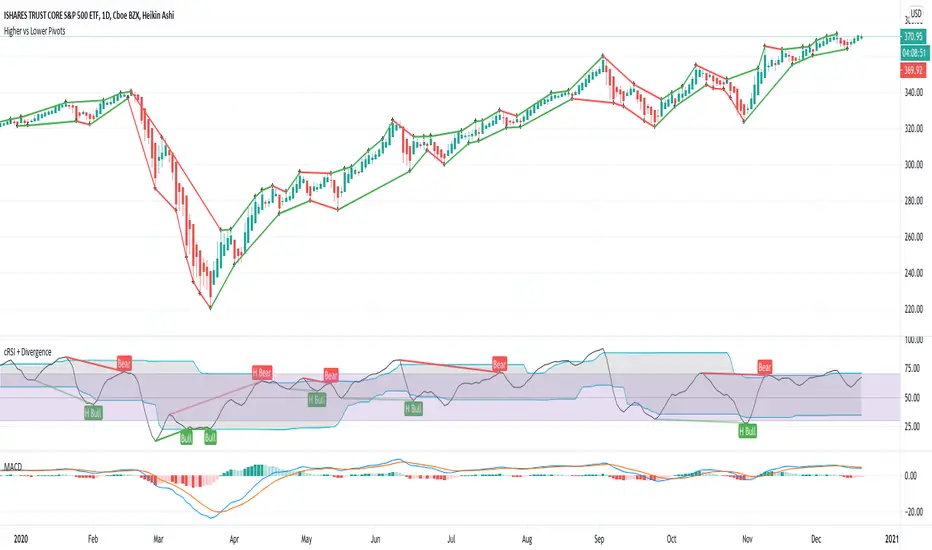
Higher vs Lower Pivots overlayA simple script that I made that draws lines between the high and low pivots. The color of the line define if the pivot is higher or lower than the previous pivot. The main thing to tune is the pivot look back vs look ahead, which are the same params used by the tradingview pivot indicator. There are several other params you can tweaks to get the look you want.
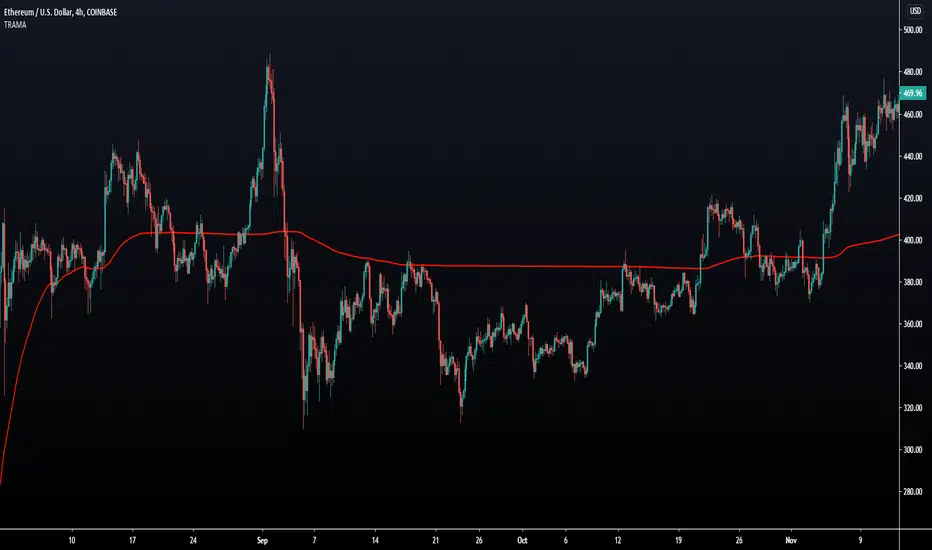
Trend Regularity Adaptive Moving Average [LuxAlgo]The following moving average adapt to the average number of highest high/lowest low made over a specific period, thus adapting to trend strength. Interesting results can be obtained when using the moving average in a MA crossover system or as a trailing support/resistance.
Settings
Length : Period of the indicator, with higher values returning smoother results.
Src : Source input of the indicator.
Usage
The trend regularity adaptive moving average (TRAMA) can be used like most moving averages, with the advantage of being smoother during ranging markets.
Notice how the moving closer to the price the longer a trend last, such effect can be practical to have early entry points when using the moving average in a MA crossover system, such effect is due to the increasing number of average highest high/lowest low made during longer trends. Note that in the case of a significant uptrend followed by a downtrend, the moving average might penalize the start of the downtrend (and vice versa).
The moving average can also act as an interesting trailing support/resistance.
Details
The moving average is calculated using exponential averaging, using as smoothing factor the squared simple moving average of the number of highest high/lowest low previously made, highest high/lowest low are calculated using rolling maximums/minimums.
Using higher values of length will return fewer highest high/lowest low which explains why the moving average is smoother for higher length values. Squaring allows the moving average to penalize lower values, thus appearing more stationary during ranging markets, it also allows to have some consistency regarding the length setting.
🧙 this moving average would not be possible without the existence of corn syrup 🦎