CSRS v2Candlesticked RSI v2 for price action traders!
See the True Momentum.
6 chart type, smooth RSI , add signal lines, find divergences, special alerts
This is 2nd version with major upgrade
Improved and more powerful
fully customizable.
features:
See RSI in 6 type of chart(Candles, Hollow Candles, Siwi Candles, Heikin Ashi, HL Bar, Line)
Monitor Up to 3 RSI , each one at desired resolution, source and length
Smooth each one of chart separately to remove noises
Add up to 3 signal line to primary chart in your desired source and type( SMA , EMA , WMA , HMA )
Find divergences which has special parameters
Gradient color adjustment of line chart
Add alert for reaching to important levels and detected divergences
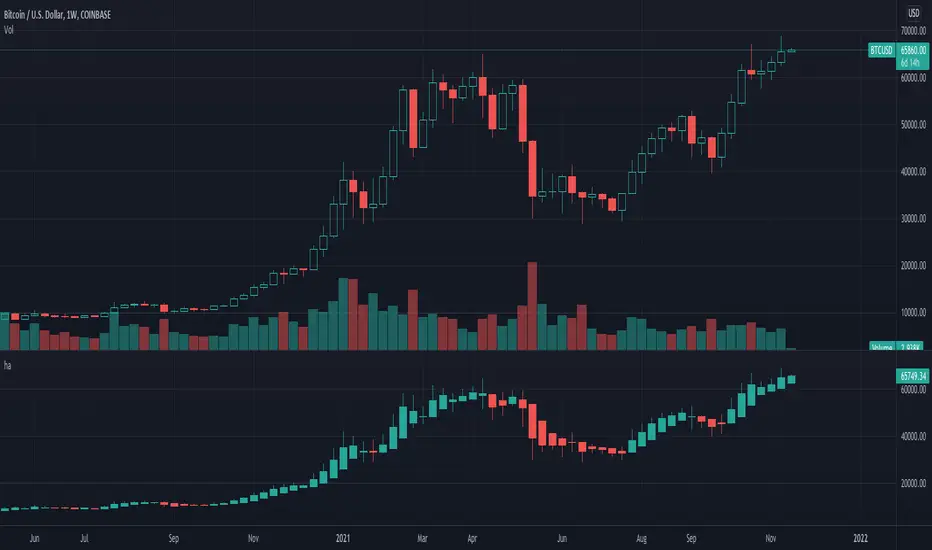
Heikin

Heikin Ashi Trend IndicatorMy own implantation of Heikin Ashi which i call HAT.
The Heikin Ashi Trend Indicator (HAT) used to determine the price direction of an asset, as well as draw attention to when the price direction is changing.
The HAT indicator translates the current close/open/high/low into Heikin Ashi and smooths them a bit using Tilson T3 formula.
Buy signal when Heikin Ashi Close is bigger than Heikin Ashi Open with Tilson T3 smoothing.
Sell signal when Heikin Ashi Open is bigger than Heikin Ashi Close with Tilson T3 smoothing.
Set the 'percentSqueeze' percentage to display possible reversal with light Red/Green crosses.
Green - Up Trend
Light Green - Possible reversal is near
Red - Down Trend
Light Red - Possible reversal is near
Follow for more indicators: www.tradingview.com

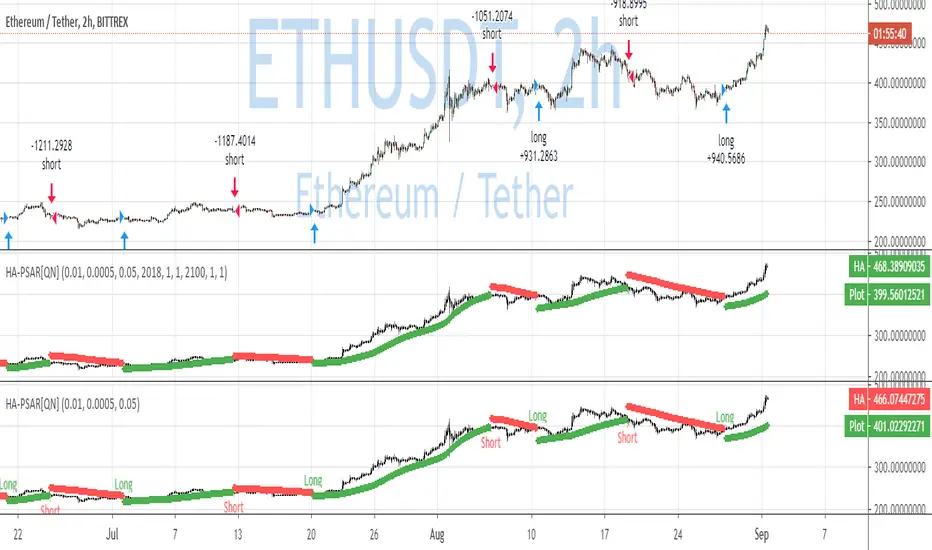
QuantNomad - Heikin-Ashi PSAR AlertsUsing this script you can create alerts for my Heikin-Ashi PSAR Strategy:
When creating alerts use "Once Per Bar Close" in parameters.
####################
Disclaimer
Please remember that past performance may not be indicative of future results.
Due to various factors, including changing market conditions, the strategy may no longer perform as good as in historical backtesting.
This post and the script don’t provide any financial advice.
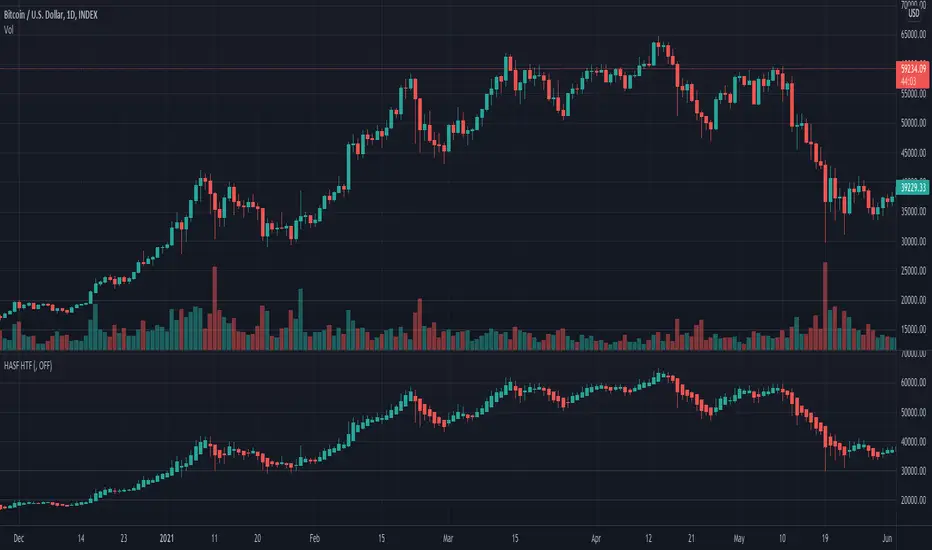
Heikin-Ashi Source Function HTFHigher TimeFrame using custom source function for toggling traditional Candle sources or Heikin-Ashi sources on a traditional Candles chart.
Thanks to PineCoders for rounding method: www.pinecoders.com
Thanks to @LucF and @RicardoSantos for their advice and enlightenment as always.
NOTICE: This is an example script and not meant to be used as an actual strategy. By using this script or any portion thereof, you acknowledge that you have read and understood that this is for research purposes only and I am not responsible for any financial losses you may incur by using this script!
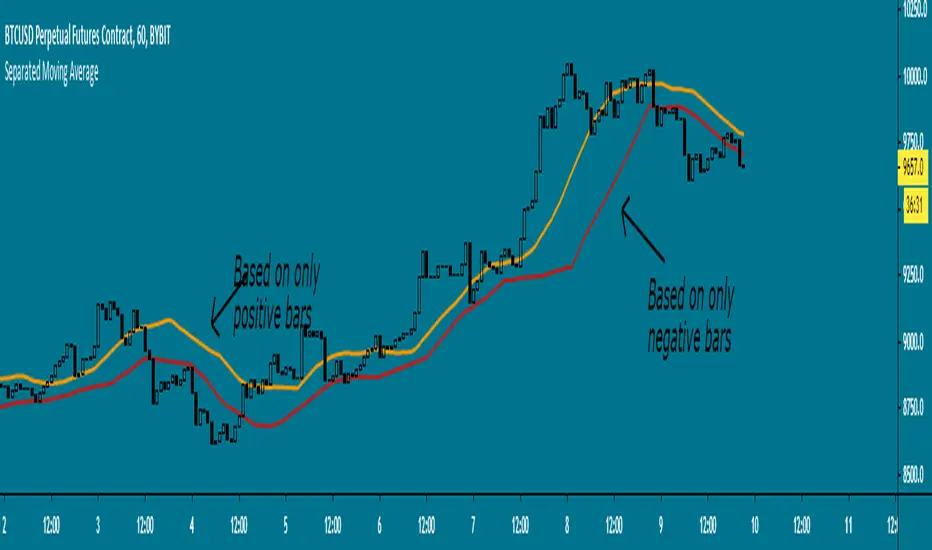
Separated Moving Average - evoHere are two moving averages, one based on positive candles and the other based on negative candles. If the current bar is positive, the negative MA will use its last known negative bar for the calculation. The default setting uses Heikin Ashi to smooth the candles with the trend, you can turn this off if you want in inputs.
Let me know if you find it useful :)
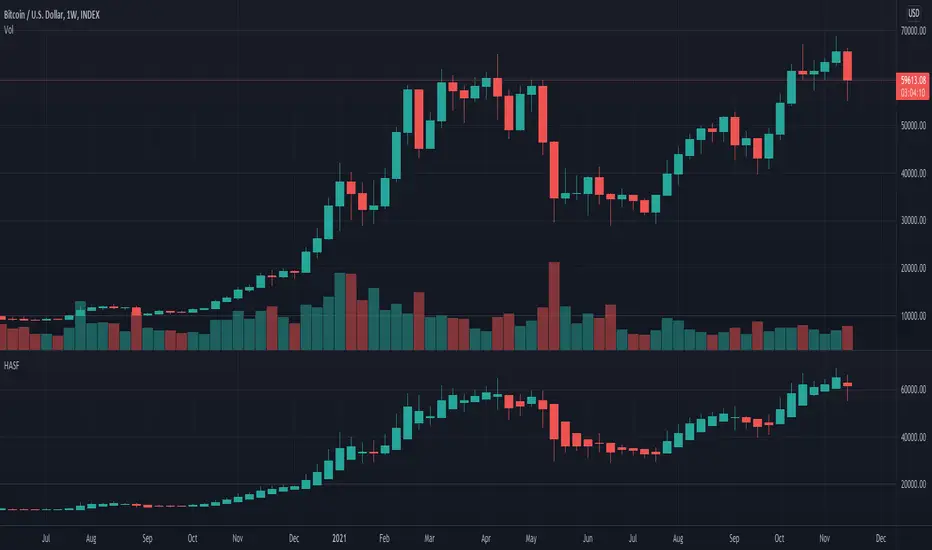
Off-chart 21 MA, Bollinger Bands and Heikin Ashi CandlesThis off-chart indicator provides three basic and useful tools for trend trading in Bitcoin and probably other markets. Heikin Ashi candles being utilized with classic candle patterns at the same time could be considered as a conservative and safe confirmation approach for entring your position.

21 MA, Bollinger Bands and Heikin AshiThis on-chart indicator provides three basic and useful tools for trend trading in Bitcoin and probably other markets. Moving and Bollinger lines act as strong support and resistance in 4H resolution. Heikin Ashi candles being utilized with classic candle patterns at the same time could be considered as a conservative and safe confirmation approach for entring your position.

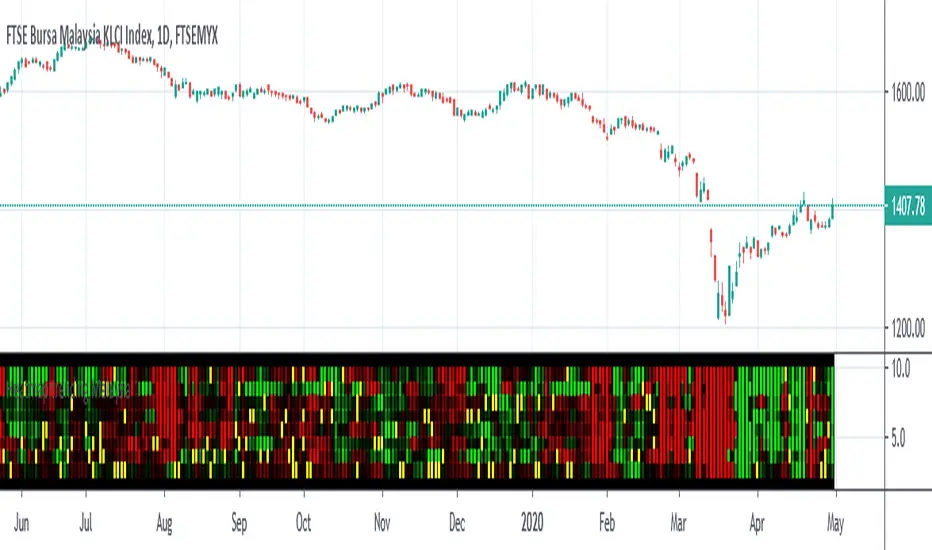
Heatmap trending MalaysiaThis heatmap chart is created base on Heikin Ashi trend for Malaysia Major Index
CONSTRUCTN ,TECHNOLOGY,FINANCE,CONSUMER,PROPERTIES,IND-PROD,PLANTATION,REIT.
This allow compare to malaysia stock for macro trending.
Lastly ,thank to LonesomeTheBlue which inspire me for this coding .
Heikin-Ashi Source FunctionCustom source function for toggling traditional Candle sources or Heikin-Ashi sources on a traditional Candles chart.
Thanks to PineCoders for rounding method: www.pinecoders.com
Thanks to @LucF and @RicardoSantos for their advice and enlightenment as always.
NOTICE: This is an example script and not meant to be used as an actual strategy. By using this script or any portion thereof, you acknowledge that you have read and understood that this is for research purposes only and I am not responsible for any financial losses you may incur by using this script!
Briz HA MTF - A Heikin-Ashi Multi-Timeframe Indicator Ever wanted to know what Heikin-Ashi candles are showing for multiple time frames at a glance? Adjustable time frame for each row. Arrows show when each column is either all green (white up arrow) or all red (yellow down arrow).


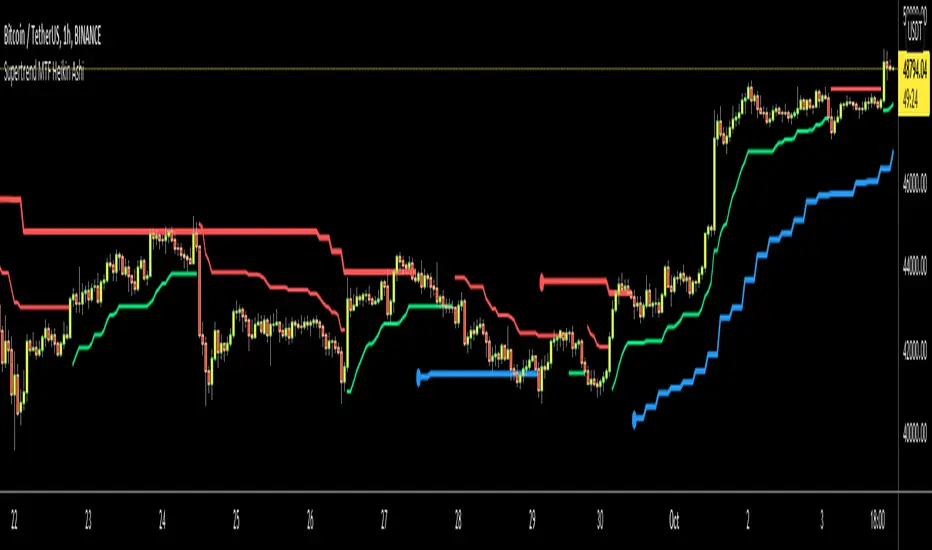
Supertrend MTF Heikin AshiThis is non-repaiting Supertrend Multi Time Frame script, uses Heikin Ashi Candles as source on normal chart
There is an option for Higher Time Frame. if you choose "Auto" then Higher Time Frame calculation is made by the script. If you choose "User Defined" option and then you can select Time Frame.
You better use this script with other indicators such as RSI, Momentum etc.
Enjoy!
BERLIN CandlesA problem with Heikin Ashi is that while it gives you a great overview of overall direction, it is rarely possible to use it as a replacement for normal japanese
candlesticks. The reason for this is that actual price data is lost, since the candles are more akin to a moving average than a different way to see price action. Also, with Heikin Ashi, most of the actual price action is lost, because the candles can be bigger than the high and low of the underlying japanese candlestick.
With BERLIN Candles I have tried to fix that problem. By using a smoothed out version of the previous Heikin Ashi candle close as the current BERLIN Candle open, the high and low of the actual japanese candlestick for the high and low of the BERLIN Candle, and the current Heikin Ashi close as the BERLIN Candle close, while setting hard limits for BERLIN Candle open and close values so that they can never exceed the high and low of the underlying japanese candlestick.
One problem still persists though. The actual current price data is lost. However, the BERLIN Candles have solved this by adding a fifth part to the candles. The close of the underlying japanese candlesticks are indicated with a plus-sign. This way, actual price data is never lost, while keeping all of the other benefits of this type of candles.
A few added bonuses:
The addition of the 14 period ATR at the latest candle
The baseline from Ichimoku is included as an option
The 14 period ATR value of each candle can be seen in the indicator data as
the orange value

Trendy Bar Trend ColorTrendy Bar Trend Color
Inspired by trend candlestick charts on other trading platforms. Changes bar colors to stay in trend much like Heikin Ashi candles without the ATR price distortion. This is done by comparing the HL2 and/or Open-Close values of current candlestick to the prior candlestick.

SBER HA Smooth ContainerSBER's modified Heikin Ashi Smoothed Container
Uses EMA 16 and Heikin Ashi Candles.. For NIFTY and its stocks only.

Heiken Ashi Triangles at the Top and Bottom of ScreenHeiken Ashi Triangles at the Top and Bottom of Screen
The image below shows the comparison to actual Heiken Ashi candles
(Though changing from candles to Heiken Ashi tends to smooth the triangles a little)

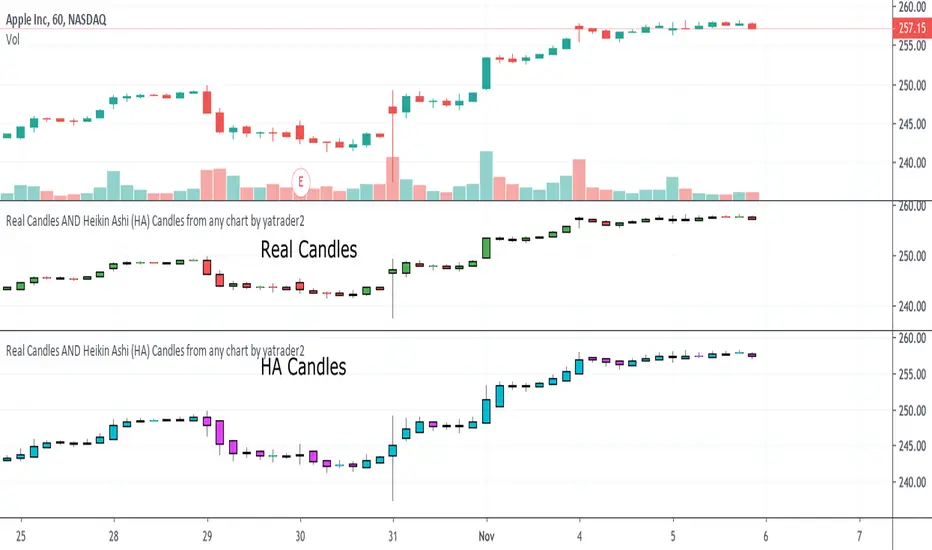
Real Candles Heikin Ashi (HA) Candle functionsThis script plots both real and HA candles regardless or which are used on the chart in TV settings.
(and has the functions for you to use.)
Lots of people seem to misunderstand backtesting (or scam people) based on HA candles.
Backtesting with HA candles leads to impossible trades. ALWAYS backtest with real candles.
That doesn't mean you might not want to look at HA candle values to make trading decisions.
Add the code below to calculate HA candles from real and use that in your HA trading algo,
but test it on real charts.
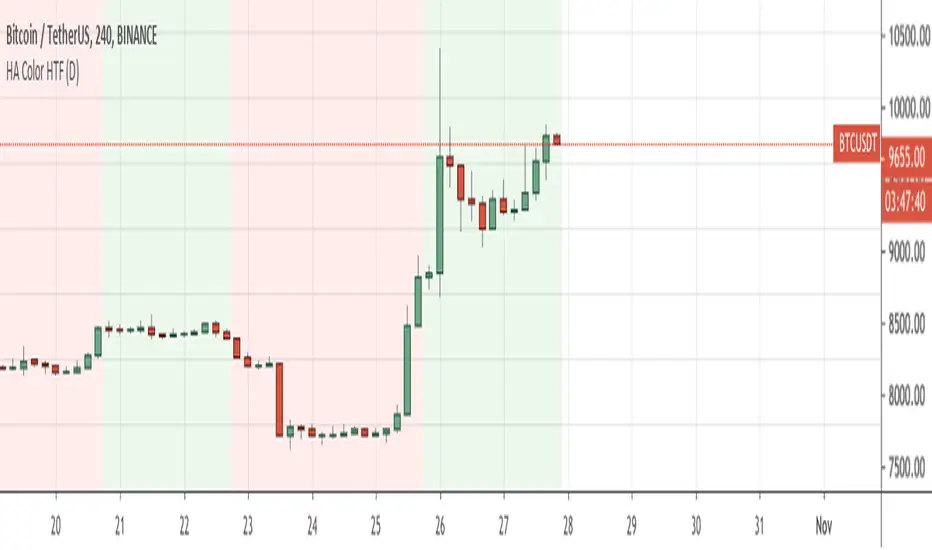
QuantNomad - Heikin Ashi Colors Higher TimeframeSimple script displaying color of Heiken Ashi candles from higher timeframes as a background.
Heiken-Ashi CandlesSimple script to view Heiken-Ashi candles below a normal candles chart.
Could also be useful for using HA calcs in strategy scripts on normal candles chart for proper backtesting.
I adapted this to v4 from original v2 script by @samtsui. If you like please remember to give him a Thumbs Up for his original version! ->
Smooth HA Candles MTF v1So this is last version of HA
this one has all MA type to choose from and MTF

HA Candles MTFJust try to make non repainting MTF candles
cross over of open and close , seen by small triangles

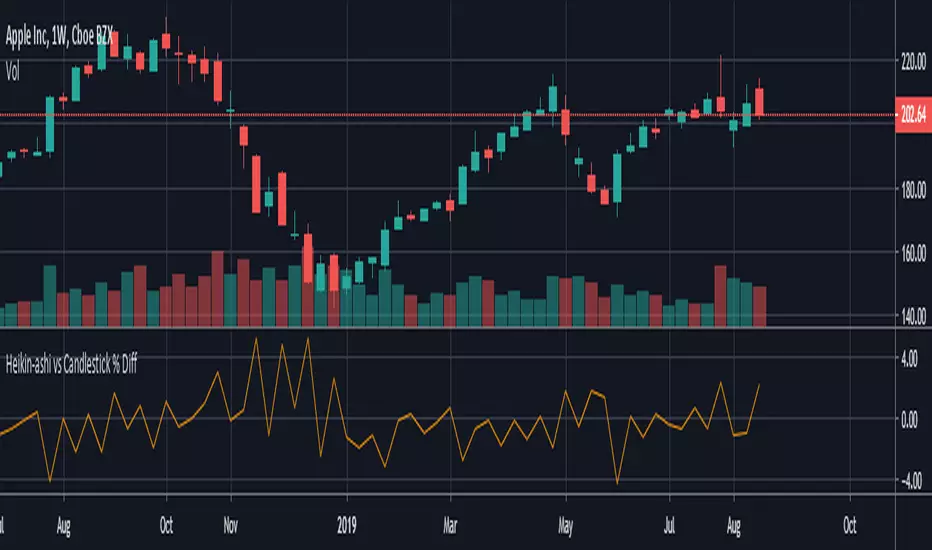
HeikinAshi - Candlestick % Difference This script shows the price difference ( %) between heikin ashi and candlestick for all investment instruments as Close, Open, High and Low. (Switchable )
In this way, you can see which instruments can easily use heikin ashi .
And by taking averages you can find the opportunity to compare which investment tools are more risk-free.
[RESEARCH] Chart Type IdentifierA viable and workable concept of chart type identification using Pine Script.
Was wollen wir trinken , sieben Tage lang
Was wollen wir trinken, so ein Durst!
Was wollen wir trinken, sieben Tage lang
Was wollen wir trinken, so ein Durst!
