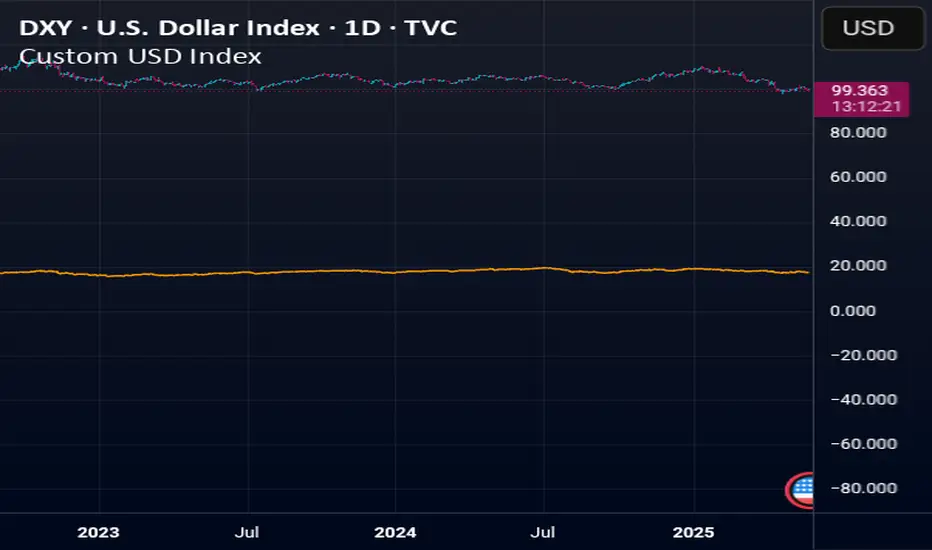
Custom USD IndexThis is a modernized, expanded version of the U.S. Dollar Index (DXY), designed to provide a more accurate representation of the dollar’s global strength in today’s diversified economy.
Unlike the traditional DXY, which excludes major players like China and entirely omits real-world stores of value, this custom index (DXY+) includes:
Fiat Currencies (78.3% total weight):
EUR, JPY, GBP, CAD, AUD, CHF, and CNY — equally weighted to reflect the global currency landscape.
Gold (17.5%):
Gold (XAUUSD) is included as a traditional reserve asset and inflation hedge, acknowledging its continued monetary relevance.
Cryptocurrencies (2.8% total weight):
Bitcoin (BTC) and Ethereum (ETH) represent the emerging digital monetary layer.
The index rises when the U.S. dollar strengthens relative to this blended basket, and falls when the dollar weakens against it. This is ideal for traders, economists, and macro analysts seeking a more inclusive and up-to-date measure of dollar performance.
การวิเคราะห์ปัจจัยพื้นฐาน
Sentival | QuantEdgeBIntroducing Sentival by QuantEdgeB.
An Adaptive Multi-Factor Indicator for Market Valuation & Trend Strength
____
Overview
The Sentival Valuation System is a medium-term, multi-factor valuation tool designed to assess market conditions using a combination of momentum, mean reversion, and risk-adjusted metrics. It provides traders and investors with a dynamic score reflecting market valuation, ranging from strongly oversold to strongly overbought conditions.
This system leverages a diverse range of technical indicators, including momentum oscillators, volatility measures, risk ratios, and mean-reversion metrics, providing a holistic view of market conditions.
____
1. Key Features
🛠 Multi-Factor Valuation Model
Sentival aggregates nine different indicators, normalizing and rescaling them into a standardized z-score-based valuation system. The final output represents an average of the selected indicators, allowing for flexible customization based on the user’s preference.
📊 Customizable Indicator Selection
Users can enable or disable any of the nine valuation factors, ensuring the system adapts to different market environments, trading styles, and assets.
🔄 Multi-Timeframe Adaptability
Sentival can be used across different time horizons, making it suitable for short-term mean reversion, medium-term traders, or long-term valuation analysis by simply adjusting the timeframe and indicator settings. This flexibility allows traders to adapt Sentival to various market conditions and trading objectives.
🎨 Intuitive Dashboard & Color Coding
- Dynamic Heatmap & Dashboard: Displays valuation strength across multiple factors.
- Gradient-Based Overbought/Oversold Signals: Clear color-coded signals for easy interpretation.
- Background Highlighting: Optional oversold/overbought background zones.
🏆 Statistical & Risk-Based Insights
- Standardized Rescaling & Z-Score Analysis to prevent bias from individual indicators.
- Risk-Adjusted Metrics such as Sharpe, Sortino, and Omega Ratios help assess the overall market risk appetite.
- Trend Following Mode (TF Display): Users can enable the "Trend Following" option to display the trend direction, helping to align valuation signals with the broader market trend.
____
2. How It Works
Sentival is a multi-factor trend and momentum analysis system, designed to track market cycle shifts using a combination of volatility, momentum, risk assessment, and valuation mechanisms. Instead of focusing on one dimension of the market, Sentival integrates multiple methodologies to cross-validate signals and reduce noise. Each indicator in Sentival plays a specific role, ensuring confirmation across different market conditions.
How Each Component Works Together
1️⃣ Chande Momentum Oscillator (CMO)
• A momentum-based measure that determines whether price action is dominated by upward or downward forces.
• Works well in combination with volatility measures to confirm whether a move is sustainable.
2️⃣ Disparity Index
• Measures the distance between price and its moving average, acting as an overextension filter.
• Ensures that trend-following signals are not driven by short-term spikes but sustained trends.
3️⃣ Bollinger Bands % (BB%)
• A volatility measure that indicates how far price is from the statistical mean.
• Helps identify trend exhaustion points where price moves become unstable.
4️⃣ Relative Strength Index (RSI)
• A trend confirmation layer, ensuring that momentum strength aligns with price movement.
• Adds an additional check to prevent false breakouts.
5️⃣ Rate of Change (RoC)
• Captures the speed of price movement, ensuring that the market has enough momentum for trend continuation.
• Works well with risk indicators to filter weaker moves.
6️⃣ Price Z-Score
• A statistical tool to measure how far price is from its long-term equilibrium.
• Helps prevent entering overstretched trends too late.
7️⃣ Risk Ratios (Sharpe, Sortino, Omega)
• This is the risk-adjusted performance component, ensuring that trends have a healthy risk-reward balance.
• Helps determine when a trend has structurally strong backing rather than speculative movement.
8️⃣ Hurst Cycle Analysis
• Measures the persistence of trends by analyzing price fractals.
• Ensures that the market regime is either trending or mean-reverting, improving trade confidence.
9️⃣ Commodity Channel Index (CCI)
• Helps identify strong trend conditions, adding another layer of momentum confirmation.
• Works well with other oscillators to prevent misreading counter-trends.
🔗 Why These Components Work Well Together
• Momentum + Volatility + Risk → Instead of relying on a single category, Sentival merges multiple dimensions of market behavior into a cohesive signal.
• Filters Out False Signals → Combining momentum oscillators, volatility measures, and risk-adjusted metrics ensures high-confidence entries.
• Adaptability Across Market Regimes → Whether the market is trending, consolidating, or volatile, the system adjusts dynamically.
• Cross-Validation for Trend Strength → If multiple components align, it increases certainty that a trend is real and sustainable.
____
3. Sentival Scanner - table breakdown
The dashboard-style table generated is designed to give traders a holistic market view at a glance. It processes a variety of technical signals and distills them into readable labels, visual strength bars, and actionable trend states. Here's a breakdown of what each section means:
1. Direction
This section analyzes whether the average Z-score (a composite of several indicators) is increasing, decreasing, or neutral over time. It does this using a smoothed trend of the Z-score, comparing recent values to older ones.
2. Momentum
Momentum is derived from the rate of change (RoC) of the average Z-score. It evaluates how strong the current move is. If momentum is above a certain positive threshold, it’s considered positive, if below a negative threshold, it’s negative, otherwise it’s neutral.
3. Impulse
Impulse reflects the velocity of momentum — in other words, is the market speeding up or slowing down? High positive values suggest strong acceleration (strong impulse), while negative values show deceleration or stalling.
4. Drive
This metric combines momentum and velocity to create a descriptive phrase that captures the market’s behavior. For example:
• “Strong Upside” means strong momentum with acceleration.
• “Fading Downside” means bearish momentum losing steam.
• “Neutral” appears when momentum is indecisive.
5. Deviation Distance
This represents how far the market price is from fair value in terms of standard deviation units (σ). It’s calculated using Z-scores and classified as:
• +1σ, +2σ, etc., for overvalued regions.
• −1σ, −2σ, etc., for undervalued areas.
• “At Fair Value” if close to the mean.
6. Bull and Bear Strength Bars
The system computes both bullish and bearish strength, using distance from fair value, the rate of change, and the velocity. These strengths are displayed as progress bars, giving a quick visual cue of conviction. The table labels them as:
• “Bull Conviction” if there's a long bias.
• “Bull Potential” if bullish but undecided.
• “Bear Conviction” or “Bear Potential” for short-side equivalents.
7. Trend Signal
This is a simple label that tells you if the scanner recommends a Long, Short, or Cash (neutral) stance based on threshold logic. It is based on whether the average Z-score crosses above a long threshold or below a short one.
8. Stage
The “Stage” label summarizes the valuation environment based on the composite Z-score:
• Strong Undervalued
• Moderately Undervalued
• Fair Value
• Overvalued, etc.
This stage helps traders know whether they are operating in cheap or expensive territory statistically.
Summary
Overall, this table merges advanced technical signals like momentum, volatility, valuation, and risk into a digestible format that updates dynamically with each bar. The goal is to provide traders with a 360° perspective on market conditions, tailored for both trend-following and mean-reversion strategies.
___________
4. Sentival Valuation Score & Interpretation
🔹 Sentival Score Ranges
- 📉 Strongly Oversold (-2 and below) → Market is extremely undervalued; potential reversal.
- 📉 Moderately Oversold (-1.5 to -2) → Discounted market conditions, buying interest may emerge.
- 📉 Slightly Oversold (-0.5 to -1.5) → Possible accumulation phase.
- ⚖ Fair Value (-0.5 to +0.5) → Market trading at equilibrium.
- 📈 Slightly Overbought (+0.5 to +1.5) → Initial signs of market strength.
- 📈 Moderately Overbought (+1.5 to +2) → Market heating up, caution warranted, selling interest may emerge.
- 📈 Strongly Overbought (+2 and above) → Extreme valuation, increased risk of correction.
This classification helps traders gauge overall market sentiment and make better allocation decisions.
Note: Past valuations and buy/sell signals generated by Sentival do not guarantee future performance. Market conditions can change, and proper risk management should always be applied.
____
5. Use Cases & Applications
🔹 📊 Market Rotation & Asset Allocation
- Used as a valuation model to determine if a market or asset is undervalued or overvalued.
- Rotational strategies can benefit from the valuation score by switching exposure between assets.
🔹 📈 Medium-Term Trend Identification
- Detects overbought and oversold conditions while filtering out short-term noise.
- Can be combined with other trend-following indicators for confluence-based strategies.
🔹 🔄 Mean Reversion & Momentum Trading
- Provides statistical validation for momentum breakouts or mean reversion signals.
- Useful for long-short trading strategies, determining optimal entry & exit points.
____
Conclusion
Sentival is a powerful universal valuation system for traders and investors seeking a data-driven, multi-factor approach to market valuation. With its combination of momentum, trend, risk-adjusted, and mean-reversion indicators, it provides a robust, adaptable, and statistically sound framework for making informed market decisions.
🔹 Who Should Use Sentival?
✅ Swing Traders & Medium-Term Investors looking for structured valuation metrics.
✅ Quantitative & Systematic Traders incorporating multi-factor models.
✅ Portfolio Managers optimizing exposure to different market regimes.
🔹 Disclaimer: Past performance is not indicative of future results. No trading strategy can guarantee success in financial markets.
🔹 Strategic Advice: Always backtest, optimize, and align parameters with your trading objectives and risk tolerance before live trading.

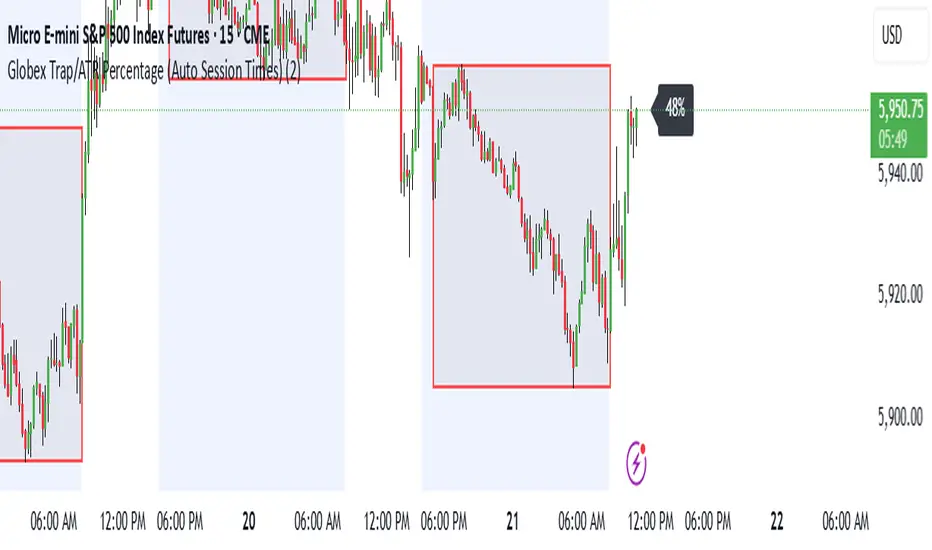
Globex Trap/ATR Percentage (Auto Session Times)This indicator is to be used on the continuous unadjusted charts of all of the futures products that have the possibility of a globex trap (MES1!, MCL1!, etc..) The indicator should be used on a 10 minute chart to get the opening time correctly no matter the product that you are looking at but can be used on any sub-daily chart. The box represents the open, close, high and low of the globex session as defined by the CME. The percentage 5 bars to the right of the last candle represents the price range of the globex session as percentage of the dATR. This percentage should be viewed and documented as close to the session open as possible for the most accurate data as it will change as the session opens.
Levels & Flow📌 Overview
Levels & Flow is a visual trading tool that combines daily pivot levels with a dynamic EMA ribbon to help traders identify structure, momentum, and key decision zones in the market.
This script is designed for discretionary traders who rely on clean visual cues for intraday and swing trading strategies.
⚙️ Key Features
Daily Pivot, Support, and Resistance Lines
Automatically plots the daily pivot level based on the previous day’s OHLC data, along with calculated support and resistance levels.
Fibonacci Retracement Levels
Two dashed lines above and below the pivot represent the retracement of the pivot-resistance and pivot-support range, forming the boundaries of the “no-trade zone.”
No-Trade Zone (Shaded Box)
A gray shaded box between the two Fibonacci levels to visually mark a high-chop/low-conviction zone.
Trend-Based Candle Coloring (Current Day Only)
Candles are colored green if the close is above the pivot, red if below (only on the current trading day).
Bullish/Bearish Trend Label
A small table in the bottom-right corner displays “Bullish” or “Bearish” depending on whether price is above or below the pivot.
20-EMA Gradient Ribbon
A stack of 20 EMAs, each smoothed and color-coded from blue to green to reflect short- to long-term trend alignment.
Cumulative EMA with Adaptive Weighting
An intelligent moving average line that adjusts weight distribution among the 20 EMAs based on recent predictive accuracy using a learning rate and lookback period.
🧠 How It Works
📍 Levels
The script calculates daily pivot, resistance, and support levels using standard formulas:
Pivot = (High + Low + Close) / 3
Resistance = (2 × Pivot) – Low
Support = (2 × Pivot) – High
These levels update each day and extend 143 bars to the right.
📏 Fib Lines
Fib Up = Pivot + (Resistance – Pivot) × 0.382
Fib Down = Pivot – (Pivot – Support) × 0.382
These lines form the “no-trade zone” box.
📈 EMA Ribbon
20 EMAs starting from the user-defined Base Length, each incremented by 1
Each EMA is smoothed using the Smoothing Period
Color-coded from blue to green for intuitive visual flow
Filled between EMAs to visualize trend strength and alignment
🧠 Cumulative EMA Learning
Each EMA’s historical error is calculated over a Lookback Period
Lower-error EMAs receive higher weight; weights are normalized to sum to 1
The result is a cumulative EMA that adapts based on historical predictive power
🔧 User Inputs
Input
Base EMA Length: Sets the period for the shortest EMA (default: 20)
Smoothing Period: Smooths all EMAs and the cumulative EMA
Lookback for Learning: Number of bars to evaluate EMA prediction accuracy
Learning Rate: Adjusts how quickly weights shift in favor of more accurate EMAs
✅ How to Use It
Use the pivot level to define directional bias.
Watch for price breakouts above resistance or breakdowns below support to consider entry.
Avoid trading inside the shaded zone, where direction is less reliable.
Use the EMA ribbon gradient to confirm short/long alignment.
The cumulative EMA helps define trend with noise reduction.
🧪 Best For
Intraday traders who want to blend structure with flow
Swing traders needing clean daily levels with dynamic confirmation
Anyone looking to avoid choppy zones and improve visual clarity
⚠️ Disclaimer
This script is for educational and informational purposes only. It does not constitute financial advice or a trading recommendation. Always test scripts in simulation or on demo accounts before live use. Use at your own risk.

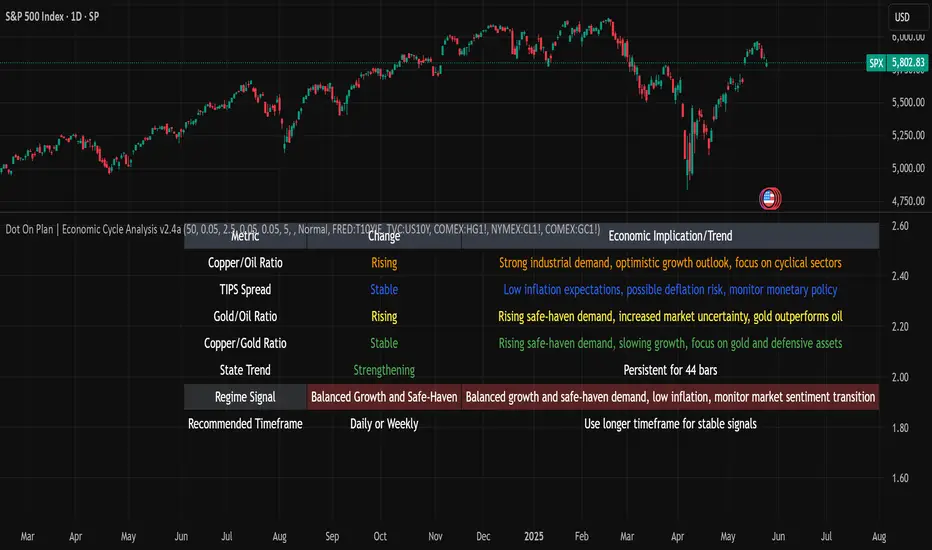
Dot On Plan | Economic Cycle Analysis v2.4This closed-source script applies a structured macroeconomic model to classify economic regimes in real time, using inter-asset ratios and yield spreads. It helps traders and analysts interpret broader market conditions—such as expansion, stagflation, deflation, or supply shocks—through well-established market proxies.
🔍 Core Metrics and Logic
The script tracks the following macro indicators:
- **Copper/Oil Ratio**: A proxy for industrial activity vs. energy costs (Copper futures ÷ Oil futures). A rising ratio signals growth optimism; a falling ratio suggests weakening demand.
- **TIPS Spread (Breakeven Inflation)**: The difference between 10Y Treasury yields and 10Y TIPS yields, reflecting inflation expectations. A high spread indicates inflationary pressure.
- **Gold/Oil Ratio**: Measures market stress (Gold futures ÷ Oil futures). A rising ratio often appears in disinflationary or crisis environments.
- **Copper/Gold Ratio**: A "growth vs. safety" indicator. Rising indicates risk-on confidence; falling suggests risk aversion.
Each ratio is smoothed with a moving average to identify trends, evaluating direction and momentum. Trend strength is assessed using a short-term slope and a statistical threshold to detect persistence.
🧭 Economic Regime Classification
The script combines these metrics to identify 17 distinct economic states, such as:
- Typical Expansion: Indicates strong growth and inflation expectations with low safe-haven demand.
- Stagflation Risk: Reflects cost-push inflation with weak growth and high safe-haven demand.
- Supply Shock Conditions: Signals rising inflation and uncertainty, often due to geopolitical events.
Regime classification is based on the interaction of these metrics and their positioning relative to long-term trends. The specific weighting and logic are proprietary, ensuring a unique approach.
📊 Features
- Live macro regime status table with trend updates and economic implications.
- Visual plots of key ratios and optional moving averages.
- Customizable alerts for key regimes (e.g., stagflation onset, expansion reentry).
- Full customization for MA periods, ratio thresholds, TIPS threshold, and table update frequency.
📈 How to Use
- Apply on daily or weekly charts for stable macro signals (adjustable via "Data Timeframe" input).
- Customize thresholds and MA periods to match your market view.
- Use regime outputs to guide allocation (e.g., cyclical assets in expansion, defensive assets in stagflation).
⚠️ Disclaimer
This script is for informational and educational purposes only and does not constitute financial or investment advice. Past performance is not indicative of future results. Always conduct your own research and consult a qualified financial advisor before trading. The underlying calculation logic is proprietary and not disclosed in full.
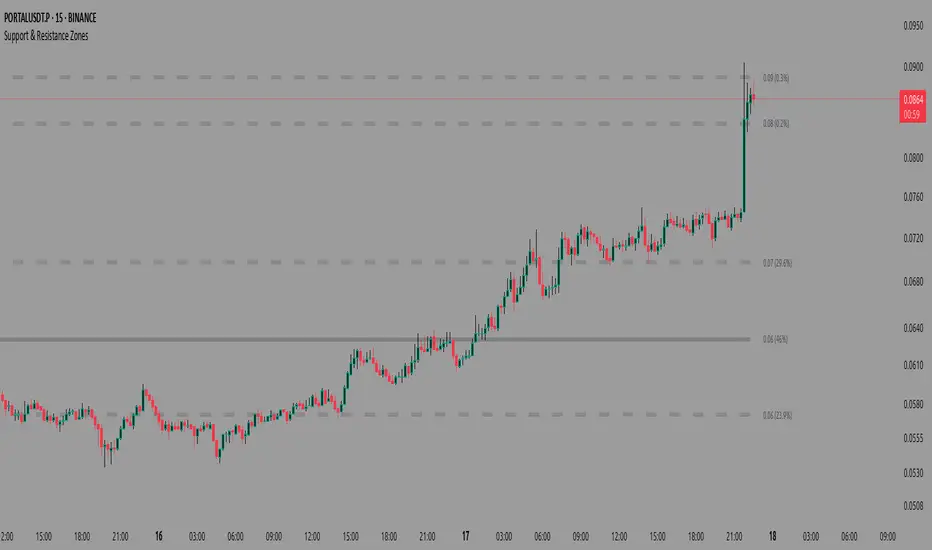
Support & Resistance ZonesAdvanced Support & Resistance Detection Algorithm
This indicator identifies meaningful price levels by analyzing market structure using a proprietary statistical approach. Unlike traditional methods that rely on simple swing highs/lows or moving averages, this system dynamically detects zones where price has shown consistent interaction, revealing true areas of supply and demand.
Core Methodology
Price Data Aggregation
Collects highs and lows over a configurable lookback period.
Normalizes price data to account for volatility, ensuring levels remain relevant across different market conditions.
Statistical Significance Filtering
Rejection of random noise: Eliminates insignificant price fluctuations using adaptive thresholds.
Volume-weighted analysis (implied): Stronger reactions at certain price levels are given higher priority, even if volume data is unavailable.
Dynamic Level Extraction
Density-based S/R Zones: Instead of fixed swing points, the algorithm identifies zones where price has repeatedly consolidated.
Time decay adjustment: Recent price action has more influence, ensuring levels adapt to evolving market structure.
Strength Quantification
Each level is assigned a confidence score based on:
Touch frequency: How often price revisited the zone.
Reaction intensity: The magnitude of bounces/rejections.
Time relevance: Whether the level remains active or has been broken decisively.
Adaptive Level Merging & Pruning
Proximity-based merging: If two levels are too close (within a volatility-adjusted threshold), they combine into one stronger zone.
Decay mechanism: Old, untested levels fade away if price no longer respects them.
Why This Approach Works Better Than Traditional Methods
✅ No subjective drawing required – Levels are generated mathematically, removing human bias.
✅ Self-adjusting sensitivity – Works equally well on slow and fast-moving markets.
✅ Focuses on statistically meaningful zones – Avoids false signals from random noise.
✅ Non-repainting & real-time – Levels only update when new data confirms their validity.
How Traders Can Use These Levels
Support/Resistance Trading: Fade bounces off strong levels or trade breakouts with confirmation.
Confluence with Other Indicators: Combine with RSI, MACD, or volume profiles for higher-probability entries.
Stop Placement: Place stops just beyond key levels to avoid premature exits.
Technical Notes (For Advanced Users)
The algorithm avoids overfitting by dynamically adjusting zones sensitivity based on market conditions.
Unlike fixed pivot points, these levels adapt to trends, making them useful in both ranging and trending markets.
The strength percentage helps filter out weak levels—only trade those with a high score for better accuracy.
Note: Script takes some time to load.
Bloomberg Financial Conditions Index (Proxy)The Bloomberg Financial Conditions Index (BFCI): A Proxy Implementation
Financial conditions indices (FCIs) have become essential tools for economists, policymakers, and market participants seeking to quantify and monitor the overall state of financial markets. Among these measures, the Bloomberg Financial Conditions Index (BFCI) has emerged as a particularly influential metric. Originally developed by Bloomberg L.P., the BFCI provides a comprehensive assessment of stress or ease in financial markets by aggregating various market-based indicators into a single, standardized value (Hatzius et al., 2010).
The original Bloomberg Financial Conditions Index synthesizes approximately 50 different financial market variables, including money market indicators, bond market spreads, equity market valuations, and volatility measures. These variables are normalized using a Z-score methodology, weighted according to their relative importance to overall financial conditions, and then aggregated to produce a composite index (Carlson et al., 2014). The resulting measure is centered around zero, with positive values indicating accommodative financial conditions and negative values representing tighter conditions relative to historical norms.
As Angelopoulou et al. (2014) note, financial conditions indices like the BFCI serve as forward-looking indicators that can signal potential economic developments before they manifest in traditional macroeconomic data. Research by Adrian et al. (2019) demonstrates that deteriorating financial conditions, as measured by indices such as the BFCI, often precede economic downturns by several months, making these indices valuable tools for predicting changes in economic activity.
Proxy Implementation Approach
The implementation presented in this Pine Script indicator represents a proxy of the original Bloomberg Financial Conditions Index, attempting to capture its essential features while acknowledging several significant constraints. Most critically, while the original BFCI incorporates approximately 50 financial variables, this proxy version utilizes only six key market components due to data accessibility limitations within the TradingView platform.
These components include:
Equity market performance (using SPY as a proxy for S&P 500)
Bond market yields (using TLT as a proxy for 20+ year Treasury yields)
Credit spreads (using the ratio between LQD and HYG as a proxy for investment-grade to high-yield spreads)
Market volatility (using VIX directly)
Short-term liquidity conditions (using SHY relative to equity prices as a proxy)
Each component is transformed into a Z-score based on log returns, weighted according to approximated importance (with weights derived from literature on financial conditions indices by Brave and Butters, 2011), and aggregated into a composite measure.
Differences from the Original BFCI
The methodology employed in this proxy differs from the original BFCI in several important ways. First, the variable selection is necessarily limited compared to Bloomberg's comprehensive approach. Second, the proxy relies on ETFs and publicly available indices rather than direct market rates and spreads used in the original. Third, the weighting scheme, while informed by academic literature, is simplified compared to Bloomberg's proprietary methodology, which may employ more sophisticated statistical techniques such as principal component analysis (Kliesen et al., 2012).
These differences mean that while the proxy BFCI captures the general direction and magnitude of financial conditions, it may not perfectly replicate the precision or sensitivity of the original index. As Aramonte et al. (2013) suggest, simplified proxies of financial conditions indices typically capture broad movements in financial conditions but may miss nuanced shifts in specific market segments that more comprehensive indices detect.
Practical Applications and Limitations
Despite these limitations, research by Arregui et al. (2018) indicates that even simplified financial conditions indices constructed from a limited set of variables can provide valuable signals about market stress and future economic activity. The proxy BFCI implemented here still offers significant insight into the relative ease or tightness of financial conditions, particularly during periods of market stress when correlations among financial variables tend to increase (Rey, 2015).
In practical applications, users should interpret this proxy BFCI as a directional indicator rather than an exact replication of Bloomberg's proprietary index. When the index moves substantially into negative territory, it suggests deteriorating financial conditions that may precede economic weakness. Conversely, strongly positive readings indicate unusually accommodative financial conditions that might support economic expansion but potentially also signal excessive risk-taking behavior in markets (López-Salido et al., 2017).
The visual implementation employs a color gradient system that enhances interpretation, with blue representing neutral conditions, green indicating accommodative conditions, and red signaling tightening conditions—a design choice informed by research on optimal data visualization in financial contexts (Few, 2009).
References
Adrian, T., Boyarchenko, N. and Giannone, D. (2019) 'Vulnerable Growth', American Economic Review, 109(4), pp. 1263-1289.
Angelopoulou, E., Balfoussia, H. and Gibson, H. (2014) 'Building a financial conditions index for the euro area and selected euro area countries: what does it tell us about the crisis?', Economic Modelling, 38, pp. 392-403.
Aramonte, S., Rosen, S. and Schindler, J. (2013) 'Assessing and Combining Financial Conditions Indexes', Finance and Economics Discussion Series, Federal Reserve Board, Washington, D.C.
Arregui, N., Elekdag, S., Gelos, G., Lafarguette, R. and Seneviratne, D. (2018) 'Can Countries Manage Their Financial Conditions Amid Globalization?', IMF Working Paper No. 18/15.
Brave, S. and Butters, R. (2011) 'Monitoring financial stability: A financial conditions index approach', Economic Perspectives, Federal Reserve Bank of Chicago, 35(1), pp. 22-43.
Carlson, M., Lewis, K. and Nelson, W. (2014) 'Using policy intervention to identify financial stress', International Journal of Finance & Economics, 19(1), pp. 59-72.
Few, S. (2009) Now You See It: Simple Visualization Techniques for Quantitative Analysis. Analytics Press, Oakland, CA.
Hatzius, J., Hooper, P., Mishkin, F., Schoenholtz, K. and Watson, M. (2010) 'Financial Conditions Indexes: A Fresh Look after the Financial Crisis', NBER Working Paper No. 16150.
Kliesen, K., Owyang, M. and Vermann, E. (2012) 'Disentangling Diverse Measures: A Survey of Financial Stress Indexes', Federal Reserve Bank of St. Louis Review, 94(5), pp. 369-397.
López-Salido, D., Stein, J. and Zakrajšek, E. (2017) 'Credit-Market Sentiment and the Business Cycle', The Quarterly Journal of Economics, 132(3), pp. 1373-1426.
Rey, H. (2015) 'Dilemma not Trilemma: The Global Financial Cycle and Monetary Policy Independence', NBER Working Paper No. 21162.

Aggregated Perpetual Futures Open InterestPurpose
Aggregates perpetual futures open interest across Binance, Bybit, and OKX for the base currency of the asset loaded in your tradingview window.
How It Works
Symbol detection: The script grabs syminfo.basecurrency (e.g., “BTC”) from whatever market is on screen.
Ticker mapping: It constructs the three perp-OI feeds that TradingView publishes in the form EXCHANGE:USDT.P_OI
Data request: For each feed it fetches the full OHLC candle (request.security) on the chart’s timeframe. If a venue doesn’t list that perp, the request simply returns na.
Aggregation: The script adds the opens, highs, lows, and closes of all non-na feeds to produce a single aggregated OI candle.
General Notes
The status line shows each venue’s individual OI close.
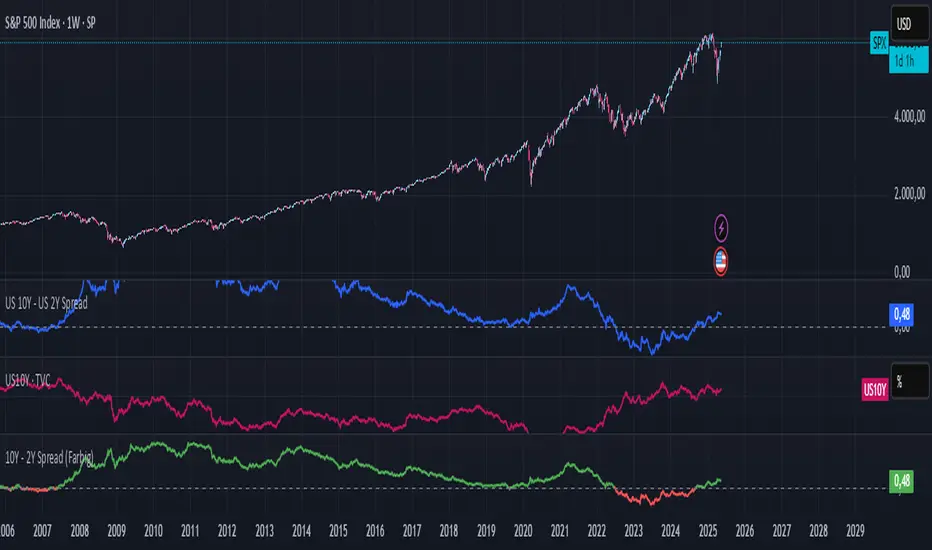
10Y - 2Y Spread (Farbig)10Y – 2Y Yield Spread (Color-Coded)
Description:
This indicator plots the yield spread between the US 10-Year and 2-Year Treasury yields (US10Y – US02Y) as a color-coded line:
Green = normal yield curve (positive spread)
Red = inverted yield curve (negative spread), often seen as a leading recession signal
A horizontal zero line is added to highlight turning points.
This indicator is ideal for tracking macroeconomic yield curve behavior and can be used alongside equity, crypto, or commodity charts.
NeuroFlow Pro IndicatorThe **NeuroFlow Pro Indicator** is a comprehensive technical analysis tool designed for traders on the TradingView platform. It provides actionable buy and sell signals by combining multiple technical indicators, including Moving Averages, MACD, RSI, Stochastic RSI, SuperTrend, Ichimoku Cloud, Bollinger Bands, and Volume analysis. The indicator generates a **Composite Score** (0–100) that reflects market conditions, with low scores indicating bullish opportunities and high scores suggesting bearish conditions. It also identifies key trend reversal points and significant EMA crossovers (Golden Cross and Death Cross) to help traders make informed decisions.
**Key Features**:
- **Composite Score**: Aggregates signals from multiple indicators to provide a single, easy-to-read metric.
- **Buy/Sell Signals**: Generates clear signals for potential long (buy) and short (sell) opportunities.
- **Golden/Death Cross**: Marks EMA 50 crossing above (🚀) or below (💀) EMA 200, indicating major trend shifts.
- **Dashboard**: Displays real-time metrics like trend direction, momentum, volume, and signal confidence.
- **Customizable Alerts**: Notifies users of buy/sell signals, divergences, and EMA crossovers via TradingView’s alert system.
- **Multi-Timeframe Analysis**: Incorporates higher timeframe trends for enhanced signal reliability.
- **Candlestick Patterns**: Optionally includes patterns like Hammer, Engulfing, or Morning Star for signal confirmation.
This indicator is ideal for traders seeking a robust, all-in-one tool to identify trading opportunities across various markets (e.g., crypto, stocks, forex) and timeframes (e.g., 1H, 4H, daily).
User Guide for NeuroFlow Pro Indicator
Understanding the Indicator
- **Dashboard**:
- Located on the chart (left or right, configurable), it shows real-time metrics:
- **Comp Score**: Composite Score (0–100); low (<30) is bullish, high (>70) is bearish.
- **Trend**: Bullish, Bearish, or Neutral
- **MTF Trend**: Trend from a higher timeframe (e.g., 60m or 240m).
- **Momentum**: RSI and Stochastic RSI-based momentum (Bullish, Bearish, Neutral).
- **MFI**: Money Flow Index (Inflow, Outflow, Neutral).
- **Volatility**: High or Low based on ATR and Bollinger Bands.
- **Volume**: High, Low, or Neutral relative to volume MA.
- **Ichimoku**: Bullish, Bearish, or Neutral based on cloud position.
- **ADX Strength**: Strong or Weak trend based on ADX.
- **Divergence**: Bullish, Bearish, or Neutral for RSI/MACD divergences.
- **Reversal**: Bullish or Bearish reversal potential with confidence percentage.
- **Signal Status**: Long (buy), Short (sell), or None.
- **Signal Confid**: Confidence percentage for the current signal.
- **Chart Visuals**:
- **EMA 50 (White)**: Fast-moving average for short-term trends.
- **EMA 200 (Blue)**: Long-moving average for long-term trends.
- **Golden Cross (🚀)**: Green rocket emoji when EMA 50 crosses above EMA 200 (bullish).
- **Death Cross (💀)**: Red skull emoji when EMA 50 crosses below EMA 200 (bearish).
- **Alerts**:
- Configurable for Buy/Sell Signals, Golden/Death Cross, and Bullish/Bearish Divergences.
Configuring Settings
1. **Open Settings**:
- Right-click the indicator’s name on the chart and select “Settings,” or double-click the indicator in the chart’s indicator list.
2. **Key Settings to Customize**:
- **Strategy Settings**:
- **Max ATR Multiplier**: Adjusts sensitivity to volatility (default: 3.0).
- **Main Settings**:
- **Candlestick Pattern**: Choose Hammer, Engulfing, Morning Star, or Custom (default: Hammer).
- **Multi-Timeframe Period**: Set higher timeframe for trend analysis (e.g., 60m, 240m, Daily; default: 60m).
- **Higher Timeframe**: Secondary timeframe for confirmation (default: 240m).
- **Use Candlestick Patterns**: Enable/disable pattern-based signals (default: off).
- **Use Volume Filter**: Require high volume for signals (default: on).
- **Use ADX Filter**: Require strong trend for signals (default: on).
- **Momentum Settings**:
- **RSI/Stochastic/MFI Lengths**: Adjust periods for RSI, Stochastic RSI, and MFI (defaults: 14, 14, 60).
- **EMA Lengths**: Fast (50), Slow (100), Long (200) for trend and crossovers.
- **ATR/ADX Lengths**: Volatility and trend strength periods (default: 14).
- **SuperTrend/Bollinger/Ichimoku Settings**:
- Customize periods and multipliers (defaults: SuperTrend 10/3.0, Bollinger 20/2.0, Ichimoku 9/26/52).
- **MACD Settings**:
- **MACD Preset**: Auto (timeframe-based), 1H (3-10-16), 4H (5-34-21), D (5-15-9), or Custom (default: Auto).
- **Custom MACD Lengths**: Fast (12), Slow (26), Signal (9) for Custom preset.
- **Weights Settings**:
- Adjust weights for trend, momentum, volatility, etc., to prioritize certain indicators (defaults: Trend 1.0, Momentum 0.3, etc.).
- **Threshold Settings**:
- **Bullish/Bearish Reversal Thresholds**: Set score thresholds for reversals (default: 30/70).
- **ADX Threshold**: Minimum ADX for trend strength (default: 20).
- **Signal Thresholds**: Base (70) and alert (80) thresholds for signals.
- **Dashboard Settings**:
- **Position**: Left or Right (default: Right).
- **Show/Hide Metrics**: Enable/disable dashboard rows (e.g., Comp Score, Trend, MFI; all enabled by default except Volatility and Volume MA).
3. **Save Changes**:
- Click “OK” to apply settings. The dashboard and plots update instantly.
Using the Indicator
1. **Interpreting Signals**:
- **Buy Signal (Long)**: Appears when Composite Score is low (≤30), with at least two bullish confirmations . Shown as “Long” in Signal Status with confidence percentage.
- **Sell Signal (Short)**: Appears when Composite Score is high (≥70), with at least two bearish confirmations. Shown as “Short” in Signal Status.
- **Golden Cross (🚀)**: Indicates a bullish trend when EMA 50 crosses above EMA 200. Look for confirmation from Composite Score and Signal Status.
- **Death Cross (💀)**: Indicates a bearish trend when EMA 50 crosses below EMA 200. Confirm with dashboard metrics.
- **Reversal Signals**: Dashboard shows “Bullish” or “Bearish” with a percentage when reversal conditions are met .
2. **Monitoring the Dashboard**:
- Use the dashboard to assess market conditions in real-time.
- Green (bullish), red (bearish), or gray (neutral) colors highlight key metrics.
- Check “Signal Confid” for confidence in buy/sell signals (higher is better, e.g., >60%).
3. **Trading Decisions**:
- Combine signals with your own analysis (e.g., support/resistance, news).
- Use Golden/Death Cross for long-term trend confirmation.
- Avoid trading in high volatility (dashboard: “Volatility: High”) unless experienced
Best Practices
- **Timeframe Selection**:
- Use higher timeframes (e.g., 4H, Daily) for more reliable signals, especially for Golden/Death Cross.
- Lower timeframes (e.g., 5m, 15m) may produce more signals but with higher noise.
- **Confirm Signals**:
- Cross-check buy/sell signals with dashboard metrics (e.g., Trend, MFI, ADX).
- Use Golden/Death Cross as a trend filter rather than a standalone signal.
- **Risk Management**:
- Always use stop-losses and position sizing based on your risk tolerance.
- Avoid trading during high volatility unless part of your strategy.
- **Regular Updates**:
- Monitor TradingView for script updates from the author (KoKalito) to access new features or bug fixes.
Troubleshooting
- **No Signals**:
- Ensure the chart timeframe matches your settings (e.g., 60m for MTF Period).
- Check if filters (Volume, ADX) are too strict; try disabling them.
- **Dashboard Missing**:
- Verify “Dashboard Position” is set to Left or Right.
- Ensure dashboard metrics are enabled (e.g., Show Comp Score).
- **Alerts Not Triggering**:
- Confirm the alert condition is set to “NeuroFlow Pro Indicator” and the correct option (e.g., “Golden Cross Alert”).
- Check TradingView’s “Alerts” panel for errors or expired alerts.
- Reapply the indicator to the chart if it was recently updated.
- **EMA Crosses Not Showing**:
- Zoom in on the chart to see 🚀 (Golden Cross) or 💀 (Death Cross) symbols.
- Ensure EMA 50 and EMA 200 lengths are not identical (defaults: 50, 200).
Support
- **Author**: KoKalito (check TradingView profile for updates or contact info).
- **TradingView Community**: Post questions in the TradingView Pine Script community or forums.
- **Documentation**: Refer to TradingView’s Pine Script v5 documentation for advanced customization.
- **Risk Warning**: Trading involves risk. Use the indicator as a tool, not a guarantee of profits. Always conduct your own analysis and manage risk appropriately.
Happy trading with **NeuroFlow Pro Indicator**! 🚀

FVG Candle HighlighterThis indicator highlights only the true Fair Value Gap (FVG) creator candle — the middle candle in a 3-bar FVG formation — with zero clutter.
🔹 Bullish FVG: Candle is colored if price gaps above the high two bars back
🔹 Bearish FVG: Candle is colored if price gaps below the low two bars back
✨ No boxes. No zones. Just pure, visual price-action accuracy.
🔧 Powered by Pine Script v6
🧠 Based on institutional-style FVG logic
🎯 Ideal for Smart Money / ICT / Order Block strategies

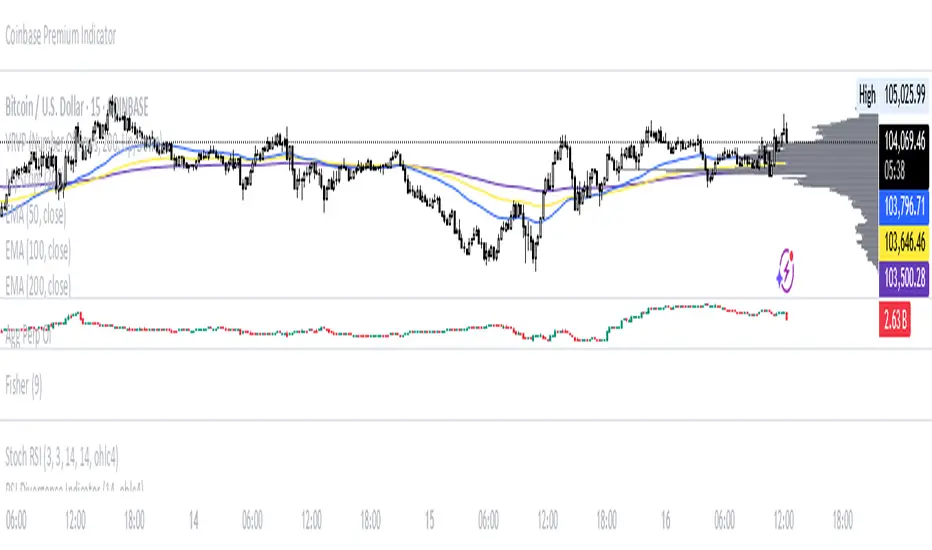
Coinbase Premium IndicatorPurpose
Indicates whether a crypto asset listed on a Coinbase spot market is trading at a premium or discount to other spot (Tether) markets.
How It Works
The script takes the base currency for the pair loaded in that TradingView window and searches for its Coinbase spot market. It also maps the base currency to the USDT (Tether) spot markets on Binance, Bybit, and OKX.
The Premium/ Discount is: (coin-btc-usd) - (sum(bnce-btc-usdt, bybt-btc-usdt, okx-btc-usdt))
General Notes
The status line of the Indicator displays the value of the premium/ discount and the market prices of the pair for each constituent exchange.

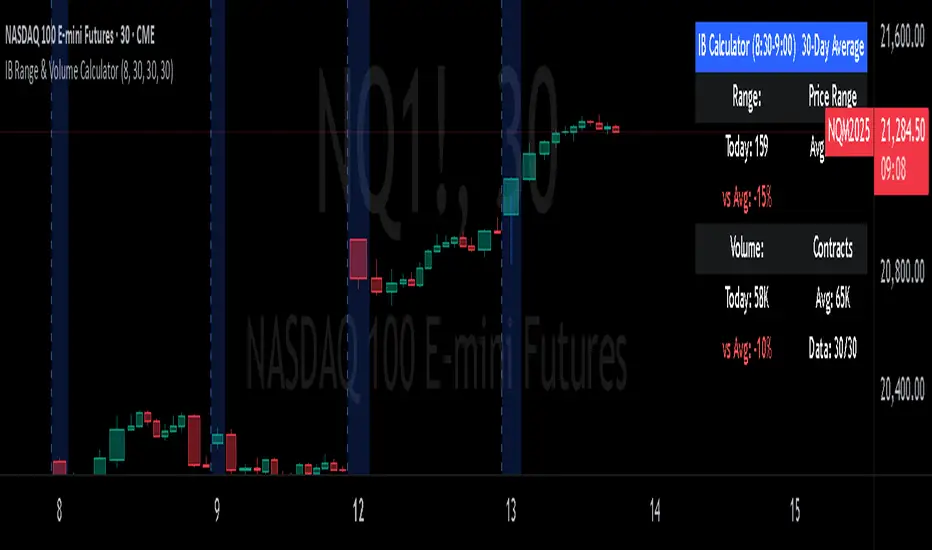
IB Range & Volume CalculatorIB Range & Volume Calculator - Summary
Overview
This indicator tracks and analyzes the Initial Balance (IB) period (first 30 minutes of trading from 8:30-9:00 AM Chicago time) by measuring both price range and trading volume. It compares today's values against a 30-day average, providing essential context for day traders and scalpers.
Key Features
Range Analysis
Automatically calculates high-low range during the Initial Balance period
Compares today's range with the 30-day historical average
Shows percentage difference from average with color coding (green for above average, red for below)
Volume Analysis
Tracks cumulative volume during the Initial Balance period
Calculates and displays 30-day volume average
Compares today's volume to the average with percentage difference
Visual Elements
Highlights all IB period candles with light blue background
Displays a fixed information panel in the upper right corner
Shows real-time status during the IB period ("In progress...")
Updates with final values once the IB period completes
Data Management
Maintains a rolling 30-day history of both range and volume data
Displays data collection progress (x/30 days)
Automatically resets calculations at the beginning of each new session
Trading Applications
This indicator is particularly valuable for:
Context-Based Trading Decisions
Compare today's market behavior to normal conditions
Adjust scalping targets based on relative volatility
Volume-Price Relationship Analysis
Identify unusual volume patterns that may precede significant moves
Validate price movements with corresponding volume confirmation
Trading Strategy Selection
High volume + high range: Momentum strategy opportunities
High volume + low range: Potential breakout setup
Low volume + high range: Possible fade/reversal opportunities
Low volume + low range: Range-bound scalping environment
5-Point Scalp Targeting
Determine if 5-point targets are aggressive or conservative for the day
Adapt stop levels based on relative volatility
Timing Optimization
Identify days with abnormal opening characteristics
Anticipate potential afternoon behavior based on IB patterns
The indicator provides essential context for rapid decision-making in fast-moving markets, helping traders calibrate their expectations and adapt their strategies to current market conditions.
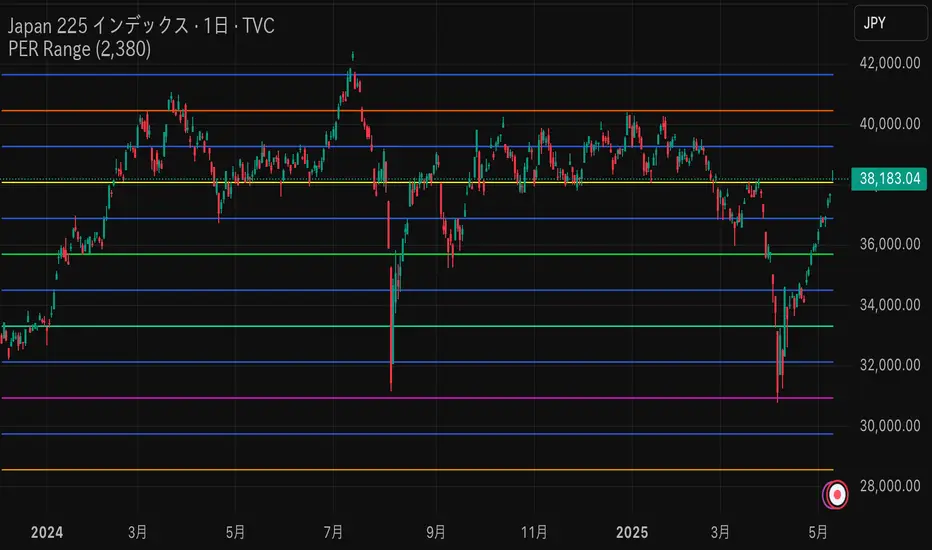
PER x RangeThis Pine Script calculates the target price of the Nikkei Average based on the EPS (Earnings Per Share) and different PER (Price-to-Earnings Ratio) multiples ranging from 17.5x to 12x, in increments of 0.5x. It then plots these target prices on the chart.
Key Features:
Input EPS: You can manually input the current EPS value of the Nikkei Average (the example uses 2380, but you can replace it with the actual EPS).
PER Multiples Calculation: The script calculates target prices for different PER multiples (17.5x, 17x, 16.5x, ..., down to 12x).
Plotting Target Prices: The calculated target prices (EPS * PER) are plotted on the chart as blue lines, showing you different target price scenarios based on varying PER multiples.
VOID Directional Spike MarkerThis indicator highlights significant directional moves on the $VOID chart (NYSE USI:UVOL − DERIBIT:DVOL ) using simple visual cues:
🔼 Green up arrows when the candle closes significantly higher than it opens
🔽 Red down arrows when the candle closes significantly lower than it opens
Threshold is fully customizable (default: 15,000,000)
Ideal for spotting explosive internal shifts on the 5-minute chart during key market moments
Alerts included for both up and down spikes
Use this to track aggressive buying or selling pressure across NYSE internals and time your entries on NQ, ES, or YM with stronger conviction.

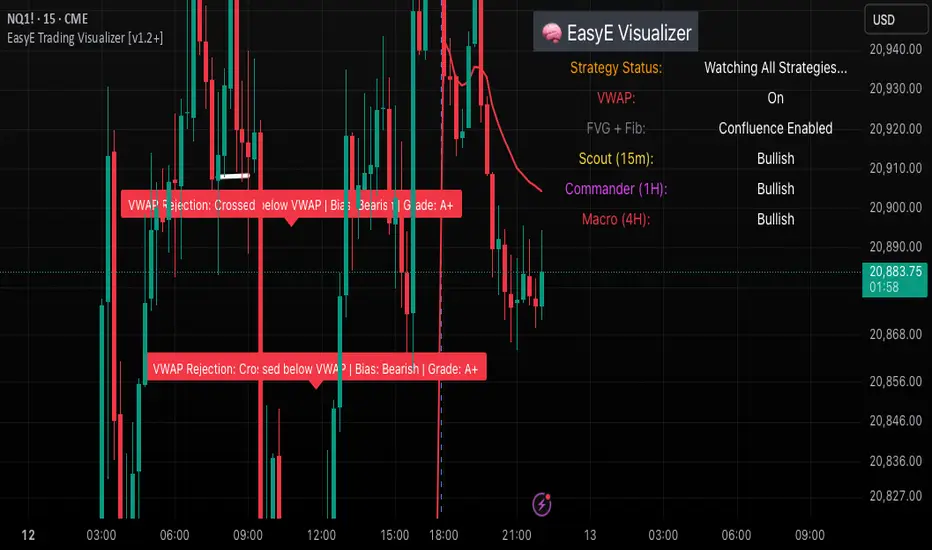
EasyE Trading Visualizer [v1.2+]This indicator is a comprehensive trading assistant designed for scalpers and intraday traders who prioritize structure, liquidity, and real-time narrative detection. It combines multi-confirmation logic into a clean visual system that helps traders anticipate price behavior before major moves.
The system evaluates several strategic concepts, including:
Commander Collapse / Reclaim: Detects structural breaks using higher-timeframe logic to identify failed or confirmed directional momentum.
Trap Rejection: Identifies potential reversal setups based on liquidity grabs followed by engulfing confirmations.
VWAP Reject Reload: Flags potential fade setups against volume-weighted average price, especially during retests.
Liquidity Sweeps: Differentiates between high and low liquidity grabs (sweeps), helping spot traps or continuation patterns.
FVG + Fib Confluence: Integrates smart fib zones (based on large candles) with fair value logic to confirm high-quality zones.
Flip Zones: Detects support/resistance flips and auto-clears broken levels while leaving label trails to track behavior.
Entry signals (Buy/Sell) are accompanied by a dynamic grading system:
Grade A: Strong institutional-quality moves (confluence + structural break).
Grade B: Confluence without full structure shift.
Grade C: Weak setups that lack follow-through or require confirmation.
All logic is toggleable. Users can choose compact display, emoji-only labeling, left/right justification, or predictive label plotting for next-bar anticipation.
The logic does not repaint and is built to help traders read the tape clearly and act with confidence—not just react.
Order Block with BoSHere’s a professional and concise description you can use for publishing your **TradingView script** titled **"Order Block with BoS"**:
---
### 📌 **Description for TradingView Publication:**
**"Order Block with Break of Structure (BoS)"** is a powerful price action-based indicator designed to identify potential reversal zones and momentum shifts using **Order Block** detection combined with **Break of Structure (BoS)** confirmation.
### 🔍 **Key Features:**
* **Order Block Detection**: Highlights bullish and bearish order blocks using precise candle structure logic.
* **Break of Structure (BoS)**: Confirms structural breaks above swing highs or below swing lows to validate potential trend continuation or reversal.
* **Dynamic ATR Filter**: Uses a 14-period ATR with dynamic thresholds to confirm significant moves, filtering out weak breakouts.
* **Visual Aids**:
* Color-coded **boxes** to mark detected Order Blocks.
* **Arrows** at BoS confirmation points when ATR confirms strong momentum.
* Optional **dashed BoS lines** to show where price broke structure.
### ⚙️ **Customizable Inputs**:
* `Swing Length`: Defines the sensitivity of swing high/low detection.
* `Show Break of Structure`: Toggle on/off BoS confirmation lines.
* `Candle Lookback`: Number of historical candles to consider.
This indicator is ideal for traders who incorporate **smart money concepts**, **market structure analysis**, or **institutional order flow** strategies.
---
Would you like me to help write the **strategy** version of this or translate the description into another language for international audiences?

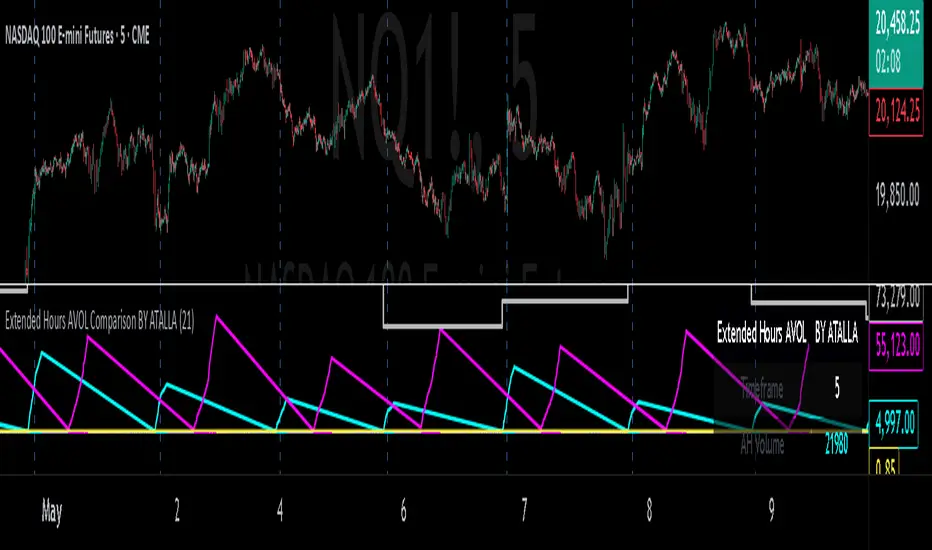
Extended Hours AVOL Comparison BY ATALLAExtended Hours AVOL Comparison BY ATALLA - Indicator Summary
Purpose
This indicator tracks and analyzes trading volume during extended market hours, dividing it into key components and comparing them to the average daily volume to provide insights into off-hours market activity.
Key Components
After Hours Volume (AH)
Tracks accumulated volume after regular market close (16:00-20:00 ET)
Displayed in absolute value and as a percentage of average daily volume
Pre-Market Volume (PM)
Tracks accumulated volume before regular market open (04:00-09:30 ET)
Displayed in absolute value and as a percentage of average daily volume
Total Extended Hours Volume (EH)
Combines AH and PM volumes to show total off-hours trading activity
Provides a consolidated view of extended hours participation
Average Daily Volume (AVOL)
Calculates the average volume over the last 21 days (configurable)
Serves as a benchmark for evaluating the significance of extended hours volumes
Visualization
Information Table
Displays all relevant data in a structured format
Shows absolute volumes and percentages for easy interpretation
Charts
Color-coded lines representing accumulated volumes (AH in cyan, PM in magenta)
Histogram visualizing the current volume percentage relative to AVOL
Practical Applications
Market Event Analysis - Evaluate the impact of news after close or before open
Momentum Assessment - Identify unusual interest in an asset outside regular hours
Opening Preparation - Assess pre-market activity to anticipate potential moves at open
Gap Strategy Development - Understand the volume behind opening or closing gaps
Liquidity Analysis - Determine if there's sufficient volume for order execution in extended hours
Customizable Settings
AVOL Period - Adjust the number of days for average volume calculation
First Volume Treatment - Option to include or exclude the volume from the first after-hours bar
This indicator serves as a valuable tool for traders who operate in or monitor assets during extended hours, providing quantitative context to assess the importance of price movements outside regular trading hours
Economic Event DatesThis TradingView indicator ("Economic Event Dates") plots significant economic event dates directly on your chart, helping you stay informed about potential market-moving announcements. It includes pre-configured dates for:
* **FOMC Meetings:** Key policy meetings of the Federal Open Market Committee.
* **CPI Releases:** Consumer Price Index data releases, a key measure of inflation.
* **Bitcoin Halvings:** Programmatic reductions in Bitcoin's new supply issuance.
**Features:**
* **Customizable Dates:** Easily input and manage dates for FOMC, CPI, and Halving events for current and future years (2025, 2026, and beyond for Halvings).
* **Visual Cues:** Displays vertical lines on the chart at the precise time of each event.
* **Event Labels:** Shows clear labels (e.g., "FOMC", "CPI", "Halving") for each event line.
* **Color Coding:** Distinct colors for FOMC (blue), CPI (orange), and Halving (purple) events for quick identification.
* **Future Events Focus:** Option to display only upcoming events relative to the current real time.
* **Morning Alerts:** (Optional) Triggers an alert on the morning of a scheduled event, providing a timely reminder.
* **Customizable Appearance:** Adjust line width and toggle label visibility.
**How to Use:**
1. Add the indicator to your TradingView chart.
2. Review and update the input dates for FOMC, CPI, and Halving events in the indicator settings. The script includes placeholders and notes for future dates that may require verification from official sources (e.g., federalreserve.gov, bls.gov).
3. Customize colors, line width, label visibility, and alert preferences as needed.
4. Observe the vertical lines on your chart indicating upcoming economic events.
This tool is designed for traders and investors who want to incorporate awareness of major economic events into their market analysis. Remember to verify future event dates as they are officially announced.
Created by YouNesta
QoQ PAT, Sales & OPM% Labels by GauravThis indicator automatically displays the Quarter-over-Quarter (QoQ) percentage change in Sales, PAT (Profit After Tax), and Operating Profit Margin (OPM%) directly on the price chart.
It fetches quarterly financial data using TradingView’s request.financial() function for:
Sales (TOTAL_REVENUE),
PAT (NET_INCOME),
Operating Profit (OPER_INCOME).
For each earnings update, it calculates:
Sales QoQ %: Growth in sales vs. the previous quarter,
PAT QoQ %: Growth in PAT vs. the previous quarter,
OPM %: Operating Profit Margin = (Operating Profit / Sales) × 100.
This helps traders and investors quickly visualize fundamental growth trends right alongside the candlestick chart, improving fundamental + technical analysis integration.

FX Currency Strength DashboardFX Currency Strength Dashboard (1H, 2H, 8H, 5D, 30D)
The FX Currency Strength Dashboard is a multi-timeframe performance analyzer for the 8 major currencies:
EUR, USD, GBP, JPY, AUD, NZD, CAD, CHF.
It displays the relative strength or weakness of each currency over five timeframes:
1 Hour
2 Hours
8 Hours
5 Days
30 Days
🧮 How It Works
Performance Measurement:
For each currency, the indicator calculates the average rate of change (ROC) across 7 currency pairs that represent that currency (e.g. EURUSD, EURJPY, EURCHF, etc.).
Directional Adjustment:
For quote-side currencies (e.g. USD in EURUSD), the ROC is inverted (i.e., negative) to correctly reflect the base currency's strength.
Averaging:
The 7 ROC values per currency are averaged to produce a clean, comparable strength score for that currency in each timeframe.
Table Display:
A real-time table shows strength scores for all 8 currencies.
The strongest currency per timeframe is highlighted in green.
The weakest currency is highlighted in red.
Neutral or middle values appear in gray.
Updates:
The dashboard refreshes every 5 bars on the 1H chart to reduce load and improve performance.

Long Short dom📊 Long Short dom (VI+) — Custom Vortex Trend Strength Indicator
This indicator is a refined version of the Vortex Indicator (VI) designed to help traders identify trend direction, momentum dominance, and potential long/short opportunities based on VI+ and VI– dynamics.
🔍 What It Shows:
• VI+ (Green Line): Measures upward trend strength.
• VI– (Red Line): Measures downward trend strength.
• Histogram (optional): Displays the difference between VI+ and VI–, helping visualize which side is dominant.
• Background Coloring: Highlights bullish or bearish dominance zones.
• Zero Line: A visual baseline to enhance clarity.
• Highest/Lowest Active Lines: Real-time markers for the strongest directional signals.
⸻
🛠️ Inputs:
• Length: Vortex calculation period (default 14).
• Show Histogram: Enable/disable VI+–VI– difference bars.
• Show Trend Background: Toggle colored zones showing trend dominance.
• Show Below Zero: Decide whether to display values that fall below 0 (for advanced use).
⸻
📈 Strategy Insights:
• When VI+ crosses above VI–, it indicates potential long momentum.
• When VI+ crosses below VI–, it signals possible short pressure.
• The delta histogram (VI+ – VI–) helps you quickly see shifts in momentum strength.
• The background shading provides an intuitive visual cue to assess trend dominance at a glance.
⸻
🚨 Built-in Alerts:
• Bullish Cross: VI+ crosses above VI– → possible entry long.
• Bearish Cross: VI+ crosses below VI– → possible entry short.
⸻
✅ Ideal For:
• Trend-following strategies
• Identifying long/short bias
• Confirming entries/exits with momentum analysis
⸻
This tool gives you clean, real-time visual insight into trend strength and shift dynamics, empowering smarter trade decisions with clarity and confidence.