Forecasting

MoneyMakers Scalping Signals1-5 min frame, a versatile market indicator designed to highlight emerging trends and structural shifts in crypto price action before they fully develop. By combining price dynamics, momentum behavior and market context into a clean visual output, it helps traders make more informed decisions without noise or lag. Suitable for both short- and mid-term analysis, the indicator offers a clearer view of potential reversal zones, trend continuations and key market cycles.

Smart Trader,Episode 1, by Ata Sabanci | Unified Matrix⚠️ **CRITICAL: READ BEFORE USING** ⚠️
This strategy is **100% VOLUME-BASED** and requires **Lower Timeframe (LTF) intrabar data** for accurate calculations. Please understand the following limitations before using:
**📊 DATA ACCURACY LEVELS:**
• **1T (Tick)** — Most accurate, real volume distribution per tick
• **1S (1 Second)** — Reasonably accurate approximation
• **15S (15 Seconds)** — Good approximation, longer historical data available
• **1M (1 Minute)** — Rough approximation, maximum historical data range
**⚠️ BACKTEST & REPLAY LIMITATIONS:**
• TradingView's Strategy Tester uses historical LTF data which may be limited depending on your subscription plan
• Replay mode results may differ from live trading due to data availability
• For longer backtest periods, use higher LTF settings (15S or 1M)
• Not all symbols/exchanges support tick-level data
• Crypto and Forex typically have better LTF data availability than stocks
**💡 A NOTE ON TOOLS:**
Successful trading requires proper tools. Higher TradingView plans provide access to more historical intrabar data, which directly impacts the accuracy of volume-based calculations. More precise volume data leads to more reliable signals. Consider this when evaluating your trading infrastructure.
**WHY "EPISODE 1"?**
This strategy is titled "Episode 1" because it focuses exclusively on **Highest Buyers (HB)** — a single but powerful concept in volume analysis.
**The Philosophy:**
A single high-volume buying event can tell us a story about market psychology:
• Where did the biggest buyers enter?
• How much of their power remains?
• Are sellers consuming their advantage?
• At what rate is the balance shifting?
By focusing on just ONE aspect of volume analysis, traders can deeply understand how a buying surge affects future price action before moving to more complex multi-factor analysis.
**The Reality:**
This script alone is approximately **2000 lines of code** — and it only analyzes buyers. A comprehensive system covering all aspects (sellers, combined analysis, multi-timeframe correlation) would be significantly larger and computationally heavier. Breaking this into focused modules allows for:
• Deeper understanding of each component
• Lighter, more responsive scripts
• Educational progression from simple to complex
**OVERVIEW**
Smart Trader EP1 is a volume-based trading strategy that tracks the balance of power between buyers and sellers through the lens of the **Highest Buyers event**. Unlike traditional indicators that rely on price patterns or mathematical formulas, this strategy analyzes *actual volume flow* to identify who is in control of the market.
The core philosophy is simple: **markets move when one side (buyers or sellers) exhausts their power while the opposing side accumulates strength.** By measuring this power shift in real-time, the strategy identifies high-probability entry and exit points.
**HOW IT WORKS**
**1. Volume Engine**
The strategy splits each candle's volume into buying volume and selling volume using intrabar data. In *Intrabar (Precise)* mode, it uses actual tick-by-tick or second-by-second data to calculate the exact buy/sell distribution. In *Geometry* mode, it approximates based on candle structure (close position within the range).
**2. Event Detection**
Within the lookback window, the strategy identifies key events:
• **HB (Highest Buyers)** — The candle with maximum buying volume (potential resistance when exhausted)
• **HS (Highest Sellers)** — The candle with maximum selling volume (potential support when exhausted)
• **LB (Lowest Buyers)** — The candle with minimum buying volume (buyer absence)
• **LS (Lowest Sellers)** — The candle with minimum selling volume (seller absence)
These events create dynamic support and resistance levels based on actual volume, not arbitrary price levels.
**3. Power Tracking (Attrition Model)**
For the Highest Buyers event (HB), the strategy tracks:
• **Start Power (X)** — The initial buying volume at the HB event
• **Consumed Power (Y)** — How much selling volume has accumulated since the event
• **Remaining Power (Z)** — Start Power minus Consumed Power (X - Y)
• **Opponent Dominance** — When Remaining Power goes negative (Z < 0), sellers have overtaken buyers
Think of it like a battle: buyers establish a position (HB), and sellers gradually consume their power. When buyers' power is exhausted (Remaining Power ≤ 0), sellers have taken control.
**4. Depletion Markers**
Visual markers appear on the chart when power reaches critical thresholds:
• **🔋** — Buyers consumed 100% (Remaining = 0)
• **🚨** — Buyers consumed 200% (Opponent Dominance = 100%)
• **🪫** — Sellers consumed 100%
• **⚠️** — Sellers consumed 200%
**5. Cumulative Delta**
Beyond tracking power at specific events, the strategy calculates the cumulative buy volume minus sell volume since the HB event. This shows the *net flow* of money:
• **Positive Delta** — More buying than selling since HB (bullish pressure)
• **Negative Delta** — More selling than buying since HB (bearish pressure)
**6. Trend Channel**
A 5-point linear regression channel identifies the current trend:
• **UPTREND** — Both upper and lower channel lines slope upward
• **DOWNTREND** — Both lines slope downward
• **RANGING** — Mixed or flat slopes
The strategy also tracks where the HB event occurred within this channel (TOP, UPPER, MIDDLE, LOWER, BOTTOM) to contextualize the signal.
**7. Nearest Event Analysis**
The strategy identifies which event is closest to the current candle and analyzes the price action *after* that event:
• How many bullish vs bearish candles followed?
• Does post-event momentum confirm or contradict the event type?
This prevents false signals when, for example, a bearish event occurs but is immediately followed by strong bullish candles.
**SIGNAL LOGIC**
**🟢 LONG Signal Conditions:**
• Uptrend with positive cumulative delta and buyers accumulating
• At channel bottom/lower with strong buyer power remaining
• After a bearish event (HS) with bullish post-event momentum (reversal signal)
• Ranging market with positive delta and strong power
**🔴 SHORT Signal Conditions:**
• Downtrend with negative cumulative delta and sellers in control
• Opponent Dominance (buyer power exhausted) with bearish momentum
• Buyer Trap: HB at TOP in uptrend but power exhausted and delta negative
• After a bullish event (HB) with bearish post-event momentum (trap signal)
**⏳ NO_TRADE Conditions:**
• Conflicting signals (e.g., bearish event but bullish post-momentum)
• Ranging market without clear direction
• Mixed power readings
• Price position contradicts signal direction
**STRATEGY EXECUTION**
**Entry Rules:**
• Enter LONG when signal is "LONG" and conditions are valid
• Enter SHORT when signal is "SHORT" and conditions are valid
• **Pyramid**: Up to 2 entries allowed in the same direction (configurable)
• Each entry uses 10% of equity by default
• Only one entry per confirmed candle (prevents multiple fills)
**Stop Loss (Event Line Based):**
• **LONG positions**: Stop Loss placed below the HS line (seller support level)
• **SHORT positions**: Stop Loss placed above the HB line (buyer resistance level)
• A small buffer percentage is added to prevent premature stops
**Take Profit (Event Line Based):**
• **LONG positions**: Take Profit near the HB line (buyer resistance target)
• **SHORT positions**: Take Profit near the HS line (seller support target)
• A small buffer percentage ensures realistic fill expectations
**Exit Rules:**
• Exit LONG when signal changes to SHORT
• Exit SHORT when signal changes to LONG
• **NO_TRADE signal = HOLD** (do not exit, wait for clear direction)
• SL/TP orders remain active regardless of signal changes
**SETTINGS GUIDE**
**⚙️ General Settings:**
• *Calculation Method* — Choose between Intrabar (Precise) or Geometry (approximation)
• *Intrabar Resolution* — LTF for volume data (1T, 1S, 15S, 1M)
• *Lookback Length* — Window for scanning events (10-150 bars)
• *Timezone Offset* — Adjust clock display to your local time
**📊 Matrix Display Settings:**
• *Show Unified Matrix* — Toggle the information dashboard
• *Show Event Lines* — Toggle horizontal lines at event prices
• *Panel Size/Position* — Customize dashboard appearance
• *Projection Bars* — Extend event lines into the future
• *Depletion Threshold* — Percentage for depletion markers (default: 100%)
**🏷️ Rank Labels Settings:**
• *Show Rank Labels (HB/HS)* — Display labels on highest volume candles
• *Show Low Labels (LB/LS)* — Display labels on lowest volume candles
• *Ranks Count* — Number of rankings to display (1-5)
**📐 Trend Channel Settings:**
• *Show Trend Channel* — Toggle the 5-point regression channel
• *Line Color/Fill/Width/Style* — Customize channel appearance
**🎯 Trade Signal Settings:**
• *Long: Min Remaining Power %* — Minimum buyer power for LONG signal (default: 50%)
• *Short: Max Remaining Power %* — Maximum power for SHORT signal (default: 30%)
• *Opponent Dominance Threshold* — When to consider power "exhausted" (default: 0%)
• *Max Decay Angle* — Maximum consumption rate for valid entries (default: 60°)
**📈 Strategy Execution Settings:**
• *Enable Strategy* — Turn automatic trading on/off
• *Allow LONG/SHORT* — Enable or disable specific directions
• *Max Pyramid Entries* — Maximum entries in same direction (1-3)
• *SL Buffer %* — Distance below/above event line for stop loss (default: 0.15%)
• *TP Buffer %* — Distance from event line for take profit (default: 0.05%)
**VISUAL ELEMENTS**
**Chart Labels:**
• **#1 HB** — Highest Buyers (rank label on candle high)
• **#1 HS** — Highest Sellers (rank label on candle low)
• **#1 LB** — Lowest Buyers (rank label on candle high)
• **#1 LS** — Lowest Sellers (rank label on candle low)
• **🔋 / 🚨** — Buyer power depletion markers
• **🪫 / ⚠️** — Seller power depletion markers
**Event Lines:**
• **Blue horizontal lines** — HB price levels (buyer entry points)
• **Red horizontal lines** — HS price levels (seller entry points)
• **Cyan lines** — LB price levels
• **Orange lines** — LS price levels
• **Dashed extensions** — Projected levels into future bars
**Trend Channel:**
• **Orange lines** — Upper and lower channel boundaries (5-point regression)
• **Orange fill** — Channel area (90% transparency)
**Matrix Dashboard (6 rows):**
• Row 1: Header with symbol, LTF setting, and local clock
• Row 2: Volume snapshot (Total, Buy, Sell, Delta)
• Row 3: Column headers
• Row 4: Highest Buyers data (Age, Start Power, Consumed, Remaining, Decay, ETA)
• Row 5: Highest Sellers data
• Row 6: Signal Evaluation (Trend, Zone, Nearest Event, Signal, Reason)
**Strategy Markers:**
• **Green triangle up** — LONG entry
• **Red triangle down** — SHORT entry
• **Faded triangles** — Pyramid entries
• **Colored lines** — SL (red) and TP (green) levels when in position
**BEST PRACTICES**
**For Maximum Accuracy:**
1. Use **1T (tick)** or **1S** intrabar resolution when available
2. Trade liquid markets with good volume data (crypto majors, forex majors, high-volume stocks)
3. Use smaller lookback length (20-30) to ensure all bars have valid LTF data
4. Monitor the "Intrabar Valid Bars" counter in the matrix header
5. If you see data warnings, reduce lookback or increase LTF resolution
**For Longer Backtests:**
1. Use **15S or 1M** intrabar resolution for more historical data
2. Increase lookback length if needed
3. Understand that accuracy decreases with higher LTF settings
4. Consider using Geometry mode for very long backtests (approximation but always available)
**Understanding the Signals:**
• Pay attention to the signal *reasoning* shown in the matrix — it explains WHY
• **NO_TRADE** means the system sees conflicting factors — respect this caution
• Event lines act as dynamic S/R — they update as new volume events occur
• Cumulative Delta (Δ) often provides early warning of trend changes
**Risk Management:**
• The default 10% per entry with max 2 pyramids = 20% maximum exposure
• Event-line-based SL/TP provides logical levels based on actual volume events
• Always verify signals with your own analysis before trading
**INTERPRETING THE MATRIX**
**Power Status Examples:**
• *Remaining Power: 75%* — Buyers still have most of their strength
• *Remaining Power: 25%* — Buyers nearly exhausted, watch for reversal
• *Opponent Dominance: -50%* — Sellers have consumed 150% of buyer power (strong bearish)
**Decay Angle:**
• *Low angle (0-30°)* — Slow consumption, power lasting longer
• *High angle (60-90°)* — Rapid consumption, expect quick exhaustion
**ETA to Parity:**
• Shows estimated bars until Remaining Power reaches zero
• *"Overtaken"* with 🚨 means sellers have already dominated
**LIMITATIONS & DISCLAIMER**
**Technical Limitations:**
• Requires sufficient historical LTF data (varies by TradingView plan and symbol)
• Intrabar (Precise) mode may show invalid data warnings on symbols with limited history
• Strategy tester may not have access to the same LTF data as live trading
• Maximum 500 lines and 500 labels (TradingView platform limits)
**Important Notes:**
• This strategy focuses on **Highest Buyers only** — it does not analyze all market factors
• Past performance does not guarantee future results
• Volume data quality varies significantly between symbols and exchanges
• The strategy's signals are analytical tools, not trading recommendations
**Risk Disclaimer:**
This strategy is provided for **educational and informational purposes only**. Trading involves substantial risk of loss and is not suitable for all investors.
• Always use proper risk management
• Never risk more than you can afford to lose
• Backtest results may differ significantly from live trading
• You are solely responsible for your trading decisions
**TECHNICAL SPECIFICATIONS**
• Pine Script Version: 6
• Calculation: calc_on_every_tick=true, use_bar_magnifier=true
• Default Capital: 10,000
• Default Position Size: 10% of equity
• Maximum Lines: 500
• Maximum Labels: 500
• External Library: TradingView/ta/10 (for requestUpAndDownVolume)
*Smart Trader EP1 — Understanding Volume, One Event at a Time*

ETH Vol Breakout - NO ERROR VERSIONThis strategy examines the impact of Eth.d Vol on Ethereum price. Looking at ETHDVOL -60 (Support) and 78 (Resistance)—tell a very specific story - analyzing a High Volatility Regime.
The support level around 60 and resistance 78, tend to only occurs during Bull Runs or Market Crashes.
In the "Quiet Years", ETHDVOL rarely touched 60, let alone 78.
Trying to develop a strategy that is perfectly tuned for a Bull Market or a Crisis,
1. The "60 Floor" (Support)
Context: In a high-volatility regime, when ETHDVOL drops to 60, it indicates the market has "cooled off" just enough to reload leverage.
Historical Behavior (2021-2022 Context):
July 2021: After the May crash, ETHDVOL compressed down and found support at ~65.
Result: This marked the local bottom before the massive run-up to the November All-Time Highs ($4,800).
Outcome: Strong Buy Signal (Trend Continuation).
January 2022: ETHDVOL dropped to ~58-60 while price was hovering around $3,000.
Result: The floor broke, volatility spiked to 80+, and price crashed to $2,200.
Outcome: Trap / Warning Signal.
The Pattern: When Volatility hits 60 (Support), price is usually Coiling.
If Price is trending UP: This is a "dip buy" opportunity. The coil resolves upwards.
If Price is trending DOWN: This is the "calm before the flush." The coil resolves downwards.
2. The "78 Ceiling" (Resistance)
Context: 78 is an extreme reading. It represents panic (bottom) or euphoria (blow-off top).
Historical Behavior:
May 2021 (The Crash): ETHDVOL smashed through 78, peaking at 100+.
Price Action: Price collapsed from $4,000 to $1,700.
Signal: If Vol > 78, you are in a capitulation event. Buying spot here is usually profitable within 3-6 months (buying the blood).
November 2022 (FTX Collapse): ETHDVOL spiked to ~75-80.
Price Action: ETH hit $1,100 (Cycle Lows).
Signal: Hitting 78 marked the Absolute Bottom.
November 2021 (The Top): Interestingly, at the $4,800 price peak, Volatility was NOT at 78. It was lower (~60-70).
Insight: Bull market tops often happen on lower volatility than bear market bottoms.

TAN Omni-Dash v50: Dividend Payout for Jan 2026 TradableJust a simple Momentum swing algo. It's mainly for keeping an eye out for Jan 2026 ex-divedent payouts list. This code contains top 100 most profitable payouts.

Liquidity Retest Strategy (Apicode) - TP/SL Lines FixedTechnical Documentation:
1. Purpose and underlying concept
This strategy targets a common behavior in liquid markets: liquidity sweeps around meaningful support/resistance levels, followed by a retest and rejection (reversal) with confirmation.
The core thesis is that many initial “breaks” are not continuation moves, but rather stop-runs and order harvesting. After the sweep, price reclaims the level and closes back on the opposite side, offering a structured entry with defined risk.
The strategy includes:
Support/Resistance detection via pivots
Dynamic selection of the “working” level using an ATR-based proximity window
Rejection validation via candle structure (wick + close)
Optional filters: volume, VWAP-like bias, and EMA trend
Risk management with static TP/SL (ATR-based or %), plus trailing stop (ATR-based or %), with per-trade lines plotted
2. Main components
2.1. Volatility metric: ATR
atr = ta.atr(atrLength) is used in two essential places:
Level selection (proximity to S/R): prevents trading levels that are too far from current price.
Sweep validation (minimum wick size): requires the wick to extend beyond the level by a volatility-relative amount.
Optionally, ATR can also be used for:
Static TP/SL (when usePercent = false)
Trailing stop (when useTrailPercent = false)
2.2. Building S/R levels with pivots
Pivots are detected using:
pivotHigh = ta.pivothigh(pivotLookback, rightBars)
pivotLow = ta.pivotlow(pivotLookback, rightBars)
Each confirmed pivot is stored in arrays:
resistanceLevels for resistance
supportLevels for support
The array size is capped by maxLevels, which reduces noise and manages chart resource usage (lines).
2.3. Selecting the “best” level each bar
On each bar, a single support S and/or resistance R candidate is chosen:
Support: nearest level below price (L < price)
Resistance: nearest level above price (L > price)
Only levels within atr * maxDistATR are considered
This produces dynamic “working levels” that adapt to price location and volatility.
2.4. Rejection pattern (retest + sweep)
After selecting the working level:
Support rejection (long setup)
Conditions:
Low touches/crosses support: low <= S
Close reclaims above: close > S
Bullish candle: close > open
Sufficient wick below the level (liquidity sweep): (S - low) >= atr * minWickATR
This aims to capture a stop sweep below support followed by immediate recovery.
Resistance rejection (short setup)
Symmetric conditions:
High touches/crosses resistance: high >= R
Close rejects back below: close < R
Bearish candle: close < open
Sufficient wick above the level: (high - R) >= atr * minWickATR
2.5. Optional filters
Final signals are the rejection pattern AND enabled filters:
1.- Volume filter
High volume is defined as: volume > SMA(volume, 20) * volMult
When useVolFilter = true, setups require relatively elevated participation
2.- VWAP-like bias filter
A VWAP-like series is computed over vwapLength (typical price weighted by volume)
When useVWAPFilter = true:
- Longs only if close > vwap
- Shorts only if close < vwap
3.- EMA trend filter
Uptrend if EMA(fast) > EMA(slow)
When useTrendFilter = true:
- Longs only in uptrend
- Shorts only in downtrend
2.6. Backtest time window (time filter)
To keep testing focused and reduce long-history noise:
useMaxLookbackDays enables the filter
maxLookbackDays defines how many days back from timenow entries are allowed
Entries are permitted only when time >= startTime.
3. Entry rules and position control
3.1. Entries
strategy.entry('Long', strategy.long) when longSetup and no long position is open
strategy.entry('Short', strategy.short) when shortSetup and no short position is open
No pyramiding is allowed (pyramiding = 0). Position gating is handled by:
Long allowed if strategy.position_size <= 0
Short allowed if strategy.position_size >= 0
4. Risk management: TP/SL and trailing (with plotted lines)
4.1. Detecting entry/exit events
Events are identified via changes in strategy.position_size:
LongEntry: transition into a long
shortEntry: transition into a short
flatExit: transition back to flat
This drives per-trade line creation, updates, and cleanup of state variables.
4.2. Static TP/SL
On entry, entryPrice := strategy.position_avg_price is stored.
Percent mode (usePercent = true)
Long:
staticSL = entryPrice*(1 - slPerc/100)
staticTP = entryPrice*(1 + tpPerc/100)
Short:
staticSL = entryPrice*(1 + slPerc/100)
staticTP = entryPrice*(1 - tpPerc/100)
ATR mode (usePercent = false)
Long:
staticSL = entryPrice - atrAtEntry*slATR
staticTP = entryPrice + atrAtEntry*tpATR
Short:
staticSL = entryPrice + atrAtEntry*slATR
staticTP = entryPrice - atrAtEntry*tpATR
4.3. Trailing stop (custom)
While a position is open, the script tracks the most favorable excursion:
Long: hhSinceEntry = highest high since entry
Short: llSinceEntry = lowest low since entry
A trailing candidate is computed:
Percent trailing (useTrailPercent = true)
Long: trailCandidate = hhSinceEntry*(1 - trailPerc/100)
Short: trailCandidate = llSinceEntry*(1 + trailPerc/100)
ATR trailing (useTrailPercent = false)
Long: trailCandidate = hhSinceEntry - atr*trailATR
Short: trailCandidate = llSinceEntry + atr*trailATR
Then the effective stop is selected:
Long: slUsed = max(staticSL, trailCandidate) when useTrail is enabled
Short: slUsed = min(staticSL, trailCandidate) when useTrail is enabled
If useTrail is disabled, slUsed remains the static stop.
Take profit remains static:
tpUsed = staticTP
Exit orders are issued via:
strategy.exit(..., stop=slUsed, limit=tpUsed)
4.4. Per-trade TP/SL lines
On each entry, two lines are created (SL and TP) via f_createLines().
During the trade, the SL line updates when trailing moves the stop; TP remains fixed.
On exit (flatExit), both lines are finalized on the exit bar and left on the chart as historical references.
This makes it straightforward to visually audit each trade: entry context, intended TP, and trailing evolution until exit.
5. Visualization and debugging
BUY/SELL labels with configurable size (xsize)
Debug mode (showDebug) plots the chosen working support/resistance level each bar
Stored pivot levels are drawn using reusable line slots, projected a fixed 20 bars to the right to keep the chart readable and efficient
6. Parameter guidance and practical notes
pivotLookback / rightBars: controls pivot significance vs responsiveness. Lower rightBars confirms pivots earlier but can increase noise.
maxDistATR: too low may reject valid levels; too high may select distant, less relevant levels.
minWickATR: key quality gate for “real” sweeps. Higher values reduce frequency but often improve signal quality.
Filters:
Volume filter tends to help in ranges and active sessions.
VWAP bias is useful intraday to align trades with session positioning.
EMA trend filter is helpful in directional markets but may remove good mean-reversion setups.
Percent TP/SL: provides consistent behavior across assets with variable volatility, but is less adaptive to sudden regime shifts.
Percent trailing: can capture extensions well; calibrate trailPerc per asset/timeframe (too tight = premature exits).
7. Known limitations
Pivot-derived levels are a heuristic; in strong trends, valid retests may be limited.
The time filter uses timenow; behavior may vary depending on historical context and how the platform evaluates “current time.”
TP/SL and trailing are computed from bar OHLC; in live trading, intrabar sequencing and fills may differ from bar-close simulation.

EMA 1 & SALMA Intersection StrategyTrading Strategy: EMA 1 & SALMA Crossover System
This strategy is a Trend-Following system that focuses on the direct interaction between the price (represented by EMA 1) and a smoothed trendline (SALMA). Instead of relying on the color changes of the indicator, it uses mechanical crossover signals to enter and exit trades.
1. Indicators Used
EMA 1 (Exponential Moving Average): Since the period is 1, it effectively represents the Current Price. It reacts instantly to every market move.
SALMA v3.0 (Smoothed Adaptive Lattice Moving Average): A double-smoothed moving average that acts as the "Base Line" or "Trend Support/Resistance."
RSI (Relative Strength Index): Used as a Momentum Filter to ensure we don't trade against the market's strength.
2. Buy (Long) Entry Rules
You enter a Long position when the following conditions are met:
The Crossover: The EMA 1 (Price) crosses ABOVE the SALMA line. This indicates that the short-term momentum is shifting higher than the average trend.
The Filter (RSI): The RSI must be above 50. This confirms that the buyers are in control and the upward move has enough strength.
3. Sell (Short) Entry Rules
You enter a Short position when the following conditions are met:
The Crossunder: The EMA 1 (Price) crosses BELOW the SALMA line. This indicates a breakdown in price action.
The Filter (RSI): The RSI must be below 50. This confirms that the sellers are dominating and the downward momentum is real.
4. Key Advantages of This System
Objectivity: You don't guess based on the color of the line; you wait for a clear physical break (cross) of the line.
Precision: By using EMA 1, you get the earliest possible entry signal compared to slower moving averages.
False Signal Protection: The RSI 50 filter prevents you from entering "weak" trades where the price crosses the line but lacks the volume or momentum to continue.


sullaojo 3mHere is the English translation for the alert setup instructions:
**How to Set Up Alerts (After Adding the Code)**
1. Click the **Add to chart** button to apply the indicator to your graph.
2. Click the **Alarm Clock icon (Alerts)** on the top right toolbar of TradingView, or press `Alt + A`.
3. In the **Condition** field:
* Select the indicator named **"MA Crossover Buy Alert..."**
* Select **"แจ้งเตือนซื้อ (Buy Alert)"** to receive only buy signals.
4. In the **Trigger** (or Options) section: Select **Once per bar close**.
*(This is recommended per the textbook to confirm that the closing price actually crossed the line, avoiding false signals during intraday volatility.)*
5. Check **Notify on App** (for mobile) or **Show pop-up** as desired, then click **Create**.
Now, when the moving averages cross according to the textbook's conditions, the system will send you an alert immediately!

ARVEXV1“Failed Reversal – Opposite Candle Only (No Doji/Hammer/Hanging Man)”:
This strategy captures failed reversal attempts where the current candle is opposite to the previous candle and volume is higher. It enters long if a bearish candle fails to break a previous bullish candle’s low, and short if a bullish candle fails to break a previous bearish candle’s high. Signals are canceled for Doji, Hammer, or Hanging Man candles. Entries only, fully backtestable.

12M Return Strategy This strategy is based on the original Dual Momentum concept presented by Gary Antonacci in his book “Dual Momentum Investing.”
It implements the absolute momentum portion of the framework using a 12-month rate of change, combined with a moving-average filter for trend confirmation.
The script automatically adapts the lookback period depending on chart timeframe, ensuring the return calculation always represents approximately one year, whether you are on daily, weekly, or monthly charts.
How the Strategy Works
1. 12-Month Return Calculation
The core signal is the 12-month price return, computed as:
(Current Price ÷ Price from ~1 year ago) − 1
This return:
Plots as a histogram
Turns green when positive
Turns red when negative
The lookback adjusts automatically:
1D chart → 252 bars
1W chart → 52 bars
1M chart → 12 bars
Other timeframes → estimated to approximate 1 calendar year
2. Trend Filter (Moving Average of Return)
To smooth volatility and avoid noise, the strategy applies a moving average to the 12M return:
Default length: 12 periods
Plotted as a white line on the indicator panel
This becomes the benchmark used for crossovers.
3. Trade Signals (Long / Short / Cash)
Trades are generated using a simple crossover mechanism:
Bullish Signal (Go Long)
When:
12M Return crosses ABOVE its MA
Action:
Close short (if any)
Enter long
Bearish Signal (Go Short or Go Flat)
When:
12M Return crosses BELOW its MA
Action:
If shorting is enabled → Enter short
If shorting is disabled → Exit position and go to cash
Shorting can be enabled or disabled with a single input switch.
4. Position Sizing
The strategy uses:
Percent of Equity position sizing
You can specify the percentage of your portfolio to allocate (default 100%).
No leverage is required, but the strategy supports it if your account settings allow.
5. Visual Signals
To improve clarity, the strategy marks signals directly on the indicator panel:
Green Up Arrows: return > MA
Red Down Arrows: return < MA
A status label shows the current mode:
LONG
SHORT
CASH
6. Backtest-Ready
This script is built as a full TradingView strategy, not just an indicator.
This means you can:
Run complete backtests
View performance metrics
Compare long-only vs long/short behavior
Adjust inputs to tune the system
It provides a clean, rule-driven interpretation of the classic absolute momentum approach.
Inspired By: Gary Antonacci – Dual Momentum Investing
This script reflects the absolute momentum side of Antonacci’s original research:
Uses 12-month momentum (the most statistically validated lookback)
Applies a trend-following overlay to control downside risk
Recreates the classic signal structure used in academic studies
It is a simplified, transparent version intended for practical use and educational clarity.
Disclaimer
This script is for educational and research purposes only.
Historical performance does not guarantee future results.
Always use proper risk management.

BTC Mon 8am Buy / Wed 2pm Sell (NY Time, Daily + Intraday)This strategy implements a fixed weekly time-based trading schedule for Bitcoin, using New York market hours as the reference clock. It is designed to test whether a consistent pattern exists between early-week accumulation and mid-week distribution in BTC price behavior.
Entry Rule — Monday 8:00 AM (NY Time)
The strategy enters a long position every Monday at exactly 08:00 AM Eastern Time, one hour after the U.S. equities market pre-open activity begins influencing global liquidity.
This timing attempts to capture early-week directional moves in Bitcoin, which sometimes occur as traditional markets come online.
Exit Rule — Wednesday 2:00 PM (NY Time)
The strategy closes the position every Wednesday at 2:00 PM Eastern Time, a point in the week where:
U.S. equity markets are still open
BTC often experiences mid-week volatility rotations
Liquidity is generally high
This exit removes exposure before later-week uncertainty and gives a consistent, measurable time window for each trade.
Timeframe Compatibility
Works on intraday charts (recommended 1h or lower) using precise time-based triggers.
Also runs on daily charts, where entries and exits occur on the Monday and Wednesday bars respectively (daily charts cannot show intraday timestamps).
All timestamps are synced to America/New_York regardless of the exchange’s native timezone.
Trading Frequency
Exactly one trade per week, preventing overtrading and allowing comparison of weekly performance across years of historical BTC price data.
Purpose of the Strategy
This is not a value-based or trend-following system, but a behavioral/time-cycle analysis tool.
It helps evaluate whether a repeating short-term edge exists based solely on:
Weekday timing
Liquidity cycles
Institutional market influence
BTC’s habitual early-week momentum patterns
It is ideal for:
Backtesting weekly BTC behavior
Studying time-based edges
Comparing alternative weekday/time combinations
Visualizing weekly P&L structure
Risk Notes
This strategy does not attempt to predict price direction and should not be assumed profitable without robust backtesting.
Time-based edges can appear, disappear, or invert depending on macro conditions.
There is no stop loss or risk management included by default, so the strategy reflects raw timing-based performance.

SSL ST Strategy – Accuracy Enhanced v2.0 (Parser Safe)This strategy is built to identify high-probability trend breakouts using a combination of SSL Channel, Baseline, Hull / EMA signals, and Candle-based confirmations.
The goal is to filter noise, avoid false breakouts, and enter only when the trend is truly shifting.
This strategy identifies high-probability trend breakouts using SSL Channel, Baseline, Hull/EMA, and candle
confirmations.
1. SSL shows trend shift when price breaks high/low levels.
2. Baseline filters direction (price above = buy bias, below = sell bias).
3. Hull/EMA gives early momentum confirmation.
4. Candle breakout ensures real momentum (breaks previous high/low).
5. Optional filters: ATR, reversal logic, continuation entries.
6. Exits occur on SSL flip, baseline cross, or weakness
Disclaimer
This strategy is provided strictly for educational and informational purposes only. It does not guarantee any profit, nor does it protect against losses of any kind. Financial markets are inherently unpredictable, and any market movement can only be assumed or estimated with a probability that is never guaranteed and can often be no better than a 50/50 chance.
By using this strategy, you acknowledge that all trading decisions are made solely at your own risk. I am not liable for any profits, losses, or financial consequences incurred by anyone using or relying on this strategy. Always perform your own research, manage your risk responsibly, and consult with a qualified financial advisor before trading.

EMA Trend Pro [Hedging & Fixed Risk]
This strategy is a comprehensive trend-following system designed to capture significant market movements while strictly managing risk. It combines multiple Exponential Moving Averages (EMAs) for trend identification, ADX for trend strength filtering, and Volume confirmation to reduce false signals.
Key Features:
Hedging Mode Compatible: The script is designed to handle Long and Short positions independently. This is ideal for markets where trends can reverse quickly or for traders who prefer hedging logic (requires hedging=true in strategy settings).
Professional Risk Management: Unlike standard strategies that use fixed contract sizes, this script calculates Position Size based on Risk. You can define a fixed risk per trade (e.g., 1% of equity or $100 fixed risk). The script automatically adjusts the lot size based on the Stop Loss distance (ATR).
Multi-Stage Take Profit: The strategy scales out positions at 3 different levels (TP1, TP2, TP3) to lock in profits while letting the remaining position ride the trend.
Strategy Logic:
Trend Identification:
Long Entry: EMA 7 > EMA 14 > EMA 21 > EMA 144 (Bullish Alignment).
Short Entry: EMA 7 < EMA 14 < EMA 21 < EMA 144 (Bearish Alignment).
Filters:
ADX Filter: Entries are only taken if ADX (14) > Threshold (default 20) to ensure the market is trending, avoiding chopping ranging markets.
Volume Filter: Current volume must exceed the 20-period SMA volume by 10% to confirm momentum.
Exits & Trade Management:
Stop Loss: Dynamic SL based on ATR (e.g., 1.8x ATR).
Breakeven: Once TP1 is hit, the Stop Loss is automatically moved to Breakeven to protect capital.
Take Profits:
TP1: 1x Risk Distance (30% pos)
TP2: 2x Risk Distance (50% pos)
TP3: 3x Risk Distance (Remaining pos)
Settings Guide:
Risk Type: Choose between "Percent" (of equity) or "Fixed Amount" (USD).
Risk Value: Input your desired risk (e.g., 1.0 for 1% risk).
Fee %: Set your exchange's Taker fee (e.g., 0.05 or 0.06) for accurate backtesting.
ADX Threshold: Adjust to filter out noise (Higher = Stricter trend requirement).
Disclaimer: This script is for educational and backtesting purposes only. Past performance does not guarantee future results. Please use proper risk management.

Final Scalping Strategy - RELAXED ENTRY, jangan gopoh braderEMA Scalping System (MTF) Guide (1HR direction, 15 min entry)
Objective
To capture small, consistent profits by entering trades when 15-minute momentum aligns with the 1-hour trend.
Trades are executed only during high-liquidity London and New York sessions to increase the probability of execution and success.
Strategy Setup
Chart Timeframe (Execution): 15-Minute (M15).
Trend Filter (HTF): 1-Hour (H1) chart data is used for the long-term EMA.
Long-Term Trend Filter: 50-Period EMA (based on H1 data).
Short-Term Momentum Signal: 20-Period EMA (based on M15 data).
Risk
Metric: 14-period ATR for dynamic Stop Loss calculation.
✅ Trading Rules🟢
Long (Buy) Entry Conditions
Session: Must be within the London (0800-1700 GMT) or New York (1300-2200 GMT) sessions.
HTF Trend: Current price must be above the 1-Hour EMA 50.
Momentum Signal: Price crosses above the 15-Minute EMA 20.
Confirmation: The bar immediately following the crossover must close above the 15-Minute EMA 20.
Ent
ry: A market order is executed on the close of the confirmation candle.
🔴 Short (Sell) Entry Conditions
Session: Must be within the London (0800-1700 GMT) or New York (1300-2200 GMT) sessions.
HTF Trend: Current price must be below the 1-Hour EMA 50.
Momentum Signal: Price crosses below the 15-Minute EMA 20.
Confirmation: The bar immediately following the crossover must close below the 15-Minute EMA 20.
Entry: A market order is executed on the close of the confirmation candle.
🛑 Trade Management & Exits
Stop Loss (SL): Placed dynamically at 2.0 times the 14-period ATR distance from the entry candle's low (for Buys) or high (for Sells).
Take Profit (TP): Placed dynamically to achieve a 1.5 Risk-Reward Ratio (RR) (TP distance = 1.5 x SL d
istance).
📊 On-Chart Visuals
Detailed Labels: A box appears on the entry bar showing the action, SL/TP prices, Risk/Reward in Pips, and the exact R:R ratio.
Horizontal Lines: Dashed lines display the calculated SL (Red) and TP (Green) levels while the trade is active.
Background: The chart background is shaded to highlight the active London and New York tradi
ng sessions.

Roboquant RP Profits NY Open Retest StrategyRoboquant RP Profits NY Open Retest Strategy A good strategy for CL

Buy&Hold Profitcalculator in EuroTitle: Buy & Hold Strategy in Euro
Description:
This Pine Script implements a simple yet flexible Buy & Hold strategy denominated in Euros, suitable for a wide range of assets including cryptocurrencies, forex pairs, and stocks.
Key Features:
Custom Investment Amount: Define your invested capital in Euros.
Flexible Start & End Dates: Specify exact entry and exit dates for the strategy.
Automatic Currency Conversion: Supports assets priced in USD or USDT, converting the invested capital to chart currency using the EUR/USD exchange rate.
Single Entry and Exit: Executes a one-time Buy & Hold position based on the defined timeframe.
Profit and Performance Tracking: Calculates total profit/loss in Euros and percentage returns.
Smart Exit Label: Displays a dynamic label at the exit showing final position value, net profit/loss, and return percentage. The label automatically adjusts its position above or below the price bar for optimal visibility.
Visual Enhancements:
Position value and profit/loss plotted on the chart.
Background color highlights the active investment period.
Buy and Sell markers clearly indicate entry and exit points.
This strategy is ideal for traders and investors looking to simulate long-term positions and evaluate performance in Euro terms, even when trading USD-denominated assets.
Usage Notes:
Best used on daily charts for medium- to long-term analysis.
Adjust start and end dates, as well as invested capital, to simulate different scenarios.
Works with any asset, but currency conversion is optimized for USD or USDT-pegged instruments.

US/SPY- Financial Regime Index Swing Strategy Credits: concept inspired by EdgeTools Bloomberg Financial Conditions Index (Proxy)
Improvements: eight component basket, inverse volatility weights, winsorization option( statistical technique used to limit the influence of outliers in a dataset by replacing extreme values with less extreme ones, rather than removing them entirely), slope and price gates, exit guards, table and gradients.
Summary in one paragraph
A macro regime swing strategy for index ETFs, futures, FX majors, and large cap equities on daily calculation with optional lower time execution. It acts only when a composite Financial Conditions proxy plus slope and an optional price filter align. Originality comes from an eight component macro basket with inverse volatility weights and winsorized return z scores that produce a portable yardstick.
Scope and intent
Markets: SPY and peers, ES futures, ACWI, liquid FX majors, BTC, large cap equities.
Timeframes: calculation daily by default, trade on any chart.
Default demo: SPY on Daily.
Purpose: convert broad financial conditions into clear swing bias and exits.
Originality and usefulness
Unique fusion: return z scores for eight liquid proxies with inverse volatility weighting and optional winsorization, then slope and price gates.
Failure mode addressed: false starts in chop and early shorts during easy liquidity.
Testability: all knobs are inputs and the table shows components and weights.
Portable yardstick: z scores center at zero so thresholds transfer across symbols.
Method overview in plain language
Base measures
Return basis: natural log return over a configurable window, standardized to a z score. Winsorization optional to cap extremes.
Components
EQ US and EQ GLB measure equity tone.
CREDIT uses LQD over HYG. Higher credit quality outperformance is risk off so sign is flipped after z score.
RATES2Y uses two year yield, sign flipped.
SLOPE uses ten minus two year yield spread.
USD uses DXY, sign flipped.
VOL uses VIX, sign flipped.
LIQ uses BIL over SPY, sign flipped.
Each component is smoothed by the composite EMA.
Fusion rule
Weighted sum where weights are equal or inverse volatility with exponent gamma, normalized to percent so they sum to one.
Signal rule
Long when composite crosses up the long threshold and its slope is positive and price is above the SMA filter, or when composite is above the configured always long floor.
Short when composite crosses down the short threshold and its slope is negative and price is below the SMA filter.
Long exit on cross down of the long exit line or on a fresh short signal.
Short exit on cross up of the short exit line or on a fresh long signal, or when composite falls below the force short exit guard.
What you will see on the chart
Markers on suggestion bars: L for long, S for short, LX and SX for exits.
Reference lines at zero and soft regime bands at plus one and minus one.
Optional background gradient by regime intensity.
Compact table with component z, weight percent, and composite readout.
Table fields and quick reading guide
Component: EQ US, EQ GLB, CREDIT, RATES2Y, SLOPE, USD, VOL, LIQ.
Z: current standardized value, green for positive risk tone where applicable.
Weight: contribution percent after normalization.
Composite: current index value.
Reading tip: a broadly green Z column with slope positive often precedes better long context.
Inputs with guidance
Setup
Calc timeframe: default Daily. Leave blank to inherit chart.
Lookback: 50 to 1500. Larger length stabilizes regimes and delays turns.
EMA smoothing: 1 to 200. Higher smooths noise and delays signals.
Normalization
Winsorize z at ±3: caps extremes to reduce one off shocks.
Return window for equities: 5 to 260. Shorter reacts faster.
Weighting
Weight lookback: 20 to 520.
Weight mode: Equal or InvVol.
InvVol exponent gamma: 0.1 to 3. Higher compresses noisy components more.
Signals
Trade side: Long Short or Both.
Entry threshold long and short: portable z thresholds.
Exit line long and short: soft exits that give back less.
Slope lookback bars: 1 to 20.
Always long floor bfci ≥ X: macro easy mode keep long.
Force short exit when bfci < Y: macro stress guard.
Confirm
Use price trend filter and Price SMA length.
View
Glow line and Show component table.
Symbols
SPY ACWI HYG LQD VIX DXY US02Y US10Y BIL are defaults and can be changed.
Realism and responsible publication
No performance claims. Past is not future.
Shapes can move intrabar and settle on close.
Execution is on standard candles only.
Honest limitations and failure modes
Major economic releases and illiquid sessions can break assumptions.
Very quiet regimes reduce contrast. Use longer windows or higher thresholds.
Component proxies are ETFs and indexes and cannot match a proprietary FCI exactly.
Strategy notice
Orders are simulated on standard candles. All security calls use lookahead off. Nonstandard chart types are not supported for strategies.
Entries and exits
Long rule: bfci cross above long threshold with positive slope and optional price filter OR bfci above the always long floor.
Short rule: bfci cross below short threshold with negative slope and optional price filter.
Exit rules: long exit on bfci cross below long exit or on a short signal. Short exit on bfci cross above short exit or on a long signal or on force close guard.
Position sizing
Percent of equity by default. Keep target risk per trade low. One percent is a sensible starting point. For this example we used 3% of the total capital
Commisions
We used a 0.05% comission and 5 tick slippage
Legal
Education and research only. Not investment advice. Test in simulation first. Use realistic costs.


CE+ZLSMA RovTrading StrateryThe strategy is optimized for scalping in small timeframes like M15 and M30, as well as M5.
It combines two indicators: CE and ZLSMA.
Try it now!

Moon Phases Long/Short StrategyThis is an experiment of Moon Phases, likely buy when full moon and sell when new moon with few changes, like it would buy a day ahead or sometimes sell a day post these events, with Stop loss and take profits, 50% profitable so sounds good to me
Long only good for bitcoin gold, both modes(L+S) better for stocks and alt coins

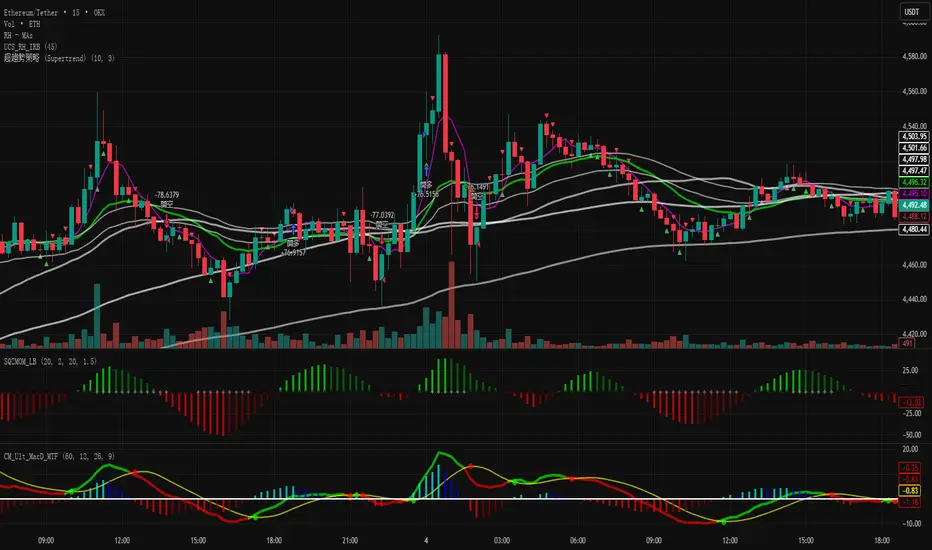
超趨勢策略 (中文)-Caelusif ta.change(direction) < 0
strategy.entry("My Long Entry Id", strategy.long)
if ta.change(direction) > 0
strategy.entry("My Short Entry Id", strategy.short)