Fibo RSIThis is a customized Relative Strength Index (RSI) indicator designed to replicate TradingView’s default RSI while adding additional reference levels for deeper market analysis.
🔹 Features:
RSI length set to 8 by default (user adjustable).
Calculates RSI using the standard ta.rsi() function.
Plots the RSI line in a clean, separate panel.
Adds 7 key levels for analysis: 0, 20, 30, 50, 70, 80, 100.
Levels are drawn as thin, solid straight lines for a cleaner look (instead of default dashed).
🔹 Use cases:
Identify momentum shifts with enhanced precision.
Use intermediate levels (20, 30, 50, 70, 80) as potential support/resistance zones.
Ideal for traders who want a Fibonacci-like structure in RSI analysis.
Fibo

VSA Volume + Fibonacci (Volunacci)Overview
This indicator combines Volume Spread Analysis (VSA) with Fibonacci levels to identify key price zones based on volume behavior. It helps traders determine potential support and resistance levels influenced by volume strength.
How It Works
Volume Calculation
The indicator calculates volume levels based on the selected timeframe.
It identifies high volume spikes and low volume dips, which are critical for detecting supply and demand shifts.
It uses a simple moving average (SMA) of volume to smooth fluctuations.
Fibonacci Levels Integration
When a high-volume event is detected, the indicator records the highest high and lowest low of that candle.
It then plots Fibonacci retracement and extension levels to highlight potential price reaction zones.
Negative Fibonacci levels are included to identify possible deep retracements.
Visual Features
The indicator adapts to both light and dark themes for better visibility.
Fibonacci lines are color-coded based on key retracement and extension levels.
A table displaying key Fibonacci levels and their corresponding prices is provided for quick reference.
Why Is This Indicator Useful?
It helps traders spot accumulation and distribution phases by analyzing volume at key price points.
The combination of VSA and Fibonacci allows traders to confirm trend strength and identify potential reversal points.
Works well for trend-following strategies, scalping, and breakout trading.
How to Use This Indicator?
Use it to confirm breakouts or reversals at Fibonacci levels when volume supports the move.
Watch for high-volume spikes near key Fibonacci zones—these can signal strong trend continuation or reversal.
Use the displayed Fibonacci table to quickly assess price reaction levels.
Credits
This script was inspired by the Hidden Gap’s VSA Volume indicator by HPotter and has been enhanced by integrating Fibonacci-based analysis.
Fibonacci Plot [ABA Invest]]ABOUT
This Fibonacci tool is easier than the usual Fibonacci drawing. with this, we can use Fibonacci drawing by choosing 2 different candles as starting point and ending point
INPUT SETTING
Fibonacci type: we can choose the type
option 1--> Fibonacci standard: display multiple levels constructed using the starting price point, ending price point, and multiple Fibonacci ratios. These levels can be used as support and resistance
option 2--> Fibonacci musang displays multiple levels constructed using the starting price point, ending price point, and multiple Fibonacci ratios. these levels can be used as taking profit level and also to know the ending of trendline
Drawing point: we can choose the type how we want the tools to draw our starting and ending point at candlestick
- wick to wick
- wick to body
- body to body

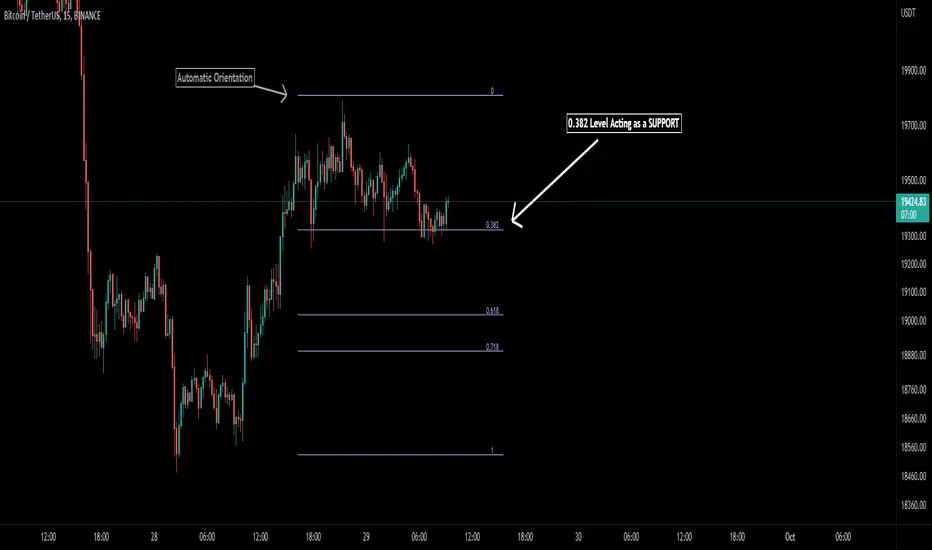
Auto Fibonacci [Misu]█ This indicator shows an automatic Fibonacci retracement levels.
This indicator is designed based on highs, lows, and trend interpretation to orientate the fibonacci retracement in the good direction.
Fibonacci analysis uses a logical sequence of numbers to predict trends and price action.
█ Usages:
The Fibonacci retracement is used to identify hidden support and resistance levels that an investor can use for entry, exit, and stop placement.
Depending on your usage, you can track breakouts above and below retracement levels to provide early entry points for major breakouts and breakdowns.
█ Features:
> Choose Fib levels
> Color Fib Levels all in one
> Color Fib Levels Individually
█ Parameters:
Deviation: A parameter used to calculate pivots.
Depth: A parameter used to calculate pivots.
UI Settings: Select Fibs levels and colors.
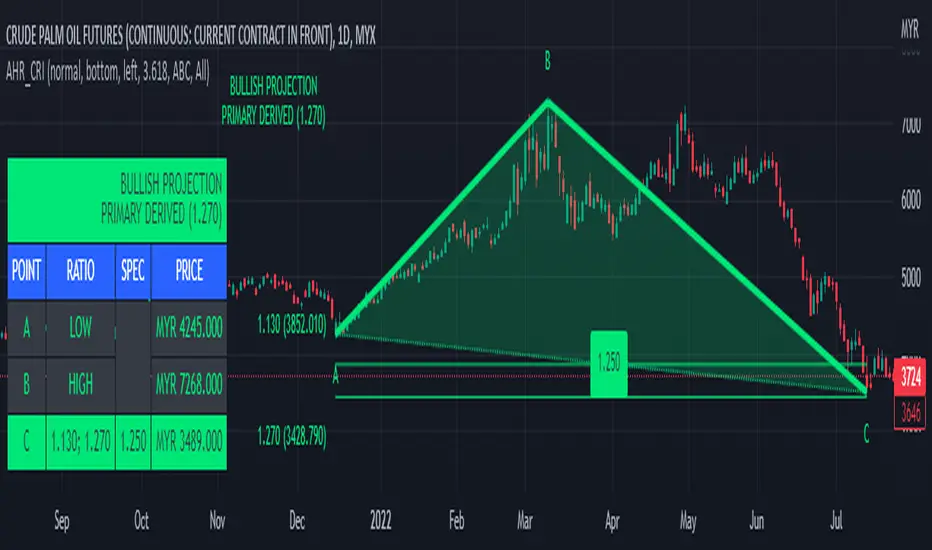
ABC 123 Harmonic Ratio Custom Range Interactive█ OVERVIEW
This indicator was designed based on Harmonic Trading : Volume One written by Scott Carney.
This is about harmonic ratios which expanded through retracement and projection.
Derivation is pretty much explained here such as Primary, Primary Derivation, Secondary Derivation and Secondary Derivation Extreme.
Derivation value depends on minimum retracement or maximum projection.
This derivation value utilize Fibonacci value which later expand to Harmonic Ratio.
█ INSPIRATION
Inspired by design, code and usage of CAGR . Basic usage of custom range / interactive, pretty much explained here . Credits to TradingView.
This build is based and visualized upon Harmonic Trading Ratios.
This build also was stripped down from XABCD Harmonic Pattern Custom Range Interactive .
█ CREDITS
Scott Carney, Harmonic Trading : Volume One (Page 18)
█ FEATURES
Table can positioned by any position and font size can be resized.
Labels can be either changed to alphabets or numbers.
█ HOW TO USE
Draw points from Point A to Point C.
Dont worry about magnet, point will attached depends on High or Low of the candle.
█ USAGE / TIPS EXAMPLES (Description explained in each image)
FiboBars ExtendedA trend indicator FiboBars Extended , the main purpose of which is to confirm the trend and cut off market noise. In his logic, he uses the Fibonacci sequence.
Two settings are used to account for noise suppression accuracy:
Period - number of calculation bars
Level - Fibonacci number selection

Harmonic Table Combo Point B█ OVERVIEW
This indicator was intended as educational purpose only and alternative way to show value in table as shown in Harmonic Pattern Possibility Table .
█ CREDITS
Credit to Scott M Carney, Harmonic Trading Volume 3: Reaction vs. Reversal.
█ USAGE EXAMPLE

Harmonic Pattern Possibility Table█ OVERVIEW
This indicator was intended as educational purpose only based on Harmonic Pattern Table (Source Code) and Ratio For Harmonic Points to show Harmonic Pattern Possibility.
█ INSPIRATION
This indicator was build upon realizing there are some overlap for B = XA among Alternate Bat, Bat, Crab and Gartley.
Hence, the values split up to showcase the possibility of non overlap ratio.
█ USAGE
Possible pattern, priority pattern and selected pattern may differs based value input.
Therefore C = AB, D = BC, D = XA and Stop Loss will change based value input and also selected pattern.
█ CREDITS
Credit to Scott M Carney, Harmonic Trading Volume 3: Reaction vs. Reversal.

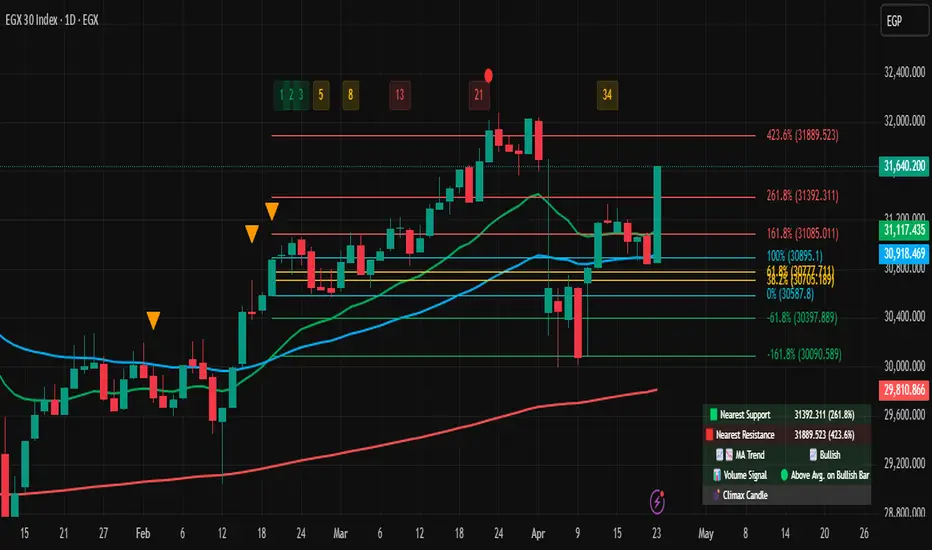
Fibonacci Timing PatternThe Fibonacci Timing Pattern is a price-based counter that seeks to determine short-term and medium-term reversals in price action. It is based on the following set of conditions:
* For a bullish Fibonacci timing signal: The market must shape 8 consecutive close prices where each close price is lower than the close prices from 3 and 5 periods ago.
* For a bearish Fibonacci timing signal: The market must shape 8 consecutive close prices where each close price is higher than the close prices from 3 and 5 periods ago.
The signals of the pattern are ideally used in a sideways market or used in tandem with the trend (bullish signals are taken in a bullish market and bearish signals are taken in a bearish market).

Ratio For Harmonic Points█ OVERVIEW
This indicator was intended as educational purpose only based on Harmonic Pattern Table (Source Code) to show indication of ratio for each Harmonic points from Point B until Stop Loss.
█ CREDITS
Credit to Scott M Carney, Harmonic Trading Volume 3: Reaction vs. Reversal.
█ USAGE EXAMPLE

B-auto fibA new interactive input mode for price and time inputs is now available. Instead of selecting bar numers and/or time from input widgets, you can now select them by clicking on the chart.
The interactive mode is activated by using confirm = true in input.time() and input.price().
This is code for an Anchored fibonachi indicator where the anchor point is set interactively
this way you can change start date and fib level is calculating automaticly indicator is finding highest and lowest price and calculating fib levels
thanks to versiyon5
i hope tradingview will make a fibo widget like Anchored VWAP it will be very usefull
thanks good works so far :)

Volume MA * Fibo levelsIn the scrypt above, the SMA of Volume is taken as a basis and the Fibonacci levels are calculated.
This can be useful for analyzing the trend in accordance with changes in volume.
Any feedback is appreciated!
Good luck with your trading!


Custom FIBOThis script shows 3 Donchian Channel 78.6% and 21.4% intermediary level lines to perform trade analysis. Besides those 6 lines it also optionally shows Fibonacci's retracements with 100%, 127%, 162%, 200% and 262% for one of the Donchian channels.
The 3 Donchian Channels used have default lengths 72, 305 and 1292, calculated after the first length default value of 72. For each of the 3 Donchian Channels only an upper line, set by default at 78.6%, is plotted in green and its complement, set to 21.4%, is plotted in red. When the closing price is above 3 green lines, we say it is Forbidden to Sell ( PV ), and when the closing price is below 3 red lines, we say it is Forbidden to Buy ( PC ). Those conditions are flagged on the chart. These PV-PC conditions were, up to my knowledge, first proposed by Bo Williams.
Fibonacci's retracements are show for the Donchian Channel with length 72 by default, but it can be changed to any length. They are colored as fuchsia (100%), blue (127%), orange (162%), yellow (200%) and navy (262%).

Auto Fibonacci ComboA combination of Fibonacci indicators including:
1- Moving Auto-calculated Fibo Retracement Levels
2- Dynamic Auto-calculated Fibo Extension Levels
3- Adjustable Auto-calculated Fibo Time Zones
4- ّFlexible Fibo Moving Averages Ribbon
The ribbon consists of 10 moving averages of selected source for different Fibonacci numbers count of bars which could be colorized for a better trend observation. Also the type of the moving averages could be picked up from 6 different types which are:
- SMA (Simple Moving Average)
- EMA (Exponential Moving Average)
- HMA (Hull Moving Average)
- LSMA (Least Squares Moving Average)
- TMA (Triangular Moving Average)
- MAEMA (My Personalized Momentum Adjusted EMA)
I think the latter one makes a nice conjunction with Fibonacci retracements.
Feel free to test the set and send me your thoughts.

LV Support&Resistancegives rough predictions on support and resistance levels by using rma and fibo numbers.
white color is the original rma250 value.
(Note: it is more easy to see them on logarithmic scale)

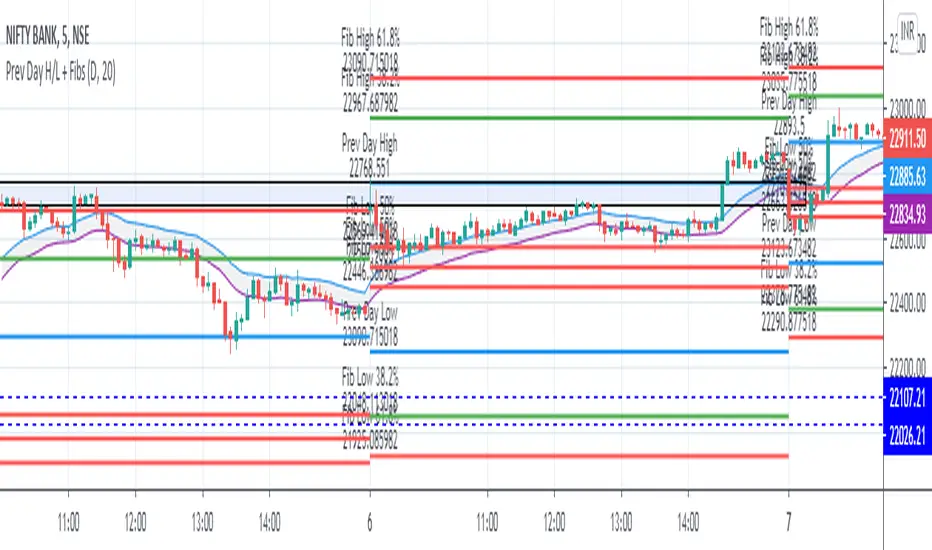
Previous Day High - Low and EMA BandThe fib are plotted to previous day High and low to find next days support and resistance based on fibs.
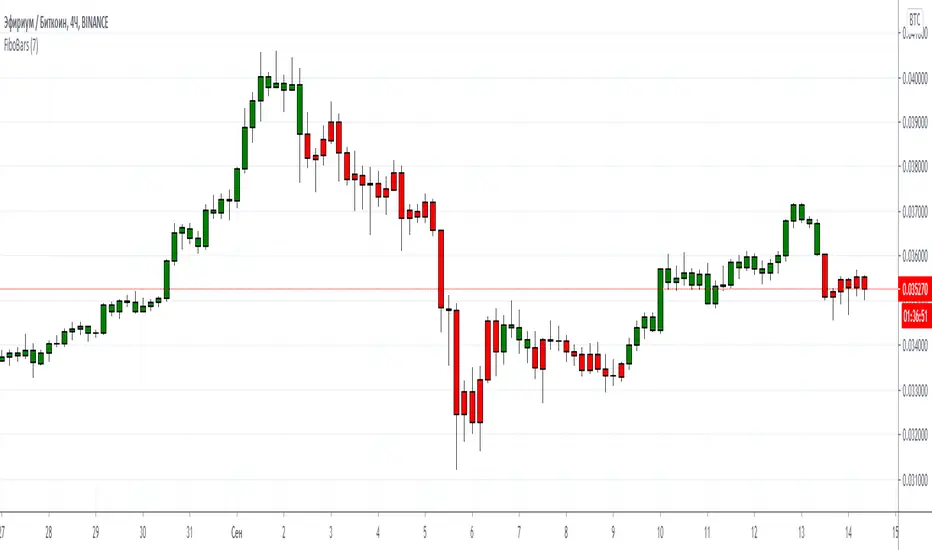
FiboBarsThis indicator is used to remove noise in the price chart. In its logic, it uses the Fibonacci number. To adjust the noise level, there is a "period" field in the settings. The higher the period value, the more noise the indicator absorbs.
Ideal for trending instruments.
Данный индикатор служит для удаления шума в графике цены. В своей логики он использует число Фибоначчи. Для возможности настройки уровня шума, в настройках есть поле "период". Чем выше значение периода, тем больше шумы поглощает индикатора.
Идеально подходит для трендовых инструментов.

MA * Fibo levels (canal)Some updates to the scrypt "MA * Fibo levels (auto)"
In the previous scrypt we drew lines using either highs or lows of the candles due to the positiveness or negativeness of given percentages.
But, after some research it seems easier to use CANALS to buy or sell rather than LINES. So these canals are the intervals between SMA(highs) and SMA(lows) multiplied by FIBO coefficients. However, lines can be also used as stop-losses if the price goes out of the canal, and wait until the price reaches the other canal.
Good luck in trading!
If the scrypt was useful let me know!
Any feedbacks and ideas are welcomed!

MA * Fibo levels (auto)A few updates to the previous post.
In order to catch more exact points of TP and SL, the scrypt takes "high" as the source of SMA if the percentage is greater than 0 ( > 0), and "low" as the source when the given percentage is less than 0 ( < 0).
So there are two basic SMA line ( one with "high", the other one with "low"), and the other lines would be results of multiplying either the higher base or the lower one.
Good luck in trading!
If the scrypt was useful let me know!
Any feedbacks and ideas are welcomed!

Custom EMA + FIBOThis script combines 6 EMAs with 3 Donchian Channel 78.6% and 21.4% intermediary level lines to perform trade analysis. The 6 EMAs (I, II, III , IV, V and VI ) default lengthes come from one of the Fibonacci Phi^3 and Phi^3/2 sub series (17, 34, 72, 144, 305 and 610), but can be changed to any values, particularly to the traditionally used 20, 40, 50, 100, 200 and 300. Up to my knowledge, Fibonacci Phi^3 and Phi^3/2 sub series lengthes were first proposed by Bo Williams.
The 3 Donchian Channels used have default lengthes 72, 305 and 1292, calculated after the first length default value of 72. For each of the 3 Donchian Channels only an upper line, set by default at 78.6%, is plotted in green and its complement, set to 21.4%, is plotted in red. When the closing price is above 3 green lines, we say it is Forbidden to Sell ( PV ), and when the closing price is below 3 red lines, we say it is Forbidden to Buy ( PC ). Those conditions are flagged on the chart. These PV-PC conditions were, up to my knowledge, first proposed by Bo Williams.

4 Fibonacci EMAsAdd 4 Fibonacci EMAs to your charts with one indicator.
Configureable by value, so they don't necessarily have to use Fibonacci numbers, and by colors.
