MFI Volume Profile [Kodexius]The MFI Volume Profile indicator blends a classic volume profile with the Money Flow Index so you can see not only where volume traded, but also how strong the buying or selling pressure was at those prices. Instead of showing a simple horizontal histogram of volume, this tool adds a money flow dimension and turns the profile into a price volume momentum heat map.
The script scans a user controlled lookback window and builds a set of price levels between the lowest and highest price in that period. For every bar inside that window, its volume is distributed across the price levels that the bar actually touched, and that volume is combined with the bar’s MFI value. This creates a volume weighted average MFI for each price level, so every row of the profile knows both how much volume traded there and what the typical money flow condition was when that volume appeared.
On the chart, the indicator plots a stack of horizontal boxes to the right of current price. The length of each box represents the relative amount of volume at that price, while the color represents the average MFI there. Levels with stronger positive money flow will lean toward warmer shades, and levels with weaker or negative money flow will lean toward cooler or more neutral shades inside the configured MFI band. Each row is also labeled in the format Volume , so you can instantly read the exact volume and money flow value at that level instead of guessing.
This gives you a detailed map of where the market really cared about price, and whether that interest came with strong inflow or outflow. It can help you spot areas of accumulation, distribution, absorption, or exhaustion, and it does so in a compact visual that sits next to price without cluttering the candles themselves.
Features
Combined volume profile and MFI weighting
The indicator builds a volume profile over a user selected lookback and enriches each price row with a volume weighted average MFI. This lets you study both participation and money flow at the same price level.
Volume distributed across the bar price range
For every bar in the window, volume is not assigned to a single price. Instead, it is proportionally distributed across all price rows between the bar low and bar high. This creates a smoother and more realistic profile of where trading actually happened.
MFI based color gradient between 30 and 70
Each price row is colored according to its average MFI. The gradient is anchored between MFI values of 30 and 70, which covers typical oversold, neutral and overbought zones. This makes strong demand or distribution areas easier to spot visually.
Configurable structure resolution and depth
Main user inputs are the lookback length, the number of rows, the width of the profile in bars, and the label text size. You can quickly switch between coarse profiles for a big picture and higher resolution profiles for detailed structure.
Numeric labels with volume and MFI per row
Every box is labeled with the total volume at that level and the average MFI for that level, in the format Volume . This gives you exact values while still keeping the visual profile clean and compact.
Calculations
Money Flow Index calculation
currentMfi is calculated once using ta.mfi(hlc3, mfiLen) as usual,
Creation of the profileBins array
The script creates an array named profileBins that will hold one VPBin element per price row.
Each VPBin contains
volume which is the total volume accumulated at that price row
mfiProduct which is the sum of volume multiplied by MFI for that row
The loop;
for i = 0 to rowCount - 1 by 1
array.push(profileBins, VPBin.new(0.0, 0.0))
pre allocates a clean structure with zero values for all rows.
Finding highest and lowest price across the lookback
The script starts from the current bar high and low, then walks backward through the lookback window
for i = 0 to lookback - 1 by 1
highestPrice := math.max(highestPrice, high )
lowestPrice := math.min(lowestPrice, low )
After this loop, highestPrice and lowestPrice define the full price range covered by the chosen lookback.
Price range and step size for rows
The code computes
float rangePrice = highestPrice - lowestPrice
rangePrice := rangePrice == 0 ? syminfo.mintick : rangePrice
float step = rangePrice / rowCount
rangePrice is the total height of the profile in price terms. If the range is zero, the script replaces it with the minimum tick size for the symbol. Then step is the price height of each row. This step size is used to map any price into a row index.
Processing each bar in the lookback
For every bar index i inside the lookback, the script checks that currentMfi is not missing. If it is valid, it reads the bar high, low, volume and MFI
float barTop = high
float barBottom = low
float barVol = volume
float barMfi = currentMfi
Mapping bar prices to bin indices
The bar high and low are converted into row indices using the known lowestPrice and step
int indexTop = math.floor((barTop - lowestPrice) / step)
int indexBottom = math.floor((barBottom - lowestPrice) / step)
Then the indices are clamped into valid bounds so they stay between zero and rowCount - 1. This ensures that every bar contributes only inside the profile range
Splitting bar volume across all covered bins
Once the top and bottom indices are known, the script calculates how many rows the bar spans
int coveredBins = indexTop - indexBottom + 1
float volPerBin = barVol / coveredBins
float mfiPerBin = volPerBin * barMfi
Here the total bar volume is divided equally across all rows that the bar touches. For each of those rows, the same fraction of volume and volume times MFI is used.
Accumulating into each VPBin
Finally, a nested loop iterates from indexBottom to indexTop and updates the corresponding VPBin
for k = indexBottom to indexTop by 1
VPBin binData = array.get(profileBins, k)
binData.volume := binData.volume + volPerBin
binData.mfiProduct := binData.mfiProduct + mfiPerBin
Over all bars in the lookback window, each row builds up
total volume at that price range
total volume times MFI at that price range
Later, during the drawing stage, the script computes
avgMfi = bin.mfiProduct / bin.volume
for each row. This is the volume weighted average MFI used both for coloring the box and for the numeric MFI value shown in the label Volume .
Distribution

Tactical Holding [SwissAlgo]Tactical Holding
A visual framework for managing long-term positions across market cycles
--------------------------------------------------------------
Purpose
Instead of holding a fixed position through all market conditions , you can use this framework to adjust your exposure tactically . By reducing positions during distribution phases and accumulating during favorable accumulation zones, you may end up holding more units of the asset over complete market cycles - even if you temporarily exit or reduce exposure during unfavorable periods. This approach aims to help you compound your holdings by taking advantage of market volatility rather than simply enduring it.
--------------------------------------------------------------
Recommended Settings
Timeframe : Weekly (1W) chart
Chart Type : Standard candlesticks (select 'Bar' type Candles)
This indicator is designed for higher timeframe analysis. While it can be applied to other timeframes, the logic and signal generation are optimized for weekly charts to filter out short-term noise and focus on major market cycles.
--------------------------------------------------------------
Key Features
♦ Market State Classification
The indicator aims to categorize potential market conditions into five color-coded states based on technical confluences:
* Bull (bright green): Multiple bullish indicators align
* Bull Retrace (teal): Bullish structure with temporary weakness
* Bull ⇆ Bear Reversal (yellow): Transitional phase between trends
* Bear (bright red): Multiple bearish indicators align
* Bear Retrace (Pale Red/Maroon): Bearish structure with temporary strength
♦ Visual Elements
* Candles change color based on the current market state
* A 50-period EMA tracks with the same color coding, providing visual trend context
* Small arrow markers appear when specific pattern conditions are met (zones for potential distribution or accumulation)
* A legend table (toggle on/off) explains the color system
* A label shows the current state name on the chart
♦ Pattern Recognition
The system monitors for two types of potential entry/exit zones:
1. State transition patterns after periods of market regime consistency
2. RSI divergence patterns (when price and momentum move in opposite directions)
♦ Customization
* Toggle the legend table visibility through settings
* All calculations are transparent and use standard technical analysis methods
--------------------------------------------------------------
How It Works
Think of this indicator as a traffic light system for your portfolio:
♦ Green zones suggest the asset might be in an environment where long-term holders historically have remained invested
Bright green (Bull) : Multiple technical indicators align in a potentially strong bullish phase
Pale green (Bull Retrace) : Bullish structure remains intact, but momentum shows temporary weakness - often a pullback within an uptrend
♦ Red zones suggest conditions where long-term holders might consider reducing exposure or waiting for better entry points
Dark red (Bear) : Multiple technical indicators align in a potentially strong bearish phase
Pale red (Bear Retrace) : Bearish structure remains intact but shows temporary strength - often a bounce within a downtrend
♦ Yellow zones indicate the market is in transition between bull and bear regimes - a time for increased attention as the trend direction becomes uncertain
The system doesn't predict future prices. Instead, it helps you understand the current technical environment by doing the heavy lifting of analyzing multiple indicators at once and presenting them in a simple visual format.
Example: During the 2022 crypto bear market, the indicator would have displayed extended red periods, signaling defensive conditions for holders. When accumulation arrows appeared in late 2022-early 2023, it highlighted potential re-entry zones as the technical regime transitioned back toward green, before the 2024 recovery.
--------------------------------------------------------------
Who This Is For
♦ Long-term investors who want to hold assets through cycles but prefer a systematic approach to position sizing and timing rather than buying and never selling .
♦ Portfolio managers looking for a visual tool to help determine when to increase or decrease exposure to specific assets based on technical regime changes.
♦ Swing traders on higher timeframes who want to align their positions with the broader market structure rather than fighting the trend.
This is not designed for:
* Day traders or scalpers
* Those seeking exact entry/exit prices
* Automated trading systems (this is a visual decision-support tool)
--------------------------------------------------------------
Understanding the Visuals
When you apply Tactical Holding to a chart, you'll see:
1. Colored candles - Instantly see what market regime the asset is in
2. Colored EMA line (thick line) - Provides a dynamic support/resistance reference that changes color with market conditions
3. Small arrows (↑ ↓) - Mark bars where specific technical patterns complete
4. State label - Shows current market classification
5. Legend table (top right) - Quick reference guide for the color system
6. Warning banner (top center) - Reminds you to use weekly charts
The visual design prioritizes clarity over complexity. You should be able to glance at a chart and immediately understand the current technical environment.
--------------------------------------------------------------
Important Limitations
This indicator cannot:
* Predict future price movements
* Guarantee profitable trades
* Work equally well on all assets or timeframes
* Replace your own research and risk management
Technical considerations:
* Divergence detection has a 3-bar confirmation lag (by design, to avoid false signals)
* State transitions require multiple technical confirmations, which may cause delayed reactions to rapid market changes
* The system is reactive, not predictive - it responds to price action after it occurs
* Performance varies significantly between trending assets (like Solana) and stable assets (like Apple)
--------------------------------------------------------------
Practical Application
Consider using this indicator as one component of a broader investment framework:
♦ Understanding Position Context:
The color-coded states can help frame your thinking about current holdings:
Bull: Technical conditions that have historically been associated with sustained uptrends
Bull Retrace: Pullbacks within an overall bullish structure- these periods may offer opportunities to evaluate entry points or reassess existing positions
Reversal (Yellow): Transitional phases where the trend direction is unclear - periods that may warrant closer monitoring
Bear Retrace: Temporary strength within an overall bearish structure - rallies that historically have often faded
Bear: Technical conditions that have historically been associated with sustained downtrends
♦ Interpreting Signal Arrows:
Arrow markers indicate when specific technical pattern conditions have been met. These are observation points, not instructions:
A signal appearing doesn't mean immediate action is required
Treat arrows as prompts for further analysis rather than automatic triggers
Consider the broader context: fundamentals, your investment timeline, risk tolerance, and overall market conditions
Signals show when historical technical patterns have formed - not whether those patterns will lead to the same outcomes as in the past
The framework is designed to organize information visually, not to tell you what to do. Your investment decisions should incorporate this technical perspective alongside other factors relevant to your situation.
--------------------------------------------------------------
Technical Methodology
For transparency, the indicator uses:
* RSI (14) with a 14-period SMA to assess momentum direction
* MACD (12,26,9) to confirm trend strength and histogram momentum
* Stochastic RSI with K and D line crossovers for additional confirmation
* 50-period EMA as the primary trend filter
* Linear regression-based slope analysis to detect flat/transitional periods
* Pivot-based divergence detection following standard technical analysis principles
All calculations use publicly available technical analysis formulas. Nothing is hidden or proprietary beyond the specific combination and weighting of these standard tools.
--------------------------------------------------------------
Disclaimer
This indicator is an educational and analytical tool only. It is not financial advice.
* Trading and investing involve substantial risk of loss
* Past performance of any technical system does not indicate future results
* No indicator can predict market movements with certainty
* Always conduct your own research and consult with qualified financial professionals
* Never invest more than you can afford to lose
* The creators of this indicator are not responsible for any trading losses
* This tool is not affiliated with, endorsed by, or connected to TradingView, 3Commas, or any other trading platform
* Use of this indicator is at your own risk
Risk Management: Regardless of what any indicator shows, always use proper position sizing, stop losses, and risk management appropriate to your personal financial situation.
This indicator provides a framework for analysis. Your decisions, research, and risk management determine your results.

Central Limit Theorem Reversion IndicatorDear TV community, let me introduce you to the first-ever Central Limit Theorem indicator on TradingView.
The Central Limit Theorem is used in statistics and it can be quite useful in quant trading and understanding market behaviors.
In short, the CLT states: "When you take repeated samples from any population and calculate their averages, those averages will form a normal (bell curve) distribution—no matter what the original data looks like."
In this CLT indicator, I use statistical theory to identify high-probability mean reversion opportunities in the markets. It calculates statistical confidence bands and z-scores to identify when price movements deviate significantly from their expected distribution, signaling potential reversion opportunities with quantifiable probability levels.
Mathematical Foundation
The Central Limit Theorem (CLT) says that when you average many data points together, those averages will form a predictable bell-curve pattern, even if the original data is completely random and unpredictable (which often is in the markets). This works no matter what you're measuring, and it gets more reliable as you use more data points.
Why using it for trading?
Individual price movements seem random and chaotic, but when we look at the average of many price movements, we can actually predict how they should behave statistically. This lets us spot when prices have moved "too far" from what's normal—and those extreme moves tend to snap back (mean reversion).
Key Formula:
Z = (X̄ - μ) / (σ / √n)
Where:
- X̄ = Sample mean (average return over n periods)
- μ = Population mean (long-term expected return)
- σ = Population standard deviation (volatility)
- n = Sample size
- σ/√n = Standard error of the mean
How I Apply CLT
Step 1: Calculate Returns
Measures how much price changed from one bar to the next (using logarithms for better statistical properties)
Step 2: Average Recent Returns
Takes the average of the last n returns (e.g., last 100 bars). This is your "sample mean."
Step 3: Find What's "Normal"
Looks at historical data to determine: a) What the typical average return should be (the long-term mean) and b) How volatile the market usually is (standard deviation)
Step 4: Calculate Standard Error
Determines how much sample averages naturally vary. Larger samples = smaller expected variation.
Step 5: Calculate Z-Score
Measures how unusual the current situation is.
Step 6: Draw Confidence Bands
Converts these statistical boundaries into actual price levels on your chart, showing where price is statistically expected to stay 95% and 99% of the time.
Interpretation & Usage
The Z-Score:
The z-score tells you how statistically unusual the current price deviation is:
|Z| < 1.0 → Normal behavior, no action
|Z| = 1.0 to 1.96 → Moderate deviation, watch closely
|Z| = 1.96 to 2.58 → Significant deviation (95%+), consider entry
|Z| > 2.58 → Extreme deviation (99%+), high probability setup
The Confidence Bands
- Upper Red Bands: 95% and 99% overbought zones → Expect mean reversion downward as the price is not likely to cross these lines.
- Center Gray Line: Statistical expectation (fair value)
- Lower Blue Bands: 95% and 99% oversold zones → Expect mean reversion upward
Trading Logic:
- When price exceeds the upper 95% band (z-score > +1.96), there's only a 5% probability this is random noise → Strong sell/short signal
- When price falls below the lower 95% band (z-score < -1.96), there's a 95% statistical expectation of upward reversion → Strong buy/long signal
Background Gradient
The background color provides real-time visual feedback:
- Blue shades: Oversold conditions, expect upward reversion
- Red shades: Overbought conditions, expect downward reversion
- Intensity: Darker colors indicate stronger statistical significance
Trading Strategy Examples
Hypothetically, this is how the indicator could be used:
- Long: Z-score < -1.96 (below 95% confidence band)
- Short: Z-score > +1.96 (above 95% confidence band)
- Take profit when price returns to center line (Z ≈ 0)
Input Parameters
Sample Size (n) - Default: 100
Lookback Period (m) - Default: 100
You can also create alerts based on the indicator.
Final notes:
- The indicator uses logarithmic returns for better statistical properties
- Converts statistical bands back to price space for practical use
- Adaptive volatility: Bands automatically widen in high volatility, narrow in low volatility
- No repainting: yay! All calculations use historical data only
Feedback is more than welcome!
Henri

First Passage Time - Distribution AnalysisThe First Passage Time (FPT) Distribution Analysis indicator is a sophisticated probabilistic tool that answers one of the most critical questions in trading: "How long will it take for price to reach my target, and what are the odds of getting there first?"
Unlike traditional technical indicators that focus on what might happen, this indicator tells you when it's likely to happen.
Mathematical Foundation: First Passage Time Theory
What is First Passage Time?
First Passage Time (FPT) is a concept in stochastic processes that measures the time it takes for a random process to reach a specific threshold for the first time. Originally developed in physics and mathematics, FPT has applications in:
Quantitative Finance: Option pricing, risk management, and algorithmic trading
Neuroscience: Modeling neural firing patterns
Biology: Population dynamics and disease spread
Engineering: Reliability analysis and failure prediction
The Mathematics Behind It
This indicator uses Geometric Brownian Motion (GBM), the same stochastic model used in the Black-Scholes option pricing formula:
dS = μS dt + σS dW
Where:
S = Asset price
μ = Drift (trend component)
σ = Volatility (uncertainty component)
dW = Wiener process (random walk)
Through Monte Carlo simulation, the indicator runs 1,000+ price path simulations to statistically determine:
When each threshold (+X% or -X%) is likely to be hit
Which threshold is hit first (directional bias)
How often each scenario occurs (probability distribution)
🎯 How This Indicator Works
Core Algorithm Workflow:
Calculate Historical Statistics
Measures recent price volatility (standard deviation of log returns)
Calculates drift (average directional movement)
Annualizes these metrics for meaningful comparison
Run Monte Carlo Simulations
Generates 1,000+ random price paths based on historical behavior
Tracks when each path hits the upside (+X%) or downside (-X%) threshold
Records which threshold was hit first in each simulation
Aggregate Statistical Results
Calculates percentile distributions (10th, 25th, 50th, 75th, 90th)
Computes "first hit" probabilities (upside vs downside)
Determines average and median time-to-target
Visual Representation
Displays thresholds as horizontal lines
Shows gradient risk zones (purple-to-blue)
Provides comprehensive statistics table
📈 Use Cases
1. Options Trading
Selling Options: Determine if your strike price is likely to be hit before expiration
Buying Options: Estimate probability of reaching profit targets within your time window
Time Decay Management: Compare expected time-to-target vs theta decay
Example: You're considering selling a 30-day call option 5% out of the money. The indicator shows there's a 72% chance price hits +5% within 12 days. This tells you the trade has high assignment risk.
2. Swing Trading
Entry Timing: Wait for higher probability setups when directional bias is strong
Target Setting: Use median time-to-target to set realistic profit expectations
Stop Loss Placement: Understand probability of hitting your stop before target
Example: The indicator shows 85% upside probability with median time of 3.2 days. You can confidently enter long positions with appropriate position sizing.
3. Risk Management
Position Sizing: Larger positions when probability heavily favors one direction
Portfolio Allocation: Reduce exposure when probabilities are near 50/50 (high uncertainty)
Hedge Timing: Know when to add protective positions based on downside probability
Example: Indicator shows 55% upside vs 45% downside—nearly neutral. This signals high uncertainty, suggesting reduced position size or wait for better setup.
4. Market Regime Detection
Trending Markets: High directional bias (70%+ one direction)
Range-bound Markets: Balanced probabilities (45-55% both directions)
Volatility Regimes: Compare actual vs theoretical minimum time
Example: Consistent 90%+ bullish bias across multiple timeframes confirms strong uptrend—stay long and avoid counter-trend trades.
First Hit Rate (Most Important!)
Shows which threshold is likely to be hit FIRST:
Upside %: Probability of hitting upside target before downside
Downside %: Probability of hitting downside target before upside
These always sum to 100%
⚠️ Warning: If you see "Low Hit Rate" warning, increase this parameter!
Advanced Parameters
Drift Mode
Allows you to explore different scenarios:
Historical: Uses actual recent trend (default—most realistic)
Zero (Neutral): Assumes no trend, only volatility (symmetric probabilities)
50% Reduced: Dampens trend effect (conservative scenario)
Use Case: Switch to "Zero (Neutral)" to see what happens in a pure volatility environment, useful for range-bound markets.
Distribution Type
Percentile: Shows 10%, 25%, 50%, 75%, 90% levels (recommended for most users)
Sigma: Shows standard deviation levels (1σ, 2σ)—useful for statistical analysis
⚠️ Important Limitations & Best Practices
Limitations
Assumes GBM: Real markets have fat tails, jumps, and regime changes not captured by GBM
Historical Parameters: Uses recent volatility/drift—may not predict regime shifts
No Fundamental Events: Cannot predict earnings, news, or macro shocks
Computational: Runs only on last bar—doesn't give historical signals
Remember: Probabilities are not certainties. Use this indicator as part of a comprehensive trading plan with proper risk management.
Created by: Henrique Centieiro. feedback is more than welcome!

Distribution DaysThis script marks Distribution Days according to the Investors Business Daily method -- a significant decline on higher volume:
(1.) Price has declined > 0.2% from the prior day's close
(2.) Trading volume is greater than the prior day's volume

Volume-Weighted Money Flow [sgbpulse]Overview
The VWMF indicator is an advanced technical analysis tool that combines and summarizes five leading momentum and volume indicators (OBV, PVT, A/D, CMF, MFI) into one clear oscillator. The indicator helps to provide a clear picture of market sentiment by measuring the pressure from buyers and sellers. Unlike single indicators, VWMF provides a comprehensive view of market money flow by weighting existing indicators and presenting them in a uniform and understandable format.
Indicator Components
VWMF combines the following indicators, each normalized to a range of 0 to 100 before being weighted:
On-Balance Volume (OBV): A cumulative indicator that measures positive and negative volume flow.
Price-Volume Trend (PVT): Similar to OBV, but incorporates relative price change for a more precise measure.
Accumulation/Distribution Line (A/D): Used to identify whether an asset is being bought (accumulated) or sold (distributed).
Chaikin Money Flow (CMF): Measures the money flow over a period based on the close price's position relative to the candle's range.
Money Flow Index (MFI): A momentum oscillator that combines price and volume to measure buying and selling pressure.
Understanding the Normalized Oscillators
The indicator combines the five different momentum indicators by normalizing each one to a uniform range of 0 to 100 .
Why is Normalization Important?
Indicators like OBV, PVT, and the A/D Line are cumulative indicators whose values can become very large. To assess their trend, we use a Moving Average as a dynamic reference line . The Moving Average allows us to understand whether the indicator is currently trending up or down relative to its average behavior over time.
How Does Normalization Work?
Our normalization fully preserves the original trend of each indicator.
For Cumulative Indicators (OBV, PVT, A/D): We calculate the difference between the current indicator value and its Moving Average. This difference is then passed to the normalization process.
- If the indicator is above its Moving Average, the difference will be positive, and the normalized value will be above 50.
- If the indicator is below its Moving Average, the difference will be negative, and the normalized value will be below 50.
Handling Extreme Values: To overcome the issue of extreme values in indicators like OBV, PVT, and the A/D Line , the function calculates the highest absolute value over the selected period. This value is used to prevent sharp spikes or drops in a single indicator from compromising the accuracy of the normalization over time. It's a sophisticated method that ensures the oscillators remain relevant and accurate.
For Bounded Indicators (CMF, MFI): These indicators already operate within a known range (for example, CMF is between -1 and 1, and MFI is between 0 and 100), so they are normalized directly without an additional reference line.
Reference Line Settings:
Moving Average Type: Allows the user to choose between a Simple Moving Average (SMA) and an Exponential Moving Average (EMA).
Volume Flow MA Length: Allows the user to set the lookback period for the Moving Average, which affects the indicator's sensitivity.
The 50 line serves as the new "center line." This ensures that, even after normalization, the determination of whether a specific indicator supports a bullish or bearish trend remains clear.
Settings and Visual Tools
The indicator offers several customization options to provide a rich analysis experience:
VWMF Oscillator (Blue Line): Represents the weighted average of all five indicators. Values above 50 indicate bullish momentum, and values below 50 indicate bearish momentum.
Strength Metrics (Bullish/Bearish Strength %): Two metrics that appear on the status line, showing the percentage of indicators supporting the current trend. They range from 0% to 100%, providing a quick view of the strength of the consensus.
Dynamic Background Colors: The background color of the chart automatically changes to bullish (a blue shade by default) or bearish (a default brown-gray shade) based on the trend. The transparency of the color shows the consensus strength—the more opaque the background, the more indicators support the trend.
Advanced Settings:
- Background Color Logic: Allows the user to choose the trigger for the background color: Weighted Value (based on the combined oscillator) or Strength (based on the majority of individual indicators).
- Weights: Provides full control over the weight of each of the five indicators in the final oscillator.
Using the Data Window
TradingView provides a useful Data Window that allows you to see the exact numerical values of each normalized oscillator separately, in addition to the trend strength data.
You can use this window to:
Get more detailed information on each indicator: Viewing the precise numerical data of each of the five indicators can help in making trading decisions.
Calibrate weights: If you want to manually adjust the indicator weights (in the settings menu), you can do so while tracking the impact of each indicator on the weighted oscillator in the Data Window.
The indicator's default setting is an equal weight of 20% for each of the five indicators.
Alert Conditions
The indicator comes with a variety of built-in alerts that can be configured through the TradingView alerts menu:
VWMF Cross Above 50: An alert when the VWMF oscillator crosses above the 50 line, indicating a potential bullish momentum shift.
VWMF Cross Below 50: An alert when the VWMF oscillator crosses below the 50 line, indicating a potential bearish momentum shift.
Bullish Strength: High But Not Absolute Consensus: An alert when the bullish trend strength reaches 60% or more but is less than 100%, indicating a high but not absolute consensus.
Bullish Strength at 100%: An alert when all five indicators (MFI, OBV, PVT, A/D, CMF) show bullish strength, indicating a full and absolute consensus.
Bearish Strength: High But Not Absolute Consensus: An alert when the bearish trend strength reaches 60% or more but is less than 100%, indicating a high but not absolute consensus.
Bearish Strength at 100%: An alert when all five indicators (MFI, OBV, PVT, A/D, CMF) show bearish strength, indicating a full and absolute consensus.
Summary
The VWMF indicator is a powerful, all-in-one tool for analyzing market momentum, money flow, and sentiment. By combining and normalizing five different indicators into a single oscillator, it offers a holistic and accurate view of the market's underlying trend. Its dynamic visual features and customizable settings, including the ability to adjust indicator weights, provide a flexible experience for both novice and experienced traders. The built-in alerts for momentum shifts and trend consensus make it an effective tool for spotting trading opportunities with confidence. In essence, VWMF distills complex market data into clear, actionable signals.
Important Note: Trading Risk
This indicator is intended for educational and informational purposes only and does not constitute investment advice or a recommendation for trading in any form whatsoever.
Trading in financial markets involves significant risk of capital loss. It is important to remember that past performance is not indicative of future results. All trading decisions are your sole responsibility. Never trade with money you cannot afford to lose.

Risk Distribution HistogramStatistical risk visualization and analysis tool for any ticker 📊
The Risk Distribution Histogram visualizes the statistical distribution of different risk metrics for any financial instrument. It converts risk data into histograms with quartile-based color coding, so that traders can understand their risk, tail-risks, exposure patterns and make data-driven decisions based on empirical evidence rather than assumptions.
The indicator supports multiple risk calculation methods, each designed for different aspects of market analysis, from general volatility assessment to tail risk analysis.
Risk Measurement Methods
Standard Deviation
Captures raw daily price volatility by measuring the dispersion of price movements. Ideal for understanding overall market conditions and timing volatility-based strategies.
Use case: Options trading and volatility analysis.
Average True Range (ATR)
Measures true range as a percentage of price, accounting for gaps and limit moves. Valuable for position sizing across different price levels.
Use case: Position sizing and stop-loss placement.
The chart above illustrates how ATR statistical distribution can be used by looking at the ATR % of price distribution. For example, 90% of the movements are below 5%.
Downside Deviation
Only considers negative price movements, making it ideal for checking downside risk and capital protection rather than capturing upside volatility.
Use case: Downside protection strategies and stop losses.
Drawdown Analysis
Tracks peak-to-trough declines, providing insight into maximum loss potential during different market conditions.
Use case: Risk management and capital preservation.
The chart above illustrates tale risk for the asset (TQQQ), showing that it is possible to have drawdowns higher than 20%.
Entropy-Based Risk (EVaR)
Uses information theory to quantify market uncertainty. Higher entropy values indicate more unpredictable price action, valuable for detecting regime changes.
Use case: Advanced risk modeling and tail-risk.
VIX Histogram
Incorporates the market's fear index directly into analysis, showing how current volatility expectations compare to historical patterns. The CAPITALCOM:VIX histogram is independent from the ticker on the chart.
Use case: Volatility trading and market timing.
Visual Features
The histogram uses quartile-based color coding that immediately shows where current risk levels stand relative to historical patterns:
Green (Q1): Low Risk (0-25th percentile)
Yellow (Q2): Medium-Low Risk (25-50th percentile)
Orange (Q3): Medium-High Risk (50-75th percentile)
Red (Q4): High Risk (75-100th percentile)
The data table provides detailed statistics, including:
Count Distribution: Historical observations in each bin
PMF: Percentage probability for each risk level
CDF: Cumulative probability up to each level
Current Risk Marker: Shows your current position in the distribution
Trading Applications
When current risk falls into upper quartiles (Q3 or Q4), it signals conditions are riskier than 50-75% of historical observations. This guides position sizing and portfolio adjustments.
Key applications:
Position sizing based on empirical risk distributions
Monitoring risk regime changes over time
Comparing risk patterns across timeframes
Risk distribution analysis improves trade timing by identifying when market conditions favor specific strategies.
Enter positions during low-risk periods (Q1)
Reduce exposure in high-risk periods (Q4)
Use percentile rankings for dynamic stop-loss placement
Time volatility strategies using distribution patterns
Detect regime shifts through distribution changes
Compare current conditions to historical benchmarks
Identify outlier events in tail regions
Validate quantitative models with empirical data
Configuration Options
Data Collection
Lookback Period: Control amount of historical data analyzed
Date Range Filtering: Focus on specific market periods
Sample Size Validation: Automatic reliability warnings
Histogram Customization
Bin Count: 10-50 bins for different detail levels
Auto/Manual Bin Width: Optimize for your data range
Visual Preferences: Custom colors and font sizes
Implementation Guide
Start with Standard Deviation on daily charts for the most intuitive introduction to distribution-based risk analysis.
Method Selection: Begin with Standard Deviation
Setup: Use daily charts with 20-30 bins
Interpretation: Focus on quartile transitions as signals
Monitoring: Track distribution changes for regime detection
The tool provides comprehensive statistics including mean, standard deviation, quartiles, and current position metrics like Z-score and percentile ranking.
Enjoy, and please let me know your feedback! 😊🥂

Chaikin Money Flow (CMF) [ParadoxAlgo]OVERVIEW
This indicator implements the Chaikin Money Flow oscillator as an overlay on the price chart, designed to help traders identify institutional money flow patterns. The Chaikin Money Flow combines price and volume data to measure the flow of money into and out of a security, making it particularly useful for detecting accumulation and distribution phases.
WHAT IS CHAIKIN MONEY FLOW?
Chaikin Money Flow was developed by Marc Chaikin and measures the amount of Money Flow Volume over a specific period. The indicator oscillates between +1 and -1, where:
Positive values indicate money flowing into the security (accumulation)
Negative values indicate money flowing out of the security (distribution)
Values near zero suggest equilibrium between buying and selling pressure
CALCULATION METHOD
Money Flow Multiplier = ((Close - Low) - (High - Close)) / (High - Low)
Money Flow Volume = Money Flow Multiplier × Volume
CMF = Sum of Money Flow Volume over N periods / Sum of Volume over N periods
KEY FEATURES
Big Money Detection:
Identifies significant institutional activity when CMF exceeds user-defined thresholds
Requires volume confirmation (volume above average) to validate signals
Uses battery icon (🔋) for institutional buying and lightning icon (⚡) for institutional selling
Visual Elements:
Background coloring based on money flow direction
Support and resistance levels calculated using Average True Range
Real-time dashboard showing current CMF value, volume strength, and signal status
Customizable Parameters:
CMF Period: Calculation period for the money flow (default: 20)
Signal Smoothing: EMA smoothing applied to reduce noise (default: 5)
Big Money Threshold: CMF level required to trigger institutional signals (default: 0.15)
Volume Threshold: Volume multiplier required for signal confirmation (default: 1.5x)
INTERPRETATION
Signal Types:
🔋 (Battery): Indicates strong institutional buying when CMF > threshold with high volume
⚡ (Lightning): Indicates strong institutional selling when CMF < -threshold with high volume
Background color: Green tint for positive money flow, red tint for negative money flow
Dashboard Information:
CMF Value: Current Chaikin Money Flow reading
Volume: Current volume as a multiple of 20-period average
Big Money: Status of institutional activity (BUYING/SELLING/QUIET)
Signal: Strength assessment (STRONG/MEDIUM/WEAK)
TRADING APPLICATIONS
Trend Confirmation: Use CMF direction to confirm price trends
Divergence Analysis: Look for divergences between price and money flow
Volume Validation: Confirm breakouts with corresponding money flow
Accumulation/Distribution: Identify phases of institutional activity
PARAMETER RECOMMENDATIONS
Day Trading: CMF Period 14-21, higher sensitivity settings
Swing Trading: CMF Period 20-30, moderate sensitivity
Position Trading: CMF Period 30-50, lower sensitivity for major trends
ALERTS
Optional alert system notifies users when:
Big money buying is detected (CMF above threshold with volume confirmation)
Big money selling is detected (CMF below negative threshold with volume confirmation)
LIMITATIONS
May generate false signals in low-volume conditions
Best used in conjunction with other technical analysis tools
Effectiveness varies across different market conditions and timeframes
EDUCATIONAL PURPOSE
This open-source indicator is provided for educational purposes to help traders understand money flow analysis. It demonstrates the practical application of the Chaikin Money Flow concept with visual enhancements for easier interpretation.
TECHNICAL SPECIFICATIONS
Overlay indicator (displays on price chart)
No repainting - all calculations are based on closed bar data
Suitable for all timeframes and asset classes
Minimal resource usage for optimal performance
DISCLAIMER
This indicator is for educational and informational purposes only. Past performance does not guarantee future results. Always conduct your own analysis and consider risk management before making trading decisions.

Smarter Money Flow Divergence Detector [PhenLabs]📊 Smarter Money Flow Divergence Detector
Version: PineScript™ v6
📌 Description
SMFD was developed to help give you guys a better ability to “read” what is going on behind the scenes without directly having access to that level of data. SMFD is an enhanced divergence detection indicator that identifies money flow patterns from advanced volume analysis and price action correspondence. The detection portion of this indicator combines intelligent money flow calculations with multi timeframe volume analysis to help you see hidden accumulation and distribution phases before major price movements occur.
The indicator measures institutional trading activity by looking at volume surges, price volume dynamics, and the factors of momentum to construct an overall picture of market sentiment. It’s built to assist traders in identifying high probability entries by identifying if smart money is positioning against price action.
🚀 Points of Innovation
● Advanced Smart Money Flow algorithm with volume spike detection and large trade weighting
● Multi timeframe volume analysis for enhanced institutional activity detection
● Dynamic overbought/oversold zones that adapt to current market conditions
● Enhanced divergence detection with pivot confirmation and strength validation
● Color themes with customizable visual styling options
● Real time institutional bias tracking through accumulation/distribution analysis
🔧 Core Components
● Smart Money Flow Calculation: Combines price momentum, volume expansion, and VWAP analysis
● Institutional Bias Oscillator: Tracks accumulation/distribution patterns with volume pressure analysis
● Enhanced Divergence Engine: Detects bullish/bearish divergences with multiple confirmation factors
● Dynamic Zone Detection: Automatically adjusts overbought/oversold levels based on market volatility
● Volume Pressure Analysis: Measures buying vs selling pressure over configurable periods
● Multi factor Signal System: Generates entries with trend alignment and strength validation
🔥 Key Features
● Smart Money Flow Period: Configurable calculation period for institutional activity detection
● Volume Spike Threshold: Adjustable multiplier for detecting unusual institutional volume
● Large Trade Weight: Emphasis factor for high volume periods in flow calculations
● Pivot Detection: Customizable lookback period for accurate divergence identification
● Signal Sensitivity: Three tier system (Conservative/Medium/Aggressive) for signal generation
● Themes: Four color schemes optimized for different chart backgrounds
🎨 Visualization
● Main Oscillator: Line, Area, or Histogram display styles with dynamic color coding
● Institutional Bias Line: Real time tracking of accumulation/distribution phases
● Dynamic Zones: Adaptive overbought/oversold boundaries with gradient fills
● Divergence Lines: Automatic drawing of bullish/bearish divergence connections
● Entry Signals: Clear BUY/SELL labels with signal strength indicators
● Information Panel: Real time statistics and status updates in customizable positions
📖 Usage Guidelines
Algorithm Settings
● Smart Money Flow Period
○ Default: 20
○ Range: 5-100
○ Description: Controls the calculation period for institutional flow analysis.
Higher values provide smoother signals but reduce responsiveness to recent activity
● Volume Spike Threshold
○ Default: 1.8
○ Range: 1.0-5.0
○ Description: Multiplier for detecting unusual volume activity indicating institutional participation. Higher values require more extreme volume for detection
● Large Trade Weight
○ Default: 2.5
○ Range: 1.5-5.0
○ Description: Weight applied to high volume periods in smart money calculations. Increases emphasis on institutional sized transactions
Divergence Detection
● Pivot Detection Period
○ Default: 12
○ Range: 5-50
○ Description: Bars to analyze for pivot high/low identification.
Affects divergence accuracy and signal frequency
● Minimum Divergence Strength
○ Default: 0.25
○ Range: 0.1-1.0
○ Description: Required price change percentage for valid divergence patterns.
Higher values filter out weaker signals
✅ Best Use Cases
● Trading with intraday to daily timeframes for institutional position identification
● Confirming trend reversals when divergences align with support/resistance levels
● Entry timing in trending markets when institutional bias supports the direction
● Risk management by avoiding trades against strong institutional positioning
● Multi timeframe analysis combining short term signals with longer term bias
⚠️ Limitations
● Requires sufficient volume for accurate institutional detection in low volume markets
● Divergence signals may have false positives during highly volatile news events
● Best performance on liquid markets with consistent institutional participation
● Lagging nature of volume based calculations may delay signal generation
● Effectiveness reduced during low participation holiday periods
💡 What Makes This Unique
● Multi Factor Analysis: Combines volume, price, and momentum for comprehensive institutional detection
● Adaptive Zones: Dynamic overbought/oversold levels that adjust to market conditions
● Volume Intelligence: Advanced algorithms identify institutional sized transactions
● Professional Visualization: Multiple display styles with customizable themes
● Confirmation System: Multiple validation layers reduce false signal generation
🔬 How It Works
1. Volume Analysis Phase:
● Analyzes current volume against historical averages to identify institutional activity
● Applies multi timeframe analysis for enhanced detection accuracy
● Calculates volume pressure through buying vs selling momentum
2. Smart Money Flow Calculation:
● Combines typical price with volume weighted analysis
● Applies institutional trade weighting for high volume periods
● Generates directional flow based on price momentum and volume expansion
3. Divergence Detection Process:
● Identifies pivot highs/lows in both price and indicator values
● Validates divergence strength against minimum threshold requirements
● Confirms signals through multiple technical factors before generation
💡 Note: This indicator works best when combined with proper risk management and position sizing. The institutional bias component helps identify market sentiment shifts, while divergence signals provide specific entry opportunities. For optimal results, use on liquid markets with consistent institutional participation and combine with additional technical analysis methods.

MVRV Ratio [Alpha Extract]The MVRV Ratio Indicator provides valuable insights into Bitcoin market cycles by tracking the relationship between market value and realized value. This powerful on-chain metric helps traders identify potential market tops and bottoms, offering clear buy and sell signals based on historical patterns of Bitcoin valuation.
🔶 CALCULATION The indicator processes MVRV ratio data through several analytical methods:
Raw MVRV Data: Collects MVRV data directly from INTOTHEBLOCK for Bitcoin
Optional Smoothing: Applies simple moving average (SMA) to reduce noise
Status Classification: Categorizes market conditions into four distinct states
Signal Generation: Produces trading signals based on MVRV thresholds
Price Estimation: Calculates estimated realized price (Current price / MVRV ratio)
Historical Context: Compares current values to historical extremes
Formula:
MVRV Ratio = Market Value / Realized Value
Smoothed MVRV = SMA(MVRV Ratio, Smoothing Length)
Estimated Realized Price = Current Price / MVRV Ratio
Distance to Top = ((3.5 / MVRV Ratio) - 1) * 100
Distance to Bottom = ((MVRV Ratio / 0.8) - 1) * 100
🔶 DETAILS Visual Features:
MVRV Plot: Color-coded line showing current MVRV value (red for overvalued, orange for moderately overvalued, blue for fair value, teal for undervalued)
Reference Levels: Horizontal lines indicating key MVRV thresholds (3.5, 2.5, 1.0, 0.8)
Zone Highlighting: Background color changes to highlight extreme market conditions (red for potentially overvalued, blue for potentially undervalued)
Information Table: Comprehensive dashboard showing current MVRV value, market status, trading signal, price information, and historical context
Interpretation:
MVRV ≥ 3.5: Potential market top, strong sell signal
MVRV ≥ 2.5: Overvalued market, consider selling
MVRV 1.5-2.5: Neutral market conditions
MVRV 1.0-1.5: Fair value, consider buying
MVRV < 1.0: Potential market bottom, strong buy signal
🔶 EXAMPLES
Market Top Identification: When MVRV ratio exceeds 3.5, the indicator signals potential market tops, highlighting periods where Bitcoin may be significantly overvalued.
Example: During bull market peaks, MVRV exceeding 3.5 has historically preceded major corrections, helping traders time their exits.
Bottom Detection: MVRV values below 1.0, especially approaching 0.8, have historically marked excellent buying opportunities.
Example: During bear market bottoms, MVRV falling below 1.0 has identified the most profitable entry points for long-term Bitcoin accumulation.
Tracking Market Cycles: The indicator provides a clear visualization of Bitcoin's market cycles from undervalued to overvalued states.
Example: Following the progression of MVRV from below 1.0 through fair value and eventually to overvalued territory helps traders position themselves appropriately throughout Bitcoin's market cycle.
Realized Price Support: The estimated realized price often acts as a significant
support/resistance level during market transitions.
Example: During corrections, price often finds support near the realized price level calculated by the indicator, providing potential entry points.
🔶 SETTINGS
Customization Options:
Smoothing: Toggle smoothing option and adjust smoothing length (1-50)
Table Display: Show/hide the information table
Table Position: Choose between top right, top left, bottom right, or bottom left positions
Visual Elements: All plots, lines, and background highlights can be customized for color and style
The MVRV Ratio Indicator provides traders with a powerful on-chain metric to identify potential market tops and bottoms in Bitcoin. By tracking the relationship between market value and realized value, this indicator helps identify periods of overvaluation and undervaluation, offering clear buy and sell signals based on historical patterns. The comprehensive information table delivers valuable context about current market conditions, helping traders make more informed decisions about market positioning throughout Bitcoin's cyclical patterns.

Statistical Trailing Stop [LuxAlgo]The Statistical Trailing Stop tool offers traders a way to lock in profits in trending markets with four statistical levels based on the log-normal distribution of volatility.
The indicator also features a dashboard with statistics of all detected signals.
🔶 USAGE
The tool works out of the box, traders can adjust the data used with two parameters: data & distribution length.
By default, the tool takes volatility measures of groups of 10 candles, and statistical measures of the last 100 of these groups then traders can adjust the base level to use as trailing, the larger the level, the more resistant the tool will be to moves against the trend.
🔹 Base Levels
Traders can choose up to 4 different levels of trailing, all based on the statistical distribution of volatility.
As we can see in the chart above, each higher level is more resistant to market movements, so level 0 is the most reactive and level 3 the least.
It is up to the trader to determine the best level for each underlying, time frame and market conditions.
🔹 Dashboard
The tool provides a dashboard with the statistics of all trades, making it very easy to assess the performance of the parameters used for any given market.
As we can see on the chart, all Daily BTC signals with default parameters but different base levels, level 2 is the best performing of all four, giving a positive expectation of $2435 per trade, taking into account all long and short trades.
Of note are the long trades with a win rate of 76.47% and a risk-to-reward of 3.34, giving a positive expectation of $4839 per trade, with winners having an average duration of 210 days and losers 32 days.
This, compared to short trades with negative expectation, speaks to the uptrend bias of this particular market.
🔶 SETTINGS
Data Length: Select how many bars to use per data point
Distribution Length: Select how many data points the distribution will have
Base Level: Choose between 4 different trailing levels
🔹 Dashboard
Show Statistics: Enable/disable dashboard
Position: Select dashboard position
Size: Select dashboard size

OBV & AD Oscillators with Dual Smoothing OptionsOn Balance Volume and Accumulation/Distribution
Overlaid into 1 and then some,
Now it is an oscillator!
3 customizable moving average types
- Ehlers Deviation Scaled Moving Average
- Volatility Dynamic Moving Average
- Simple Moving Average
Each with customizable periods
And with the ability to overlay a second set too
Default Settings have a longer period MA of 377 using Ehlers DSMA to better capture the standard view of OBV and A/D.
An extra overlay of a shorter period using a Volatility DMA uses Average True Range with its own custom settings, seeks to act more as an RSI

Elastic Volume-Weighted Student-T TensionOverview
The Elastic Volume-Weighted Student-T Tension Bands indicator dynamically adapts to market conditions using an advanced statistical model based on the Student-T distribution. Unlike traditional Bollinger Bands or Keltner Channels, this indicator leverages elastic volume-weighted averaging to compute real-time dispersion and location parameters, making it highly responsive to volatility changes while maintaining robustness against price fluctuations.
This methodology is inspired by incremental calculation techniques for weighted mean and variance, as outlined in the paper by Tony Finch:
📄 "Incremental Calculation of Weighted Mean and Variance" .
Key Features
✅ Adaptive Volatility Estimation – Uses an exponentially weighted Student-T model to dynamically adjust band width.
✅ Volume-Weighted Mean & Dispersion – Incorporates real-time volume weighting, ensuring a more accurate representation of market sentiment.
✅ High-Timeframe Volume Normalization – Provides an option to smooth volume impact by referencing a higher timeframe’s cumulative volume, reducing noise from high-variability bars.
✅ Customizable Tension Parameters – Configurable standard deviation multipliers (σ) allow for fine-tuned volatility sensitivity.
✅ %B-Like Oscillator for Relative Price Positioning – The main indicator is in form of a dedicated oscillator pane that normalizes price position within the sigma ranges, helping identify overbought/oversold conditions and potential momentum shifts.
✅ Robust Statistical Foundation – Utilizes kurtosis-based degree-of-freedom estimation, enhancing responsiveness across different market conditions.
How It Works
Volume-Weighted Elastic Mean (eμ) – Computes a dynamic mean price using an elastic weighted moving average approach, influenced by trade volume, if not volume detected in series, study takes true range as replacement.
Dispersion (eσ) via Student-T Distribution – Instead of assuming a fixed normal distribution, the bands adapt to heavy-tailed distributions using kurtosis-driven degrees of freedom.
Incremental Calculation of Variance – The indicator applies Tony Finch’s incremental method for computing weighted variance instead of arithmetic sum's of fixed bar window or arrays, improving efficiency and numerical stability.
Tension Calculation – There are 2 dispersion custom "zones" that are computed based on the weighted mean and dynamically adjusted standard student-t deviation.
%B-Like Oscillator Calculation – The oscillator normalizes the price within the band structure, with values between 0 and 1:
* 0.00 → Price is at the lower band (-2σ).
* 0.50 → Price is at the volume-weighted mean (eμ).
* 1.00 → Price is at the upper band (+2σ).
* Readings above 1.00 or below 0.00 suggest extreme movements or possible breakouts.
Recommended Usage
For scalping in lower timeframes, it is recommended to use the fixed α Decay Factor, it is in raw format for better control, but you can easily make a like of transformation to N-bar size window like in EMA-1 bar dividing 2 / decayFactor or like an RMA dividing 1 / decayFactor.
The HTF selector catch quite well Higher Time Frame analysis, for example using a Daily chart and using as HTF the 200-day timeframe, weekly or monthly.
Suitable for trend confirmation, breakout detection, and mean reversion plays.
The %B-like oscillator helps gauge momentum strength and detect divergences in price action if user prefer a clean chart without bands, this thanks to pineScript v6 force overlay feature.
Ideal for markets with volume-driven momentum shifts (e.g., futures, forex, crypto).
Customization Parameters
Fixed α Decay Factor – Controls the rate of volume weighting influence for an approximation EWMA approach instead of using sum of series or arrays, making the code lightweight & computing fast O(1).
HTF Volume Smoothing – Instead of a fixed denominator for computing α , a volume sum of the last 2 higher timeframe closed candles are used as denominator for our α weight factor. This is useful to review mayor trends like in daily, weekly, monthly.
Tension Multipliers (±σ) – Adjusts sensitivity to dispersion sigma parameter (volatility).
Oscillator Zone Fills – Visual cues for price positioning within the cloud range.
Posible Interpretations
As market within indicators relay on each individual edge, this are just some key ideas to glimpse how the indicator could be interpreted by the user:
📌 Price inside bands – Market is considered somehow "stable"; price is like resting from tension or "charging batteries" for volume spike moves.
📌 Price breaking outer bands – Potential breakout or extreme movement; watch for reversals or continuation from strong moves. Market is already in tension or generating it.
📌 Narrowing Bands – Decreasing volatility; expect contraction before expansion.
📌 Widening Bands – Increased volatility; prepare for high probability pull-back moves, specially to the center location of the bands (the mean) or the other side of them.
📌 Oscillator is just the interpretation of the price normalized across the Student-T distribution fitting "curve" using the location parameter, our Elastic Volume weighted mean (eμ) fixed at 0.5 value.
Final Thoughts
The Elastic Volume-Weighted Student-T Tension indicator provides a powerful, volume-sensitive alternative to traditional volatility bands. By integrating real-time volume analysis with an adaptive statistical model, incremental variance computation, in a relative price oscillator that can be overlayed in the chart as bands, it offers traders an edge in identifying momentum shifts, trend strength, and breakout potential. Think of the distribution as a relative "tension" rubber band in which price never leave so far alone.
DISCLAIMER:
The Following indicator/code IS NOT intended to be a formal investment advice or recommendation by the author, nor should be construed as such. Users will be fully responsible by their use regarding their own trading vehicles/assets.
The following indicator was made for NON LUCRATIVE ACTIVITIES and must remain as is, following TradingView's regulations. Use of indicator and their code are published for work and knowledge sharing. All access granted over it, their use, copy or re-use should mention authorship(s) and origin(s).
WARNING NOTICE!
THE INCLUDED FUNCTION MUST BE CONSIDERED FOR TESTING. The models included in the indicator have been taken from open sources on the web and some of them has been modified by the author, problems could occur at diverse data sceneries, compiler version, or any other externality.

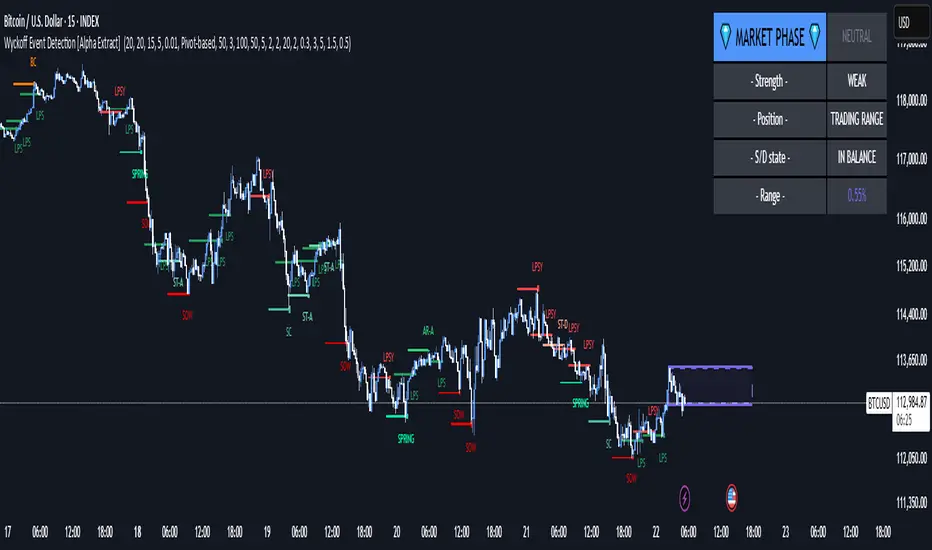
Wyckoff Event Detection [Alpha Extract]Wyckoff Event Detection
A powerful and intelligent indicator designed to detect key Wyckoff events in real time, helping traders analyze market structure and anticipate potential trend shifts. Using volume and price action, this script automatically identifies distribution and accumulation phases, providing traders with valuable insights into market behavior.
🔶 Phase-Based Detection
Utilizes a phase detection algorithm that evaluates price and volume conditions to identify accumulation (bullish) and distribution (bearish) events. This method ensures the script effectively captures major market turning points and avoids noise.
🔶 Multi-Factor Event Recognition
Incorporates multiple event conditions, including upthrusts, selling climaxes, and springs, to detect high-probability entry and exit points. Each event is filtered through customizable sensitivity settings, ensuring precise detection aligned with different trading styles.
🔶 Customizable Parameters
Fine-tune event detection with adjustable thresholds for volume, price movement, trend strength, and event spacing. These inputs allow traders to personalize the script to match their strategy and risk tolerance.
// === USER INPUTS ===
i_volLen = input.int(20, "Volume MA Length", minval=1)
i_priceLookback = input.int(20, "Price Pattern Lookback", minval=5)
i_lineLength = input.int(15, "Line Length", minval=5)
i_labelSpacing = input.int(5, "Minimum Label Spacing (bars)", minval=1, maxval=20)
❓How It Works
🔶 Event Identification
The script scans for key Wyckoff events by analyzing volume spikes, price deviations, and trend shifts within a user-defined lookback period. It categorizes events into bullish (accumulation) or bearish (distribution) structures and plots them directly on the chart.
// === EVENT DETECTION ===
volMA = ta.sma(volume, i_volLen)
highestHigh = ta.highest(high, i_priceLookback)
lowestLow = ta.lowest(low, i_priceLookback)
🔶 Automatic Filtering & Cleanup
Unconfirmed or weak signals are filtered out using customizable strength multipliers and volume thresholds. Events that do not meet the minimum conditions are discarded to keep the chart clean and informative.
🔶 Phase Strength Analysis
The script continuously tracks bullish and bearish event counts to determine whether the market is currently in an accumulation, distribution, or neutral phase. This allows traders to align their strategies accordingly.
🔶 Visual Alerts & Labels
Detects and labels key Wyckoff events directly on the chart, providing immediate insights into market conditions:
- PSY (Preliminary Supply) and UT (Upthrust) for distribution phases.
- PS (Preliminary Support) and SC (Selling Climax) for accumulation phases.
- Labels adjust dynamically to avoid chart clutter and improve readability.
🔶 Entry & Exit Optimization
By highlighting supply and demand imbalances, the script assists traders in identifying optimal entry and exit points. Wyckoff concepts such as springs and upthrusts provide clear trade signals based on market structure.
🔶 Trend Confirmation & Risk Management
Observing how price reacts to detected events helps confirm trend direction and potential reversals. Traders can place stop-loss and take-profit levels based on Wyckoff phase analysis, ensuring strategic trade execution.
🔶 Table-Based Market Analysis (Table)
A built-in table summarizes:
- Market Phase: Accumulation, Distribution, or Neutral.
- Strength of Phase: Weak, Moderate, or Strong.
- Price Positioning: Whether price is near support, resistance, or in a trading range.
- Supply/Demand State: Identifies whether the market is supply or demand dominant.
🔶 Why Choose Wyckoff Market Phases - Alpha Extract?
This indicator offers a systematic approach to understanding market mechanics through the lens of Wyckoff's time-tested principles. By providing clear and actionable insights into market phases, it empowers traders to make informed decisions, enhancing both confidence and performance in various trading environments.
Accurate Bollinger Bands mcbw_ [True Volatility Distribution]The Bollinger Bands have become a very important technical tool for discretionary and algorithmic traders alike over the last decades. It was designed to give traders an edge on the markets by setting probabilistic values to different levels of volatility. However, some of the assumptions that go into its calculations make it unusable for traders who want to get a correct understanding of the volatility that the bands are trying to be used for. Let's go through what the Bollinger Bands are said to show, how their calculations work, the problems in the calculations, and how the current indicator I am presenting today fixes these.
--> If you just want to know how the settings work then skip straight to the end or click on the little (i) symbol next to the values in the indicator settings window when its on your chart <--
--------------------------- What Are Bollinger Bands ---------------------------
The Bollinger Bands were formed in the 1980's, a time when many retail traders interacted with their symbols via physically printed charts and computer memory for personal computer memory was measured in Kb (about a factor of 1 million smaller than today). Bollinger Bands are designed to help a trader or algorithm see the likelihood of price expanding outside of its typical range, the further the lines are from the current price implies the less often they will get hit. With a hands on understanding many strategies use these levels for designated levels of breakout trades or to assist in defining price ranges.
--------------------------- How Bollinger Bands Work ---------------------------
The calculations that go into Bollinger Bands are rather simple. There is a moving average that centers the indicator and an equidistant top band and bottom band are drawn at a fixed width away. The moving average is just a typical moving average (or common variant) that tracks the price action, while the distance to the top and bottom bands is a direct function of recent price volatility. The way that the distance to the bands is calculated is inspired by formulas from statistics. The standard deviation is taken from the candles that go into the moving average and then this is multiplied by a user defined value to set the bands position, I will call this value 'the multiple'. When discussing Bollinger Bands, that trading community at large normally discusses 'the multiple' as a multiplier of the standard deviation as it applies to a normal distribution (gaußian probability). On a normal distribution the number of standard deviations away (which trades directly use as 'the multiple') you are directly corresponds to how likely/unlikely something is to happen:
1 standard deviation equals 68.3%, meaning that the price should stay inside the 1 standard deviation 68.3% of the time and be outside of it 31.7% of the time;
2 standard deviation equals 95.5%, meaning that the price should stay inside the 2 standard deviation 95.5% of the time and be outside of it 4.5% of the time;
3 standard deviation equals 99.7%, meaning that the price should stay inside the 3 standard deviation 99.7% of the time and be outside of it 0.3% of the time.
Therefore when traders set 'the multiple' to 2, they interpret this as meaning that price will not reach there 95.5% of the time.
---------------- The Problem With The Math of Bollinger Bands ----------------
In and of themselves the Bollinger Bands are a great tool, but they have become misconstrued with some incorrect sense of statistical meaning, when they should really just be taken at face value without any further interpretation or implication.
In order to explain this it is going to get a bit technical so I will give a little math background and try to simplify things. First let's review some statistics topics (distributions, percentiles, standard deviations) and then with that understanding explore the incorrect logic of how Bollinger Bands have been interpreted/employed.
---------------- Quick Stats Review ----------------
.
(If you are comfortable with statistics feel free to skip ahead to the next section)
.
-------- I: Probability distributions --------
When you have a lot of data it is helpful to see how many times different results appear in your dataset. To visualize this people use "histograms", which just shows how many times each element appears in the dataset by stacking each of the same elements on top of each other to form a graph. You may be familiar with the bell curve (also called the "normal distribution", which we will be calling it by). The normal distribution histogram looks like a big hump around zero and then drops off super quickly the further you get from it. This shape (the bell curve) is very nice because it has a lot of very nifty mathematical properties and seems to show up in nature all the time. Since it pops up in so many places, society has developed many different shortcuts related to it that speed up all kinds of calculations, including the shortcut that 1 standard deviation = 68.3%, 2 standard deviations = 95.5%, and 3 standard deviations = 99.7% (these only apply to the normal distribution). Despite how handy the normal distribution is and all the shortcuts we have for it are, and how much it shows up in the natural world, there is nothing that forces your specific dataset to look like it. In fact, your data can actually have any possible shape. As we will explore later, economic and financial datasets *rarely* follow the normal distribution.
-------- II: Percentiles --------
After you have made the histogram of your dataset you have built the "probability distribution" of your own dataset that is specific to all the data you have collected. There is a whole complicated framework for how to accurately calculate percentiles but we will dramatically simplify it for our use. The 'percentile' in our case is just the number of data points we are away from the "middle" of the data set (normally just 0). Lets say I took the difference of the daily close of a symbol for the last two weeks, green candles would be positive and red would be negative. In this example my dataset of day by day closing price difference is:
week 1:
week 2:
sorting all of these value into a single dataset I have:
I can separate the positive and negative returns and explore their distributions separately:
negative return distribution =
positive return distribution =
Taking the 25th% percentile of these would just be taking the value that is 25% towards the end of the end of these returns. Or akin the 100%th percentile would just be taking the vale that is 100% at the end of those:
negative return distribution (50%) = -5
positive return distribution (50%) = +4
negative return distribution (100%) = -10
positive return distribution (100%) = +20
Or instead of separating the positive and negative returns we can also look at all of the differences in the daily close as just pure price movement and not account for the direction, in this case we would pool all of the data together by ignoring the negative signs of the negative reruns
combined return distribution =
In this case the 50%th and 100%th percentile of the combined return distribution would be:
combined return distribution (50%) = 4
combined return distribution (100%) = 10
Sometimes taking the positive and negative distributions separately is better than pooling them into a combined distribution for some purposes. Other times the combined distribution is better.
Most financial data has very different distributions for negative returns and positive returns. This is encapsulated in sayings like "Price takes the stairs up and the elevator down".
-------- III: Standard Deviation --------
The formula for the standard deviation (refereed to here by its shorthand 'STDEV') can be intimidating, but going through each of its elements will illuminate what it does. The formula for STDEV is equal to:
square root ( (sum ) / N )
Going back the the dataset that you might have, the variables in the formula above are:
'mean' is the average of your entire dataset
'x' is just representative of a single point in your dataset (one point at a time)
'N' is the total number of things in your dataset.
Going back to the STDEV formula above we can see how each part of it works. Starting with the '(x - mean)' part. What this does is it takes every single point of the dataset and measure how far away it is from the mean of the entire dataset. Taking this value to the power of two: '(x - mean) ^ 2', means that points that are very far away from the dataset mean get 'penalized' twice as much. Points that are very close to the dataset mean are not impacted as much. In practice, this would mean that if your dataset had a bunch of values that were in a wide range but always stayed in that range, this value ('(x - mean) ^ 2') would end up being small. On the other hand, if your dataset was full of the exact same number, but had a couple outliers very far away, this would have a much larger value since the square par of '(x - mean) ^ 2' make them grow massive. Now including the sum part of 'sum ', this just adds up all the of the squared distanced from the dataset mean. Then this is divided by the number of values in the dataset ('N'), and then the square root of that value is taken.
There is nothing inherently special or definitive about the STDEV formula, it is just a tool with extremely widespread use and adoption. As we saw here, all the STDEV formula is really doing is measuring the intensity of the outliers.
--------------------------- Flaws of Bollinger Bands ---------------------------
The largest problem with Bollinger Bands is the assumption that price has a normal distribution. This is assumption is massively incorrect for many reasons that I will try to encapsulate into two points:
Price return do not follow a normal distribution, every single symbol on every single timeframe has is own unique distribution that is specific to only itself. Therefore all the tools, shortcuts, and ideas that we use for normal distributions do not apply to price returns, and since they do not apply here they should not be used. A more general approach is needed that allows each specific symbol on every specific timeframe to be treated uniquely.
The distributions of price returns on the positive and negative side are almost never the same. A more general approach is needed that allows positive and negative returns to be calculated separately.
In addition to the issues of the normal distribution assumption, the standard deviation formula (as shown above in the quick stats review) is essentially just a tame measurement of outliers (a more aggressive form of outlier measurement might be taking the differences to the power of 3 rather than 2). Despite this being a bit of a philosophical question, does the measurement of outlier intensity as defined by the STDEV formula really measure what we want to know as traders when we're experiencing volatility? Or would adjustments to that formula better reflect what we *experience* as volatility when we are actively trading? This is an open ended question that I will leave here, but I wanted to pose this question because it is a key part of what how the Bollinger Bands work that we all assume as a given.
Circling back on the normal distribution assumption, the standard deviation formula used in the calculation of the bands only encompasses the deviation of the candles that go into the moving average and have no knowledge of the historical price action. Therefore the level of the bands may not really reflect how the price action behaves over a longer period of time.
------------ Delivering Factually Accurate Data That Traders Need------------
In light of the problems identified above, this indicator fixes all of these issue and delivers statistically correct information that discretionary and algorithmic traders can use, with truly accurate probabilities. It takes the price action of the last 2,000 candles and builds a huge dataset of distributions that you can directly select your percentiles from. It also allows you to have the positive and negative distributions calculated separately, or if you would like, you can pool all of them together in a combined distribution. In addition to this, there is a wide selection of moving averages directly available in the indicator to choose from.
Hedge funds, quant shops, algo prop firms, and advanced mechanical groups all employ the true return distributions in their work. Now you have access to the same type of data with this indicator, wherein it's doing all the lifting for you.
------------------------------ Indicator Settings ------------------------------
.
---- Moving average ----
Select the type of moving average you would like and its length
---- Bands ----
The percentiles that you enter here will be pulled directly from the return distribution of the last 2,000 candles. With the typical Bollinger Bands, traders would select 2 standard deviations and incorrectly think that the levels it highlights are the 95.5% levels. Now, if you want the true 95.5% level, you can just enter 95.5 into the percentile value here. Each of the three available bands takes the true percentile you enter here.
---- Separate Positive & Negative Distributions----
If this box is checked the positive and negative distributions are treated indecently, completely separate from each other. You will see that the width of the top and bottom bands will be different for each of the percentiles you enter.
If this box is unchecked then all the negative and positive distributions are pooled together. You will notice that the width of the top and bottom bands will be the exact same.
---- Distribution Size ----
This is the number of candles that the price return is calculated over. EG: to collect the price return over the last 33 candles, the difference of price from now to 33 candles ago is calculated for the last 2,000 candles, to build a return distribution of 2000 points of price differences over 33 candles.
NEGATIVE NUMBERS(<0) == exact number of candles to include;
EG: setting this value to -20 will always collect volatility distributions of 20 candles
POSITIVE NUMBERS(>0) == number of candles to include as a multiple of the Moving Average Length value set above;
EG: if the Moving Average Length value is set to 22, setting this value to 2 will use the last 22*2 = 44 candles for the collection of volatility distributions
MORE candles being include will generally make the bands WIDER and their size will change SLOWER over time.
I wish you focus, dedication, and earnest success on your journey.
Happy trading :)

Edufx AMD~Accumulation, Manipulation, DistributionEdufx AMD Indicator
This indicator visualizes the market cycles using distinct phases: Accumulation, Manipulation, Distribution, and Reversal. It is designed to assist traders in identifying potential entry points and understanding price behavior during these phases.
Key Features:
1. Phases and Logic:
-Accumulation Phase: Highlights the price range where market accumulation occurs.
-Manipulation Phase:
- If the price sweeps below the accumulation low, it signals a potential "Buy Zone."
- If the price sweeps above the accumulation high, it signals a potential "Sell Zone."
-Distribution Phase: Highlights where price is expected to expand and establish trends.
-Reversal Phase: Marks areas where the price may either continue or reverse.
2. Weekly and Daily Cycles:
- Toggle the visibility of Weekly Cycles and Daily Cycles independently through the settings.
- These cycles are predefined with precise timings for each phase, based on your selected on UTC-5 timezone.
3. Customizable Appearance:
- Adjust the colors for each phase directly in the settings to suit your preferences.
- The indicator uses semi-transparent boxes to represent the phases, allowing easy visualization without obstructing the chart.
4. Static Boxes:
- Boxes representing the phases are drawn only once for the visible chart range and do not dynamically delete, ensuring important consistent reference points.

XAMD/AMDX ICT 01 [TradingFinder] SMC Quarterly Theory Cycles🔵 Introduction
The XAMD/AMDX strategy, combined with the Quarterly Theory, forms the foundation of a powerful market structure analysis. This indicator builds upon the principles of the Power of 3 strategy introduced by ICT, enhancing its application by incorporating an additional phase.
By extending the logic of Power of 3, the XAMD/AMDX tool provides a more detailed and comprehensive view of daily market behavior, offering traders greater precision in identifying key movements and opportunities
This approach divides the trading day into four distinct phases : Accumulation (19:00 - 01:00 EST), Manipulation (01:00 - 07:00 EST), Distribution (07:00 - 13:00 EST), and Continuation or Reversal (13:00 - 19:00 EST), collectively known as AMDX.
Each phase reflects a specific market behavior, providing a structured lens to interpret price action. Building on the fractal nature of time in financial markets, the Quarterly Theory introduces the Four Quarters Method, where a currency pair’s price range is divided into quarters.
These divisions, known as quarter points, highlight critical levels for analyzing and predicting market dynamics. Together, these principles allow traders to align their strategies with institutional trading patterns, offering deeper insights into market trends
🔵 How to Use
The AMDX framework provides a structured approach to understanding market behavior throughout the trading day. Each phase has its own characteristics and trading opportunities, allowing traders to align their strategies effectively. To get the most out of this tool, understanding the dynamics of each phase is essential.
🟣 Accumulation
During the Accumulation phase (19:00 - 01:00 EST), the market is typically quiet, with price movements confined to a narrow range. This phase is where institutional players accumulate their positions, setting the stage for future price movements.
Traders should use this time to study price patterns and prepare for the next phases. It’s a great opportunity to mark key support and resistance zones and set alerts for potential breakouts, as the low volatility makes immediate trading less attractive.
🟣 Manipulation
The Manipulation phase (01:00 - 07:00 EST) is often marked by sharp and deceptive price movements. Institutions create false breakouts to trigger stop-losses and trap retail traders into the wrong direction. Traders should remain cautious during this phase, focusing on identifying the areas of liquidity where these traps occur.
Watching for price reversals after these false moves can provide excellent entry opportunities, but patience and confirmation are crucial to avoid getting caught in the manipulation.
🟣 Distribution
The Distribution phase (07:00 - 13:00 EST) is where the day’s dominant trend typically emerges. Institutions execute large trades, resulting in significant price movements. This phase is ideal for trading with the trend, as the market provides clearer directional signals.
Traders should focus on identifying breakouts or strong momentum in the direction of the trend established during this period. This phase is also where traders can capitalize on setups identified earlier, aligning their entries with the market’s broader sentiment.
🟣 Continuation or Reversal
Finally, the Continuation or Reversal phase (13:00 - 19:00 EST) offers a critical juncture to assess the market’s direction. This phase can either reinforce the established trend or signal a reversal as institutions adjust their positions.
Traders should observe price behavior closely during this time, looking for patterns that confirm whether the trend is likely to continue or reverse. This phase is particularly useful for adjusting open positions or initiating new trades based on emerging signals.
🔵 Settings
Show or Hide Phases.
Adjust the session times for each phase :
Accumulation: 19:00-01:00 EST
Manipulation: 01:00-07:00 EST
Distribution: 07:00-13:00 EST
Continuation or Reversal: 13:00-19:00 EST
Modify Visualization : Customize how the indicator looks by changing settings like colors and transparency.
🔵 Conclusion
AMDX provides traders with a practical method to analyze daily market behavior by dividing the trading day into four key phases: Accumulation, Manipulation, Distribution, and Continuation or Reversal. Each phase highlights specific market dynamics, offering insights into how institutional activity shapes price movements.
From the quiet buildup in the Accumulation phase to the decisive trends of the Distribution phase, and the critical transitions in Continuation or Reversal, this approach equips traders with the tools to anticipate movements and make informed decisions.
By recognizing the significance of each phase, traders can avoid common traps during Manipulation, capitalize on clear trends during Distribution, and adapt to changes in the final phase of the day.
The structured visualization of market phases simplifies decision-making for traders of all levels. By incorporating these principles into your trading strategy, you can enhance your ability to align with market trends, optimize entry and exit points, and achieve more consistent results in your trading journey.

Power Of 3 ICT 01 [TradingFinder] AMD ICT & SMC Accumulations🔵 Introduction
The ICT Power of 3 (PO3) strategy, developed by Michael J. Huddleston, known as the Inner Circle Trader, is a structured approach to analyzing daily market activity. This strategy divides the trading day into three distinct phases: Accumulation, Manipulation, and Distribution.
Each phase represents a unique market behavior influenced by institutional traders, offering a clear framework for retail traders to align their strategies with market movements.
Accumulation (19:00 - 01:00 EST) takes place during low-volatility hours, as institutional traders accumulate orders. Manipulation (01:00 - 07:00 EST) involves false breakouts and liquidity traps designed to mislead retail traders. Finally, Distribution (07:00 - 13:00 EST) represents the active phase where significant market movements occur as institutions distribute their positions in line with the broader trend.
This indicator is built upon the Power of 3 principles to provide traders with a practical and visual tool for identifying these key phases. By using clear color coding and precise time zones, the indicator highlights critical price levels, such as highs and lows, helping traders to better understand market dynamics and make more informed trading decisions.
Incorporating the ICT AMD setup into daily analysis enables traders to anticipate market behavior, spot high-probability trade setups, and gain deeper insights into institutional trading strategies. With its focus on time-based price action, this indicator simplifies complex market structures, offering an effective tool for traders of all levels.
🔵 How to Use
The ICT Power of 3 (PO3) indicator is designed to help traders analyze daily market movements by visually identifying the three key phases: Accumulation, Manipulation, and Distribution.
Here's how traders can effectively use the indicator :
🟣 Accumulation Phase (19:00 - 01:00 EST)
Purpose : Identify the range-bound activity where institutional players accumulate orders.
Trading Insight : Avoid placing trades during this phase, as price movements are typically limited. Instead, use this time to prepare for the potential direction of the market in the next phases.
🟣 Manipulation Phase (01:00 - 07:00 EST)
Purpose : Spot false breakouts and liquidity traps that mislead retail traders.
Trading Insight : Observe the market for price spikes beyond key support or resistance levels. These moves often reverse quickly, offering high-probability entry points in the opposite direction of the initial breakout.
🟣 Distribution Phase (07:00 - 13:00 EST)
Purpose : Detect the main price movement of the day, driven by institutional distribution.
Trading Insight : Enter trades in the direction of the trend established during this phase. Look for confirmations such as breakouts or strong directional moves that align with broader market sentiment
🔵 Settings
Show or Hide Phases :mDecide whether to display Accumulation, Manipulation, or Distribution.
Adjust the session times for each phase :
Accumulation: 1900-0100 EST
Manipulation: 0100-0700 EST
Distribution: 0700-1300 EST
Modify Visualization : Customize how the indicator looks by changing settings like colors and transparency.
🔵 Conclusion
The ICT Power of 3 (PO3) indicator is a powerful tool for traders seeking to understand and leverage market structure based on time and price dynamics. By visually highlighting the three key phases—Accumulation, Manipulation, and Distribution—this indicator simplifies the complex movements of institutional trading strategies.
With its customizable settings and clear representation of market behavior, the indicator is suitable for traders at all levels, helping them anticipate market trends and make more informed decisions.
Whether you're identifying entry points in the Accumulation phase, navigating false moves during Manipulation, or capitalizing on trends in the Distribution phase, this tool provides valuable insights to enhance your trading performance.
By integrating this indicator into your analysis, you can better align your strategies with institutional movements and improve your overall trading outcomes.

Effective Volume (ADV) v3Effective Volume (ADV) v3: Enhanced Accumulation/Distribution Analysis Tool
This indicator is an updated version of the original script by cI8DH, now upgraded to Pine Script v5 with added functionality, including the Volume Multiple feature. The tool is designed for analyzing Accumulation/Distribution (A/D) volume, referred to here as "Effective Volume," which represents the volume impact in alignment with price direction, providing insights into bullish or bearish trends through volume.
Accumulation/Distribution Volume Analysis : The script calculates and visualizes Effective Volume (ADV), helping traders assess volume strength in relation to price action. By factoring in bullish or bearish alignment, Effective Volume highlights points where volume strongly supports price movements.
Volume Multiple Feature for Volume Multiplication : The Volume Multiple setting (default value 2) allows you to set a multiplier to identify bars where Effective Volume exceeds the previous bar’s volume by a specified factor. This feature aids in pinpointing significant shifts in volume intensity, often associated with potential trend changes.
Customizable Aggregation Types : Users can choose from three volume aggregation types:
Simple - Standard SMA (Simple Moving Average) for averaging Effective Volume
Smoothed - RMA (Recursive Moving Average) for a less volatile, smoother line
Cumulative - Accumulated Effective Volume for ongoing trend analysis
Volume Divisor : The “Divide Vol by” setting (default 1 million) scales down the Effective Volume value for easier readability. This allows Effective Volume data to be aligned with the scale of the price chart.
Visualization Elements
Effective Volume Columns : The Effective Volume bar plot changes color based on volume direction:
Green Bars : Bullish Effective Volume (volume aligns with price movement upwards)
Red Bars : Bearish Effective Volume (volume aligns with price movement downwards)
Moving Average Lines :
Volume Moving Average - A gray line representing the moving average of total volume.
A/D Moving Average - A blue line showing the moving average of Accumulation/Distribution (A/D) Effective Volume.
High ADV Indicator : A “^” symbol appears on bars where the Effective Volume meets or exceeds the Volume Multiple threshold, highlighting bars with significant volume increase.
How to Use
Analyze Accumulation/Distribution Trends : Use Effective Volume to observe if bullish or bearish volume aligns with price direction, offering insights into the strength and sustainability of trends.
Identify Volume Multipliers with Volume Multiple : Adjust Volume Multiple to track when Effective Volume has notably increased, signaling potential shifts or strengthening trends.
Adjust Volume Display : Use the volume divisor setting to scale Effective Volume for clarity, especially when viewing alongside price data on higher timeframes.
With customizable parameters, this script provides a flexible, enhanced perspective on Effective Volume for traders analyzing volume-based trends and reversals.

The Vet [TFO]In collaboration with @mickey1984 , "The Vet" was created to showcase various statistical measures of price.
The first core measurement utilizes the Defining Range (DR) concept on a weekly basis. For example, we might track the session from 09:30-10:30 on Mondays to get the DR high, DR low, IDR high, and IDR low. The DR high and low are the highest high and lowest low of the session, respectively, whereas the IDR high and low would be the highest candle body level (open or close) and lowest candle body level, respectively, during this window of time.
From this data, we use the IDR range (from IDR high to IDR low) to extrapolate several, custom projections of this range from its high and low so that we can collect data on how often these levels are hit, from the close of one DR session to the open of the next one.
This information is displayed in the Range Projection Table with a few main columns of information:
- The leftmost column indicates each level that is projected from the IDR range, where (+) indicates a projection above the range high, and (-) indicates a projection below the range low
- The "First Touch" column indicates how often price has reached these levels in the past at any point until the next weekly DR session
- The "Other Side Touch" column indicates how often price has reached a given level, then reversed to hit the opposing level of the same magnitude. For example, the above chart shows that if price hit the +1 projection, ~33% of instances also hit the -1 projection before the next weekly DR session. For this reason, the probabilities will be the same for projection levels of the same but opposite magnitude (+1 would be the same as -1, +3 would be the same as -3, etc.)
- The "Next Level Touch" column provides insight into how often price reaches the next greatest projection level. For example, in the above chart, the red box in the projection table is highlighting that once price hits the -2 projection, ~86% of instances reached the -3 projection before the next weekly DR session
- The last columns, "Within ADR" and "Within AWR" show if any of the projection levels are within the current Average Daily Range, or Average Weekly Range, respectively, which can both be enabled from the Average Range section
The next section, Distributions, primarily measures and displays the average price movements from specified intraday time windows. The option to Show Distribution Boxes will overlay a box showing each respective session's average range, while adjusting itself to encapsulate the price action of that session until the average range is met/exceeded. Users can choose to display the range average by Day of Week, or the Total average from all days. Values for average ranges can either be shown as point or percent values. We can also show a table to display this information about price's average ranges for each given session, and show labels displaying the current range vs its average.
The final section, Average Range, simply offers the ability to plot the Average Daily Range (ADR) and Average Weekly Range (AWR) of a specified length. An ADR of 10 for example would take the average of the last 10 days, from high to low, while an AWR of 10 would take the average of the last 10 weeks (if the current chart provides enough data to support this). Similarly, we can also show the Average Range Table to indicate what these ADR/AWR values are, what our current range is and how it compares to those values, as well as some simple statistics on how often these levels are hit. As an example, "Hit +/- ADR: 40%/35%" in this table would indicate that price has hit the upper ADR limit 40% of the time, and the lower limit 35% of the time, for the amount of data available on the current chart.
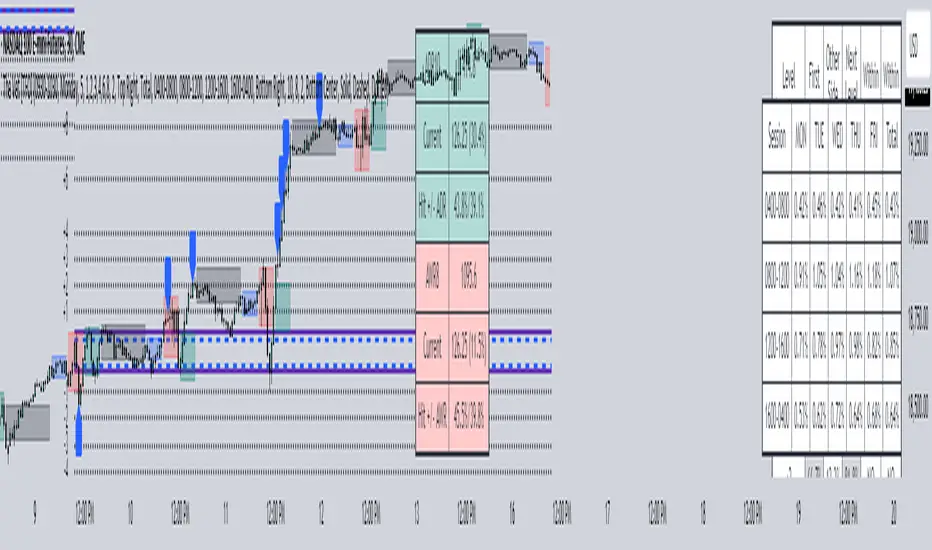
ICT Power Of Three | Flux Charts💎 GENERAL OVERVIEW
Introducing our new ICT Power Of Three Indicator! This indicator is built around the ICT's "Power Of Three" strategy. This strategy makes use of these 3 key smart money concepts : Accumulation, Manipulation and Distribution. Each step is explained in detail within this write-up. For more information about the process, check the "HOW DOES IT WORK" section.
Features of the new ICT Power Of Three Indicator :
Implementation of ICT's Power Of Three Strategy
Different Algorithm Modes
Customizable Execution Settings
Customizable Backtesting Dashboard
Alerts for Buy, Sell, TP & SL Signals
📌 HOW DOES IT WORK ?
The "Power Of Three" comes from these three keywords "Accumulation, Manipulation and Distribution". Here is a brief explanation of each keyword :
Accumulation -> Accumulation phase is when the smart money accumulate their positions in a fixed range. This phase indicates price stability, generally meaning that the price constantly switches between up & down trend between a low and a high pivot point. When the indicator detects an accumulation zone, the Power Of Three strategy begins.
Manipulation -> When the smart money needs to increase their position sizes, they need retail traders' positions for liquidity. So, they manipulate the market into the opposite direction of their intended direction. This will result in retail traders opening positions the way that the smart money intended them to do, creating liquidity. After this step, the real move that the smart money intended begins.
Distribution -> This is when the real intention of the smart money comes into action. With the new liquidity thanks to the manipulation phase, the smart money add their positions towards the opposite direction of the retail mindset. The purpose of this indicator is to detect the accumulation and manipulation phases, and help the trader move towards the same direction as the smart money for their trades.
Detection Methods Of The Indicator :
Accumulation -> The indicator detects accumulation zones as explained step-by-step :
1. Draw two lines from the lowest point and the highest point of the latest X bars.
2. If the (high line - low line) is lower than Average True Range (ATR) * accumulationConstant
3. After the condition is validated, an accumulation zone is detected. The accumulation zone will be invalidated and manipulation phase will begin when the range is broken.
Manipulation -> If the accumulation range is broken, check if the current bar closes / wicks above the (high line + ATR * manipulationConstant) or below the (low line - ATR * manipulationConstant). If the condition is met, the indicator detects a manipulation zone.
Distribution -> The purpose of this indicator is to try to foresee the distribution zone, so instead of a detection, after the manipulation zone is detected the indicator automatically create a "shadow" distribution zone towards the opposite direction of the freshly detected manipulation zone. This shadow distribution zone comes with a take-profit and stop-loss layout, customizable by the trader in the settings.
The X bars, accumulationConstant and manipulationConstant are subject to change with the "Algorithm Mode" setting. Read the "Settings" section for more information.
This indicator follows these steps and inform you step by step by plotting them in your chart.
🚩UNIQUENESS
This indicator is an all-in-one suite for the ICT's Power Of Three concept. It's capable of plotting the strategy, giving signals, a backtesting dashboard and alerts feature. Different and customizable algorithm modes will help the trader fine-tune the indicator for the asset they are currently trading. The backtesting dashboard allows you to see how your settings perform in the current ticker. You can also set up alerts to get informed when the strategy is executable for different tickers.
⚙️SETTINGS
1. General Configuration
Algorithm Mode -> The indicator offers 3 different detection algorithm modes according to your needs. Here is the explanation of each mode.
a) Small Manipulation
This mode has the default bar length for the accumulation detection, but a lower manipulation constant, meaning that slighter imbalances in the price action can be detected as manipulation. This setting can be useful on tickers that have lower liquidity, thus can be manipulated easier.
b) Big Manipulation
This mode has the default bar length for the accumulation detection, but a higher manipulation constant, meaning that heavier imbalances on the price action are required in order to detect manipulation zones. This setting can be useful on tickers that have higher liquidity, thus can be manipulated harder.
c) Short Accumulation
This mode has a ~70% lower bar length requirement for accumulation zone detection, and the default manipulation constant. This setting can be useful on tickers that are highly volatile and do not enter accumulation phases too often.
Breakout Method -> If "Close" is selected, bar close price will be taken into calculation when Accumulation & Manipulation zone invalidation. If "Wick" is selected, a wick will be enough to validate the corresponding zone.
2. TP / SL
TP / SL Method -> If "Fixed" is selected, you can adjust the TP / SL ratios from the settings below. If "Dynamic" is selected, the TP / SL zones will be auto-determined by the algorithm.
Risk -> The risk you're willing to take if "Dynamic" TP / SL Method is selected. Higher risk usually means a better winrate at the cost of losing more if the strategy fails. This setting is has a crucial effect on the performance of the indicator, as different tickers may have different volatility so the indicator may have increased performance when this setting is correctly adjusted.
3. Visuals
Show Zones -> Enables / Disables rendering of Accumulation (yellow) and Manipulation (red) zones.

Frequency and Volume ProfileFREQUENCY & VOLUME PROFILE
⚪ OVERVIEW
The Frequency and Volume Profile indicator plots a frequency or volume profile based on the visible bars on the chart, providing insights into price levels with significant trading activity.
⚪ USAGE
● Market Structure Analysis:
Identify key price levels where significant trading activity occurred, which can act as support and resistance zones.
● Volume Analysis:
Use the volume mode to understand where the highest trading volumes have occurred, helping to confirm strong price levels.
● Trend Confirmation:
Analyze the distribution of trading activity to confirm or refute trends, mark important levels as support and resistance, aiding in making more informed trading decisions.
● Frequency Distribution:
In statistics, a frequency distribution is a list of the values that a variable takes in a sample. It is usually a list. Displayed as a histogram.
⚪ SETTINGS
Source: Select the price data to use for the profile calculation (default: hl2).
Move Profile: Set the number of bars to offset the profile from the current bar (default: 100).
Mode: Choose between "Frequency" and "Volume" for the profile calculation.
Profile Color: Customize the color of the profile lines.
Lookback Period: Uses 5000 bars for daily and higher timeframes, otherwise 10000 bars.
The Frequency Profile indicator is a powerful tool for visualizing price levels with significant trading activity, whether in terms of frequency or volume. Its dynamic calculation and customizable settings make it a versatile addition to any trading strategy.

Global Net Liquidity (TG fork)Worldwide net liquidity, with trend coloring.
Global Net Liquidity attempts to represent worldwide net liquidity, and is defined as: Fed + Japan + China + UK + ECB - RRP - TGA , Where the first five components are central bank assets.
On TradingView, the indicator can be reproduced with the following equations: Global Net Liquidity = FRED:WALCL + FRED:JPNASSETS * FX_IDC:JPYUSD + CNCBBS * FX_IDC:CNYUSD + GBCBBS * FX:GBPUSD + ECBASSETSW * FX:EURUSD + RRPONTSYD + WTREGEN
However, this indicator adds a moving average cloud, and margin coloring, which eases historical trend assessment at a glance.
This indicator can be seen as an alternative representation of the accumulation/distribution indicator (and hence the same terms can be used in this description).
The Moving Average Cloud is simply the filling between the moving average (by default an EMA) and the current value. This feature was inspired by D7R ACC/DIST closed-source indicator, kudos to D7R for making such neat visual indicators.
Usage instructions:
Blue is more likely a phase of accumulation because the current value is above its historical price as defined by the moving average,
red is when this is more likely a phase of distribution.
Yellow is when the difference is below the margin, so we consider it is insignificant and that the trend is undecided. This can be disabled by setting the margin to 0.
While the color indicates if it's more likely an accumulation (blue) or distribution (red) phase or undecided (yellow), the cloud's vertical size allows to assess the strength of this tendency and the horizontal size the momentum, so that the bigger the cloud, the stronger the accumulation (if cloud is blue) or distribution (if cloud is red).
Why is that so? This is because the cloud represents the difference between the current tendency and the moving averaged past one, so a bigger cloud represents a bigger departure from recently observed tendencies. In practice, when there is accumulation, a pump in price can be expected soon, or if it already happened then it means it is indeed supported by volume, whereas if distribution, either a dump is to be expected soon, or if it already happened it means it's supported by volume.
Or maybe not necessarily a dump, but if there is a move upward in price, but the indicator indicates a strong distribution, then it means that the price movement is not supported and may not be sustainable (reversal may happen at anytime), whereas if price is going upward AND there is an accumulation (blue coloring) then it is more sustainable. This can be used to adapt strategies accordingly (risk on/risk off depending on whether there is concordance of both price and accumulation/distribution).
This indicator also includes sentiment signals that can be used to trigger alarms.
This indicator is a remix of Dharmatech's, who authored the first this Global Net Liquidity equation, kudos to them! Please show them some love if you like this indicator!
