VX-Session-Boxes-(AM/PM Split)(Customizable) by Ikaru-s-VX-Session-Boxes-(AM/PM Split) is a session-based visualization tool for TradingView that highlights major market sessions directly on the chart using dotted range boxes and an optional AM/PM split.
The indicator allows traders to visually separate market behavior across different sessions while keeping the chart clean and readable.
🔹 Key Features
Custom Session Definitions
Define up to 4 independent sessions using TradingView’s session format (HHMM-HHMM + weekdays).
Timezone-Aware
All sessions are calculated using a user-defined timezone (IANA or UTC offset), ensuring accurate session alignment across markets.
Dotted Session Boxes
Each session is drawn as a dotted box based on the session’s high/low range, providing a clear view of volatility and price structure.
AM / PM Split Visualization
Sessions can be visually split into AM and PM parts:
Separate box shading for AM and PM
Optional dotted vertical split line at the AM → PM transition (12:00 in the selected timezone)
Session Labels
Optional labels at the start of each session for quick identification (e.g. Sydney, Tokyo, London, New York).
Fully Customizable Visuals
Adjustable opacity, border width, and visibility toggles for boxes, split lines, and labels.
🔹 Use Cases
Session-based market analysis (Asia / London / New York)
Identifying session ranges and volatility expansion
Observing price behavior differences between AM and PM
Studying session transitions and liquidity shifts
🔹 Notes
Session boxes are based on session high and low, not full chart height.
AM/PM split is based on 12:00 (noon) in the selected timezone.
Designed for clarity and performance on intraday timeframes.
🔹 Compatibility
Pine Script® v6
Works on all intraday timeframes
Overlay indicator (draws directly on the price chart)
Customizable

5 DMA Entry Plus5 DMA Entry Plus - Multi-Strategy Entry Signal Indicator
Overview:
The 5 DMA Entry Plus is a versatile entry signal indicator that combines multiple proven technical analysis methods to identify potential buy opportunities. This indicator is designed to be highly customizable, allowing traders to toggle between different entry strategies or combine them for confluence-based entries.
Key Features:
1. Multiple Entry Strategy Options:
Default Close Above Entry: Triggers when price closes above the 5-day moving average (with optional HMA filter)
Green Wick Candle Signal: Identifies bullish candles where the wick pierces above key moving averages, indicating rejection of lower prices
5DMA Zero/Upslope Entry: Generates signals when the 5DMA is flat or sloping upward, confirming momentum
HMA Cross Entry: Triggers when price crosses above the Hull Moving Average, a responsive momentum indicator
2. Adaptive HMA Filter:
Toggle the HMA (Hull Moving Average) filter on or off to adjust signal sensitivity. When enabled, price must be above both the 5DMA and 20 HMA for confirmation. When disabled, only the 5DMA is required, generating more frequent signals.
3. Smart Reset Logic:
The indicator includes intelligent reset functionality that prevents signal spam. Once an entry signal is generated, no new signals appear until price closes below the moving average(s), ensuring clean, actionable entries without clutter.
4. Visual Components:
5-Day Moving Average (Blue Line): The primary trend reference
20-Period Hull Moving Average (Orange Line): Fast-responding momentum filter
Buy Signals (Green Labels): Clear "Buy" labels appear below candles when entry conditions are met
Built-in Alerts: Set up custom alerts to be notified when entry signals trigger
Customizable Inputs:
Use HMA Filter: Enable/disable the 20 HMA confirmation requirement
Include Green Wick Candle Signal: Toggle wick-based entry detection
Use 5DMA Zero/Upslope Entry: Enable slope-based entry logic
Use HMA Cross Entry: Enable HMA crossover signals
HMA Length: Adjust the Hull Moving Average period (default: 20)
Best Use Cases:
Swing trading on daily and 4-hour timeframes
Identifying pullback entries in uptrends
Combining multiple confirmation signals for high-probability setups
Filtering entries in momentum-based strategies
Strategy Flexibility:
This indicator allows you to use each entry method independently or combine multiple methods for confluence. Test different combinations to find what works best for your trading style and the instruments you trade.
Risk Management Note:
This indicator identifies potential entry points but does not provide exit signals or stop-loss levels. Always use proper risk management and combine with your own exit strategy.

Customizable Dashboard (SIMPLE)This is a custom table where you can track any ticker and it's daily change. color coded to make things easy.

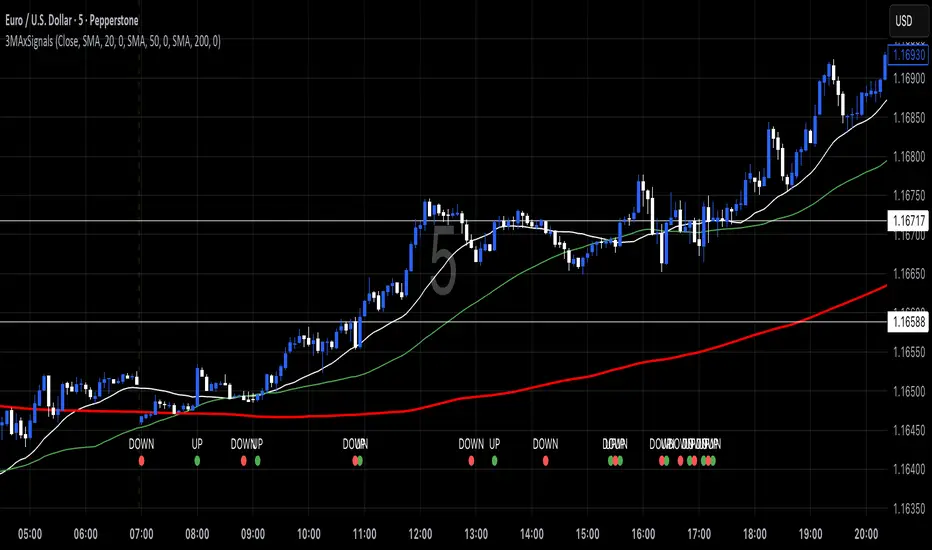
3 MA's with Crossing SignalsPlots three fully configurable moving averages on one chart and prints/alerts BUY/SELL signals when price crosses your chosen MA(s). Built to match TradingView’s built-ins exactly.
Features
Per-line MA type: SMA, EMA, SMMA (RMA), WMA, VWMA
Per-line settings: length, color, offset
Source control: Close, Open, High, Low, HL2, HLC3, OHLC4
Optional Heikin Ashi calculation for both the MAs and the cross price
Toggle signals vs MA1 / MA2 / MA3 independently
Alert conditions for every cross (ready for “Once per bar close”)
How signals work
UP when the selected price stream crosses above the chosen MA
DOWN when it crosses below
Signals/alerts follow your selected source (and HA toggle) to keep everything consistent.
LevelsThis Indicator is meant to plot some of the most common levels that traders use.
The display of these levels is highly customizable, as you can choose the line type , color , thickness and whether it shows you no label, price only, reduced label or full label next to the line. All labels (except for "no Label") will show the price at this level.
Also You have the option to mark the start on each timeframe with either a individually colored background or a vertical line where you can choose the line style and color.
Full List of available Levels and Optional inputs to these levels:
Previous HTF Candle Levels:
• Previous HTF Candle Open
• Previous HTF Candle High
• Previous HTF Candle Low
• Previous HTF Candle Close
Optional:
• Choose any higher timeframe
• Mark start of new HTF candle
Session Levels:
• Session Open
• Session High
• Session Low
• Session Close
Optional:
• Choose any time as start and end of your session
• Mark start of session
• Mark full session
Daily Levels:
• Current Day Open
• Current Day High
• Current Day Low
• Previous Day Open
• Previous Day High
• Previous Day Low
• Previous Day Close
Optional:
• Choose start of day (standard, NY Midnight, custom start time)
• Mark start of day
Weekly Levels:
• Current Week Open
• Current Week High
• Current Week Low
• Previous Week Open
• Previous Week High
• Previous Week Low
• Previous Week Close
Optional:
• Mark start of Week
Monthly Levels:
• Current Month Open
• Current Month High
• Current MonthLow
• Previous Month Open
• Previous Month High
• Previous Month Low
• Previous Month Close
Optional:
• Mark start of Month

Dual Custom Index with SpreadDual Custom Index with Spread
Create powerful custom indices from any instruments and analyze their relative strength dynamics
Overview
This advanced indicator allows you to build two completely customizable indices from your choice of instruments and analyze their spread relationship. Perfect for inter-market analysis, sector rotation strategies, currency strength comparisons, and sophisticated relative performance studies.
Key Features
🔧 Fully Customizable Index Construction
Build each index from up to 6 instruments with individual weightings
Enable/disable instruments on the fly without losing settings
Automatic weight validation ensures mathematically accurate calculations
Invert functionality for instruments that move opposite to index strength
📊 Advanced ADX-Based Methodology
Uses sophisticated ADX +DI/-DI directional bias calculations
Normalized bias calculation for consistent scaling across different instruments
Optimized default settings for intraday trading with full customization options
Professional-grade smoothing and filtering options
📈 Dual Analysis Modes
Difference Mode: Shows absolute strength difference (Index1 - Index2)
Ratio Mode: Shows relative performance ratio (Index1 / Index2)
Additional spread smoothing for cleaner signals
🎨 Professional Display Options
Custom labels with full color, size, and positioning control
Dynamic "Follow Line" labels that move with your data
Static corner positioning for reference displays
Clean error messaging and validation feedback
Use Cases
Gold Trading: Create gold strength vs USD strength indices for precise market timing
Sector Analysis: Compare technology vs financial sector strength for rotation strategies
Currency Strength: Build custom currency baskets for advanced forex analysis
Commodity Spreads: Analyze relative strength between different commodity groups
Regional Markets: Compare strength between different geographical market indices
Crypto Analysis: Track relative performance between different cryptocurrency sectors
Technical Specifications
Instruments per Index: Up to 6 with individual enable/disable
Weight Validation: Automatic 100% total weight enforcement
Calculation Method: ADX-based directional bias with trend strength weighting
Smoothing Options: Multiple levels of customizable smoothing
Error Handling: Professional validation with clear user feedback
Optimization Tips
Intraday Trading: Use DI Length 3-7 for faster response
Daily Analysis: Use DI Length 10-14 for smoother signals
Noisy Markets: Increase Final Smoothing for cleaner signals
Trending Markets: Lower smoothing values for faster reaction
Perfect for traders who need sophisticated inter-market analysis tools beyond standard indicators. Whether you're analyzing gold vs dollar dynamics, sector rotation opportunities, or custom currency strength relationships, this indicator provides institutional-grade analysis capabilities with complete customization flexibility.

Multi Averages - CustomizableThis script adds up to 5 moving averages to your plot!
Both type and length are customizable.

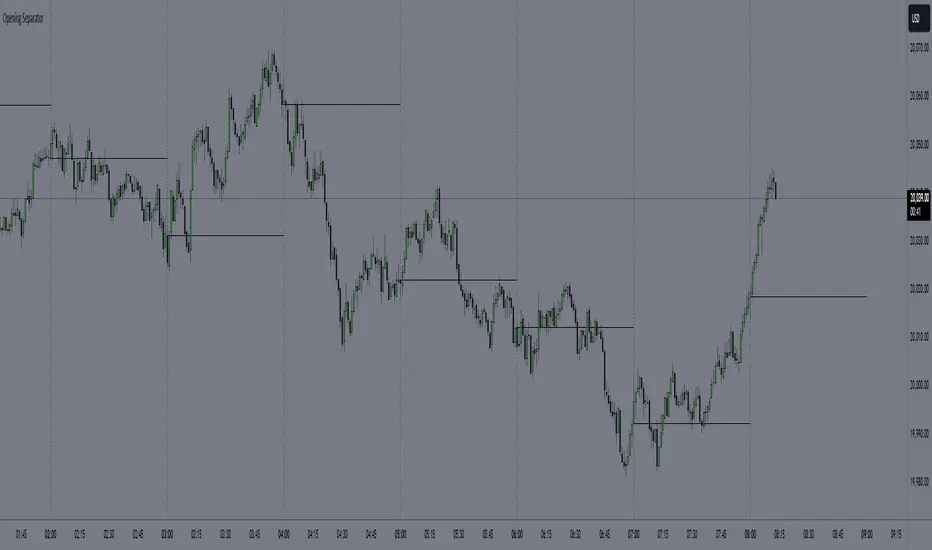
Custom Opening TimesThis indicator displays custom opening levels on your chart. Define multiple opening times, each with its own customizable style. Display these levels as horizontal lines at the opening price, or as vertical lines to mark the opening time.
Custom Opening Times
4 Independent Groups with 4 custom opening levels each
Set any custom opening time (displayed in New York Local Time)
Choose between Opening Price lines, Vertical time markers, or Both
Cutoff Times: Stop extending lines after specified times
Higher Timeframe Levels
5 Configurable HTF levels supporting any timeframe
Display opening prices from Daily, Weekly, Monthly, Quarterly, and custom timeframes
Show Previous High/Low levels from higher timeframes

Metatron Lines (Highs & Lows Geometry)Metatron Lines
Hey TradingView community! 👋
I wanted to share something I've been working on that might help you see market structure from a different angle. This indicator connects pivot highs and lows using geometric patterns, creating what I call "Metatron Lines."
What it does (simply put):
- Finds significant highs and lows on your chart
- Draws lines connecting these points to reveal hidden geometric relationships
- Shows you the underlying structure that price tends to respect
Why I built this:
I noticed that markets often move in patterns that aren't immediately obvious. Sometimes the most important levels aren't the obvious support and resistance lines, but the intersections and angles created by connecting multiple pivot points. This tool helps visualize those relationships.
How it might help you:
- Pattern Recognition : Spot geometric formations that traditional analysis might miss
- Support/Resistance : See where multiple geometric lines converge to create strong levels
- Market Structure : Better understand how price flows and where it might find obstacles
- Confluence Areas : Identify zones where multiple geometric elements align
A few honest thoughts:
This isn't a magic bullet or a guaranteed profit maker (nothing is!). It's simply another lens through which to view price action. Some traders find geometric analysis helpful, others prefer different approaches - and that's perfectly fine.
I've tried to make it customizable so you can adjust it to fit your trading style and timeframe. The default settings work well for most instruments, but feel free to experiment.
Settings you can adjust:
- Pivot detection sensitivity
- Number of connection points
- Line colors and styles
- Which connections to show (highs, lows, or both)
I hope some of you find this useful! I'm always learning from this community, so if you have suggestions for improvements or different ways to use it, I'd love to hear them.
Trade safe and trust your process! 📈
---
This indicator is provided as-is for educational and analysis purposes. Please practice proper risk management and never risk more than you can afford to lose.

Democratic MultiAsset Strategy [BerlinCode42]Happy Trade,
Intro
Included Trade Concept
Included Indicators and Compare-Functions
Usage and Example
Settings Menu
Declaration for Tradingview House Rules on Script Publishing
Disclaimer
Conclusion
1. Intro
This is the first multi-asset strategy available on TradingView—a market breadth multi-asset trading strategy with integrated webhooks, backtesting capabilities, and essential strategy components like Take Profit, Stop Loss, Trailing, Hedging, Time & Session Filters, and Alerts.
How It Trades? At the start of each new bar, one asset from a set of eight is selected to go long or short. As long there is available cash and the selected asset meets the minimum criteria.
The selection process works through a voting system, similar to a democracy. Each asset is evaluated using up to five indicators that the user can choose. The asset with the highest overall voting score is picked for the trade. If no asset meets all criteria, no trade is executed, and the cash reserve remains untouched for future opportunities.
How to Set Up This Market Breadth Strategy:
Choose eight assets from the same market (e.g., cryptos or big tech stocks).
Select one to five indicators for the voting system.
Refine the strategy by adjusting Take Profit, Stop Loss, Hedging, Trailing, and Filters.
2. Voting as the included Trade Concept
The world of financial trading is filled with both risks and opportunities, and the key challenge is to identify the right opportunities, manage risks, and do both right on time.
There are countless indicators designed to spot opportunities and filter out risks, but no indicator is perfect—they only work statistically, hitting the right signals more often than the wrong ones.
The goal of this strategy is to increase the accuracy of these Indicators by:
Supervising a larger number of assets
Filtering out less promising opportunities
This is achieved through a voting system that compares indicator values across eight different assets. It doesn't just compare long trades—it also evaluates long vs. short positions to identify the most promising trade.
Why focus on one asset class? While you can randomly select assets from different asset classes, doing so prevents the algorithm from identifying the strongest asset within a single class. Think about, within one asset class there is often a major trend whereby different asset classes has not really such behavior.
And, you don’t necessarily need trading in multiple classes—this algorithm is designed to generate profits in both bullish and bearish markets. So when ever an asset class rise or fall the voting system ensure to jump on the strongest asset. So this focusing on one asset class is an integral part of this strategy. This all leads to more stable and robust trading results compared to handling each asset separately.
3. Included Indicators and Compare-Functions
You can choose from 17 different indicators, each offering different types of signals:
Some provide a directional signal
Some offer a simple on/off signal
Some provide both
Available Indicators: RSI, Stochastic RSI, MFI, Price, Volume, Volume Oscillator, Pressure, Bilson Gann Trend, Confluence, TDI, SMA, EMA, WMA, HMA, VWAP, ZLMA, T3MA
However, these indicators alone do not generate trade signals. To do so, they must be compared with thresholds or other indicators using specific comparison functions.
Example – RSI as a Trade Signal. The RSI provides a value between 0 and 100. A common interpretation is:
RSI over 80 → Signal to go short or exit a long trade
RSI under 20 → Signal to go long or exit a short trade
Here, two comparison functions and two thresholds are used to determine trade signals.
Below is the full set of available comparison functions, where: I represents the indicator’s value and A represents the comparator’s value.
I < A if I smaller A then trade signal
I > A if I bigger A then trade signal
I = A if I equal to A then trade signal
I != A if I not equal to A then trade signal
A <> B if I bigger A and I smaller B then trade signal
A >< B if I smaller A then long trade signal or if I bigger B then short trade signal
Image 1
In Image 1, you can see one of five input sections, where you define an indicator along with its function, comparator, and constants. For our RSI example, we select:
Indicator: RSI
Function: >< (greater/less than)
Comparator: Constant
Constants: A = 20, B = 80
With these settings a go short signal is triggered when RSI crosses above 80. And a go long signal is triggered when RSI crosses below 20.
Relative Strength Indicator: The RSI from the public TradingView library provides a directional trade signal. You can adjust the price source and period length in the indicator settings.
Stochastic Relative Strength Indicator: As above the Stoch RSI offers a trade signal with direction. It is calculated out of the RSI, the stochastic derivation and the SMA from the Tradingview library. You can set the in-going price source and the period length for the RSI, for the Stochastic Derivation and for the SMA as blurring in the Indicator settings section.
Money Flow Indicator: As above the MFI from the public Tradingview library offers a trade signal with direction. You can set the in-going price source and the period length in the Indicator settings section.
Price: The Price as Indicator is as simple as it can be. You can chose Open, High, Low or Close or combinations of them like HLC3 or even you can import an external Indicator. The absolute price or value can later be used to generate a trade signals when certain constant thresholds or other indicators signals are crossed.
Volume: Similar as above the Volume as Indicator offers the average volume as absolute value. You can set the period length for the smoothing and you can chose where it is presented in the base currency $ or is the other. For example the trade pair BTCUSD you can chose to present the value in $ or in BTC.
Volume Oscillator: The Volume Oscillator Indicator offers a value in the range of . Whereby a value close to 0 means that the volume is very low. A value around 1 means the volume is same high as before and Values higher as 1 means the volume is bigger then before. You can set the period length for the smoothing and you can chose where it is presented in the base currency $ or is the other. For example the trade pair BTCUSD you can chose to present the value in $ or in BTC.
Pressure Indicator: The Pressure is an adapted version of LazyBear's script (Squeeze Momentum Indicator) Pressure is a Filter that highlight bars before a bigger price move in any direction. The result are integer numbers between 0 and 4 whereby 0 means no bigger price move excepted, while 4 means huge price move expected. You can set the in-going price source and the period length in the Indicator settings section.
Bilson Gann Trend: The Bilson Gann Trend Indicator is a specific re-implementation of the widely known Bilson Gann Count Algorithm to detect Highs and Lows. On base of the last four Highs and Lows a trend direction can be calculated. It is based on 2 rules to confirm a local pivot candidate. When a local pivot candidate is confirmed, let it be a High then it looks for Lows to confirm. The result range is whereby -1 means down trend, 1 means uptrend and 0 sideways.
Confluence: The Confluence Indicator is a simplified version of Dale Legan's "Confluence" indicator written by Gary Fritz. It uses five SMAs with different periods lengths. Whereby the faster SMA get compared with the (slower) SMA with the next higher period lengths. Is the faster SMA smaller then the slower SMA then -1, otherwise +1. This is done with all SMAs and the final sum range between . Whereby values around 0 means price is going side way, Crossing under 0 means trend change from bull to bear. Is the value>2 means a strong bull trend and <-2 a strong bear trend.
Trades Dynamic Index: The TDI is an adapted version from the "Traders Dynamic Index" of LazyBear. The range of the result is whereby 2 means Top goShort, -2 means Bottom goLong, 0 is neutral, 1 is up trend, -1 is down trend.
Simple Moving Average: The SMA is the one from the Tradingview library. You can compare it with the last close price or any other moving average indicator to indicate up and down trends. You can set the in-going price source and the period length in the Indicator settings section.
Exponential Moving Average: The EMA as above is the one from the Tradingview library. You can compare it with the last close price or any other moving average indicator to indicate up and down trends. You can set the in-going price source and the period length in the Indicator settings section.
Weighted Moving Average: The WMA as above is the one from the Tradingview library. You can compare it with the last close price or any other moving average indicator to indicate up and down trends. You can set the in-going price source and the period length in the Indicator settings section.
Hull Moving Average: HMA as above is the one from the Tradingview library. You can compare it with the last close price or any other moving average indicator to indicate up and down trends. You can set the in-going price source and the period length in the Indicator settings section.
Volume Weighted Average Price: The VWAP as above is the one from the Tradingview library. You can compare it with the last close price or any other moving average indicator to indicate up and down trends. You can set the in-going price source in the Indicator settings section.
Zero Lag Moving Average: The ZLMA by John Ehlers and Ric Way describe in their paper: www.mesasoftware.com
As the other moving averages you can compare it with the last close price or any other moving average indicator to indicate up and down trends. You can set the in-going price source and the period length in the Indicator settings section.
T3 Moving Average: The T3MA is the one from the Tradingview library. You can compare it with the last close price or any other moving average indicator to indicate up and down trends. You can set the in-going price source, the period length and a factor in the Indicator settings section. Keep this factor at 1 and the T3MA swing in the same range as the input. Bigger 1 and it swings over. Factors close to 0 and the T3MA becomes a center line.
All MA's following the price. The function to compare any MA Indicators would be < or > to generate a trade direction. An example follows in the next section.
4. Example and Usage
In this section, you see how to set up the strategy using a simple example. This example was intentionally chosen at random and has not undergone any iterations to refine the trade results.
We use the RSI as the trade signal indicator and apply a filter using a combination of two moving averages (MAs). The faster MA is an EMA, while the slower MA is an SMA. By comparing these two MAs, we determine a trend direction. If the faster MA is above the slower MA the trend is upwards etc. This trend direction can then be used for filtering trades.
The strategy follows these rules:
If the RSI is below 20, a buy signal is generated.
If the RSI is above 80, a sell signal is generated.
However, this RSI trade signal is filtered so that a trade is only given the maximum voting weight if the RSI trade direction aligns with the trend direction determined by the MA filter.
So first, you need to add your chosen assets or simply keep the default ones. In Image 2, you can see one of the eight asset input sections.
Image 2
This strategy offers some general trade settings that apply equally to all assets and some asset-specific settings. This distinction is necessary because some assets have higher volatility than others, requiring asset-specific Take Profit and Stop Loss levels.
Once you have made your selections, proceed to the Indicators and Compare Functions for the voting. Image 3 shows an example of this setup.
Image 3
Later on go to the Indicator specific settings shown in Image 4 to refine the trade results.
Image 4
For refine the trade results take also a look on the result summary table, development of capital plot, on the list of closed and open trades and screener table shown in Image 5.
Image 5
To locate any trade for any asset in the chronological and scroll-able trade list, each trade is marked with a label:
An opening label displaying the trade direction, ticker ID, trade number, invested amount, and remaining cash reserves.
A closing label showing the closing reason, ticker ID, trade number, trade profit (%), trade revenue ($), and updated cash reserves.
Additionally: a green line marks each Take Profit level. An orange line indicates the (trailing) Stop Loss.
The summary table in the bottom-left corner provides insights into how effective the trade strategy is. By analyzing the trade list, you can identify trades that should be avoided.
To find those bad trades on the chart, use the trade number or timestamp. With replay mode, you can go back in time to review a specific trade in detail.
Image 6
In Image 6, you can see an example where replay mode and the start time filter are used to display specific trades within a narrow time range. By identifying a large number of bad trades, you may recognize patterns and formulate conditions to avoid them in the future.
This is the backtesting tool that allows you to develop and refine your trading strategy continuously. With each iteration—from general adjustments to detailed optimizations—you can use these tools to improve your strategy. You can:
Add other indicators with trade signals and direction
Add more indicators signals as filter
Adjust the settings of your indicators to optimize results
Configure key strategy settings, such as Time and Session Filters, Stop Loss, Take Profit, and more
By doing so, you can identify a profitable strategy and its optimal settings.
5. Settings Menu
In the settings menu you will find the following high-lighted sections. Most of the settings have a i mark on their right side. Move over it with the cursor to read specific explanation.
Backtest Results: Here you can decide about visibility of the trade list, of the Screener Table and of the Results Summary. And the colors for bullish, side ways, bearish and no signal. Go above and see Image 5.
Time Filter: You can set a Start time or deactivate it by leave it unhooked. The same with End Time and Duration Days . Duration Days can also count from End time in case you deactivate Start time.
Session Filter: Here, you can chose to activate trading on a weekly basis, specifying which days of the week trading is allowed and which are excluded. Additionally, you can configure trading on a daily basis, setting the start and end times for when trades are permitted. If activated, no new trades will be initiated outside the defined times and sessions.
Trade Logic: Here you can set an extra time frame for all indicators. You can enable Longs or Shorts or both trades.
The min Criteria percentage setting defines the minimum number of voices an asset has to get to be traded. So if you set this to 50% or less also weak winners of the voting get traded while 100% means that the winner of the voting has to get all possible voices.
Additionally, you have the option to delay entry signals. This feature is particularly useful when trade signals exhibit noise and require smoothing.
Enable Trailing Stop and force the strategy to trade only at bar closing. Other-ways the strategy trade intrabar, so when ever a voting present an asset to trade, it will send the alert and the webhooks.
The Hedging is basic as shown in the following Image 7 and serves as a catch if price moves fast in the wrong direction. You can activate a hedging mechanism, which opens a trade in the opposite direction if the price moves x% against the entry price. If both the Stop Loss and Hedging are triggered within the same bar, the hedging action will always take precedence.
Image 6
Indicators to use for Trade Signal Generating: Here you chose the Indicators and their Compare Function for the Voting . Any activated asset will get their indicator valuation which get compared over all assets. The asset with the highest valuation is elected for the trade as long free cash is present and as long the minimum criteria are met.
The Screener Table will show all indicators results of the last bar of all assets. Those indicator values which met the threshold get a background color to high light it. Green for bullish, red for bearish and orange for trade signals without direction. If you chose an Indicator here but without any compare function it will show also their results but with just gray background.
Indicator Settings: here you can setup the indicator specific settings. for deeper insights see 3. Included Indicators and Compare-Functions .
Assets, TP & SL Settings: Asset specific settings. Chose here the TickerID of all Assets you wanna trade. Take Profit 1&2 set the target prices of any trade in relation to the entry price. The Take Profit 1 exit a part of the position defined by the quantity value. Stop Loss set the price to step out when a trade goes the wrong direction.
Invest Settings: Here, you can set the initial amount of cash to start with. The Quantity Percentage determines how much of the available cash is allocated to each trade, while the Fee percentage specifies the trading fee applied to both opening and closing positions.
Webhooks: Here, you configure the License ID and the Comment . This is particularly useful if you plan to use multiple instances of the script, ensuring the webhooks target the correct positions. The Take Profit and Stop Loss values are displayed as prices.
6. Declaration for Tradingview House Rules on Script Publishing
The unique feature of this Democratic Multi-Asset Strategy is its ability to trade multiple assets simultaneously. Equipped with a set of different standard Indicators, it's new democratic Voting System does more robust trading decisions compared to single-asset. Interchangeable Indicators and customizable strategy settings allowing for a wide range of trading strategies.
This script is closed-source and invite-only to support and compensate for over a year of development work. Unlike other single asset strategies, this one cannot use TradingView's strategy functions. Instead, it is designed as an indicator.
7. Disclaimer
Trading is risky, and traders do lose money, eventually all. This script is for informational and educational purposes only. All content should be considered hypothetical, selected post-factum and is not to be construed as financial advice. Decisions to buy, sell, hold, or trade in securities, commodities, and other investments involve risk and are best made based on the advice of qualified financial professionals. Past performance does not guarantee future results. Using this script on your own risk. This script may have bugs and I declare don't be responsible for any losses.
8. Conclusion
Now it’s your turn! Chose an asset class and pick 8 of them and chose some indicators to see the trading results of this democratic voting system. Refine your multi-asset strategy to favorable settings. Once you find a promising configuration, you can set up alerts to send webhooks directly. Configure all parameters, test and validate them in paper trading, and if results align with your expectations, you even can deploy this script as your trading bit.
Cheers

Custom Previous High/Low + Breakout AlertsThis indicator plots the previous high and low of the selected timeframe and alerts you when the price breaks either level.
To prevent spam, it triggers only once per period. If both the high and low break within the same period, you will receive an alert for each, but no duplicates if price hovers around these levels.
How to Set Up Alerts
1. Choose Your Timeframe
- In the indicator settings, select the timeframe for the high/low reference.
- Example: If you select 1 hour, the indicator will plot the previous 1-hour high and low and alert you when either level is broken
2. Create an Alert
- Condition → High/Low Break Alerts
- Function → Any alert() function call
Optional:
- If you want alerts only for high breakouts or low breakouts, select High Breakout or Low Breakout and use "Once Per Bar" as the trigger. (It will still alert only once per period.)
3. Setting Alerts for Multiple Timeframes
- If you want to create another alert for a different timeframe, first select the new timeframe in the indicator settings, then create a new alert
- Note: Previous alerts will continue to notify you based on the timeframe they were originally set for, even if you change the timeframe in the indicator settings.

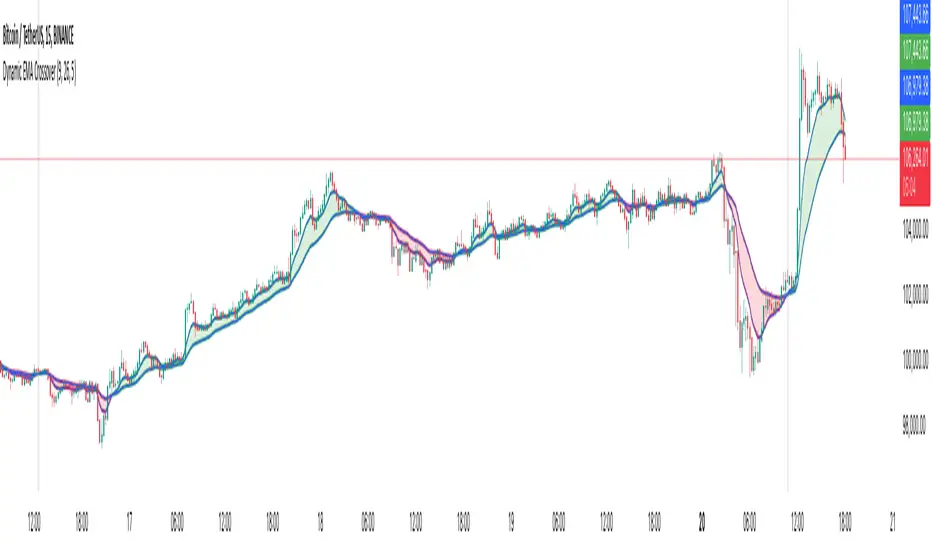
Dynamic EMA CrossoverThe Dynamic EMA Crossover indicator is designed to help traders identify trend transitions, visually understand market direction, and detect sideways consolidation zones. It simplifies decision-making by dynamically changing colors and highlighting areas of interest.
Key Features:
1. Dynamic EMA Crossovers:
• Uses two EMAs (default: 9 and 26 ) to identify bullish and bearish trends.
• EMAs and the area between them turn green during bullish trends and red during bearish trends for easy visualization.
2. Sideways Market Detection:
• Automatically detects periods of market consolidation when EMAs overlap for 10 consecutive candles and the price movement remains narrow.
• Sideways zones are highlighted with grey background, helping traders avoid false breakouts and trendless markets.
3. Customizable Inputs:
• Adjust the lengths of the two EMAs and the sensitivity of the overlap detection to match your trading style and market conditions.
How It Works:
• Trend Identification:
• When the shorter EMA crosses above the longer EMA, a bullish trend is indicated.
• When the shorter EMA crosses below the longer EMA, a bearish trend is indicated.
• The indicator dynamically adjusts the colors of the EMAs and fills the area between them for clear trend visibility.
• Sideways Market Detection:
• When the shorter EMA and longer EMA stay close (within a customizable sensitivity) for a fixed period (hardcoded to 10 candles), the indicator identifies a sideways market.
• This feature helps traders avoid entering trades during choppy or indecisive market conditions.
Who Is This For?
This indicator is ideal for:
• Trend traders looking for clear signals of trend direction.
• Swing traders who want to avoid trading in sideways markets.
• Scalpers who need quick and reliable visual cues for short-term market behavior.
Use Cases:
1. Bullish/Bearish Trends:
• Enter trades in the direction of the trend as the crossover occurs and colors change.
2. Sideways Zones:
• Avoid trades during periods of consolidation and wait for a clear breakout.
Mashup Logic:
This indicator combines:
1. EMA Crossovers:
• A tried-and-tested method for trend detection using two moving averages.
• Dynamic visual cues for bullish and bearish market phases.
2. Sideways Market Detection:
• Innovative logic to highlight sideways zones based on EMA overlap and price range analysis.
• Helps reduce noise and avoid trading during trendless periods.
3. Customization and Flexibility:
• Fully adjustable EMA lengths and overlap sensitivity to adapt to different markets and trading styles.
Relative Performance Indicator by ComLucro - 2025_V01The "Relative Performance Indicator by ComLucro - 2025_V01" is a powerful tool designed to analyze an asset's performance relative to a benchmark index over multiple timeframes. This indicator provides traders with a clear view of how their chosen asset compares to a market index in short, medium, and long-term periods.
Key Features:
Customizable Lookback Periods: Analyze performance across three adjustable periods (default: 20, 50, and 200 bars).
Relative Performance Analysis: Calculate and visualize the difference in percentage performance between the asset and the benchmark index.
Dynamic Summary Label: Displays a detailed breakdown of the asset's and index's performance for the latest bar.
User-Friendly Interface: Includes customizable colors and display options for clear visualization.
How It Works:
The script fetches closing prices of both the asset and a benchmark index.
It calculates percentage changes over the selected lookback periods.
The indicator then computes the relative performance difference between the asset and the index, plotting it on the chart for easy trend analysis.
Who Is This For?:
Traders and investors who want to compare an asset’s performance against a benchmark index.
Those looking to identify trends and deviations between an asset and the broader market.
Disclaimer:
This tool is for educational purposes only and does not constitute financial or trading advice. Always use it alongside proper risk management strategies and backtest thoroughly before applying it to live trading.
Chart Recommendation:
Use this script on clean charts for better clarity. Combine it with other technical indicators like moving averages or trendlines to enhance your analysis. Ensure you adjust the lookback periods to match your trading style and the timeframe of your analysis.
Additional Notes:
For optimal performance, ensure the benchmark index's data is available on your TradingView subscription. The script uses fallback mechanisms to avoid interruptions when index data is unavailable. Always validate the settings and test them to suit your trading strategy.

Katalyst's Opening Range BreakoutKatalyst's Opening Range Breakout + No Trade Zone
📜 Overview:
This indicator allows traders to visualize the high and low of the opening range for a user-selected timeframe (e.g., 30s, 1m, 5m, 15m). It features fully customizable lines, labels, and an optional **No Trade Zone** fill to help you identify breakout levels with ease.
---
🎯 Key Features:
1. **Customizable Opening Range**:
- Select your preferred opening range duration: **30 seconds, 1 minute, 2 minutes, 5 minutes, 10 minutes, or 15 minutes**.
- The indicator calculates and plots the **high** and **low** of the selected opening range.
2. **Dynamic Line Styling**:
- Choose the **line color**, **transparency**, and **style**: **Solid, Dashed, or Dotted**.
- Lines extend to the right of the chart for clarity.
3. **No Trade Zone** *(Optional / Disabled by default)*:
- When enabled, fills the area between the high and low lines with a customizable **color and transparency**.
- Helps visually identify consolidation areas where trading might be avoided.
4. **Labels for Precision**:
- Clearly displays the **Opening Range High** and **Low** values.
- Labels are color-coded and positioned dynamically for easy interpretation.
5. **Clean and Efficient Updates**:
- The indicator deletes old lines, labels, and fills before creating new ones, ensuring a clutter-free chart.
---
⚙️ How to Use:
1. **Select Your Timeframe**:
- From the settings, choose your desired opening range duration: 30s, 1m, 2m, 5m, 10m, or 15m.
2. **Customize the Visuals**:
- Adjust line color, style, and transparency.
- Enable the **No Trade Zone** for a transparent background fill between the high and low lines.
3. **Interpret the Breakout**:
- Watch for price movements above or below the **opening range** to identify potential breakout opportunities.
---
🛠 Settings:
Opening Range Duration: Select the timeframe for the opening range (30s, 1m, 2m, 5m, 10m, 15m).
Line Color: Set the color of the range lines.
Line Transparency: Adjust the transparency of the lines (0 = solid, 100 = invisible).
Line Style: Choose line style: Solid, Dashed, or Dotted.
Label Colors: Customize the label colors for the high and low values.
Enable No Trade Zone: Fill the area between high and low lines with a transparent color.
No Trade Zone Color: Set the fill color for the no trade zone.
No Trade Zone Transparency: Adjust the transparency of the no trade zone fill.
---
📈 Ideal For
Day traders and scalpers looking to trade **breakouts**.
Traders who want to identify areas of consolidation visually.
Anyone who relies on the **opening range** for their trading strategy.
---
🔍 Example Usage:
Set the opening range to **5 minutes** and enable the **No Trade Zone** with a light red fill.
Watch for price to break above or below the high/low lines to signal potential trade opportunities.
---
✨ Why Use This Indicator?
This script simplifies your breakout strategy by providing a clear, visually appealing representation of the opening range. The flexible customization options and the optional **No Trade Zone** make it a powerful tool for identifying high-probability trades.
---
Let me know if you need any additional tweaks or clarifications for this description. It's all set to help traders understand and use your powerful script! 🚀📈

Sticky Note Pro: Customizable Trading ChecklistStay organized and disciplined with this customizable sticky note on your TradingView chart. Perfect for traders who want to keep essential trading reminders, checklists, or notes visible while analyzing the market.
### Features:
- **Customizable Templates**: Choose from a **Trading Checklist**, **Risk Management**, or **Custom** template.
- **Section Customization**: Tailor the titles and content for up to three sections:
- 📊 **Analysis**: Track trend direction and support/resistance levels.
- 💰 **Risk Management**: Ensure proper risk management with reminders for risk percentage and stop loss settings.
- 🧠 **Psychology**: Stay disciplined with reminders to stick to your plan and avoid overtrading.
- **Dynamic Content**: Add or hide sections based on your preference, with dynamic spacing and content formatting.
- **Visual Customization**: Change text and background colors, and adjust text size and line spacing for optimal visibility.
- **Chart Integration**: The sticky note is displayed on the top-right corner of your chart and updates with the most recent bar.
### Why Use This Indicator?
This tool helps you stay on track with your trading plan, offering reminders for analysis, risk management, and trading psychology, all in one convenient place. Customize it to fit your style, and never miss a key point during your trading sessions again.

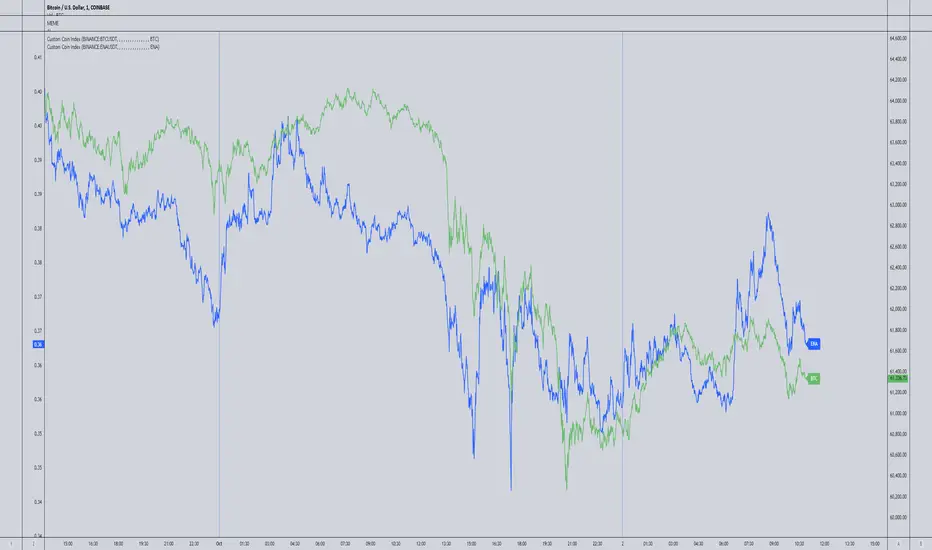
Spaghetti - Custom Cryptocurrency Index IndicatorDescription:
Spaghetti is a highly customizable cryptocurrency index indicator designed to let you track an average price of up to 15 different cryptocurrencies in one convenient line. Whether you're interested in a mix of meme coins, AI projects, or any other specific subset of coins, Spaghetti allows you to create your own personalized index.
Features:
Customizable Coin List: Input up to 15 different cryptocurrencies of your choice, allowing you to tailor the indicator to your preferred assets and strategies.
Dynamic Labeling: Features a label on the chart that displays a user-defined name, so you can personalize the indicator's label to match your theme or trading strategy.
Color Customization: The line color is fully customizable, enabling better visual integration with your charts.
Average Calculation: Calculates and plots the average price of all selected coins, providing an easy way to visualize overall market movement for your customized selection.
How to Use Spaghetti:
In the indicator settings, enter the tickers for up to 15 coins you want to include (e.g., BINANCE:BTCUSDT).
Customize the line color and the label text to match your style or preferences.
The indicator will plot the average price of all selected coins, with a dynamic label that follows the price for easy reference.
Spaghetti makes it easy to create and track custom crypto indices, providing a broader perspective of your selected market segments. Perfect for traders who want to stay on top of multiple assets without the clutter!
Hourly Separator + Opening LineThis indicator shows the vertical and horizontal opening lines for the hourly timeframe.
Also has options to choose a different opening time:
- 1 Hour
- 30 Min
- 15 Min
- 10 Min
- 5 Min
Custom Time Range HighlighterCustom Time Range Highlighter
This versatile indicator allows traders to highlight specific time ranges on their charts, accommodating users worldwide by supporting customizable UTC offsets. Traders can define two distinct time ranges, setting start and end hours in their local time zone.
A toggle option enables the display of highlights for today only , ensuring focus on current trading conditions.
Ideal for day traders and those following specific market sessions, this tool enhances visibility of active trading periods and aids in effective trade management.

RSI Volatility Bands [QuantraSystems]RSI Volatility Bands
Introduction
The RSI Volatility Bands indicator introduces a unique approach to market analysis by combining the traditional Relative Strength Index (RSI) with dynamic, volatility adjusted deviation bands. It is designed to provide a highly customizable method of trend analysis, enabling investors to analyze potential entry and exit points in a new and profound way.
The deviation bands are calculated and drawn in a manner which allows investors to view them as areas of dynamic support and resistance.
Legend
Upper and Lower Bands - A dynamic plot of the volatility-adjusted range around the current price.
Signals - Generated when the RSI volatility bands indicate a trend shift.
Case Study
The chart highlights the occurrence of false signals, emphasizing the need for caution when the bands are contracted and market volatility is low.
Juxtaposing this, during volatile market phases as shown, the indicator can effectively adapt to strong trends. This keeps an investor in a position even through a minor drawdown in order to exploit the entire price movement.
Recommended Settings
The RSI Volatility Bands are highly customisable and can be adapted to many assets with diverse behaviors.
The calibrations used in the above screenshots are as follows:
Source = close
RSI Length = 8
RSI Smoothing MA = DEMA
Bandwidth Type = DEMA
Bandwidth Length = 24
Bandwidth Smooth = 25
Methodology
The indicator first calculates the RSI of the price data, and applies a custom moving average.
The deviation bands are then calculated based upon the absolute difference between the RSI and its moving average - providing a unique volatility insight.
The deviation bands are then adjusted with another smoothing function, providing clear visuals of the RSI’s trend within a volatility-adjusted context.
rsiVal = ta.rsi(close, rsiLength)
rsiEma = ma(rsiMA, rsiVal, bandLength)
bandwidth = ma(bandMA, math.abs(rsiVal - rsiEma), bandLength)
upperBand = ma(bandMA, rsiEma + bandwidth, smooth)
lowerBand = ma(bandMA, rsiEma - bandwidth, smooth)
long = upperBand > 50 and not (lowerBand < lowerBand and lowerBand < 50)
short= not (upperBand > 50 and not (lowerBand < lowerBand and lowerBand < 50))
By dynamically adjusting to market conditions, the RSI trend bands offer a unique perspective on market trends, and reversal zones.

HTF Volume by Prosum SolutionsOverview of Features
This indicator was inspired by the work of "LonesomeTheBlue" in the script called "Volume Multi Time Frame" . This script will provide a highly customizable interface to specify the higher timeframe period for the volume with the ability to link to the "HTF Candles by Prosum Solutions" indicator using the "HTF Setting Code" data point, as well as adjusting various styling options for the volume bar color fill and border.
Usage Information
The indicator can be applied to any chart at any time frame. When the "Chart" option is chosen for the "Timeframe" field, the indicator will attempt to find a higher timeframe resolution to ensure the volume bars are drawn. The indicator will simply accumulate the volume value for each candlestick bar and reset when the new high timeframe period has started. The color of the volume bars are relative to the higher timeframe setting so that you can visually interpret when the volume in a rising or falling state relative to the higher timeframe price action.
If you choose to add the "HTF Candles by Prosum Solutions" indicator, you can link this indicator to it by choosing the "HTF Candles" option for the "Timeframe Source" field and then choosing the "HTF Setting Code" option for the "HTF Candles" field. At this point, whenever you adjust the high timeframe setting in the "HTF Candles by Prosum Solutions" indicator, this indicator will automatically adjust the timeframe to match it, thereby reducing the steps you need to take to keep the two indicators in sync.
Enjoy! 👍

SpiceIn the chart photo is a description for each shape and letter, saying what each one is.
BB, Reversals are off by default.
BB + Reversals + Next bar confirmation - The way this should be used is by waiting for a 1 or 2 bar confirmation closed above/below the high/low of the Reversal candle. So if its a Top R, a yellow box will print as a confirmed 1 bar if it closed below the top R's low, then you can wait for the second bar to close also below the Top R's low. Vice versa with the Bot R.
RSI arrows - Essentially showing you when the multi time frame RSIs are coming back up above 30, or below 70. Respective to what time frames you have selected.
Three Line Strike - A trend continuation candlestick pattern consisting of four candles
Leledc Exhaustion suggest the trend may be reversing. Combined with the moving average as a trend filter, the indicator can signal the end of a pull back and the continuation of the trend.
EMAs - Help measuring the trend direction over a period of time.
Credit to all these amazing creators -
Multi Timeframe RSI (LTF) by @millerrh
3 Line Strike by @Lij_MC 'MarketVision A'
Leledc Exhaustion by @glaz, used updated version by @Joy_Bangla
If anyone uses the BB reversals source code to put into their own indicator/strategy, you are free to do so. Just send me a message I'd love to see your work with it! :)
Thanks to Lij_MC's MarketVision A indicator for inspiring me to add more features. At first it was just the RSI Arrows and the BB reversals candles + Condition but then I found MarketVision A and loved the extra Leledc and 3 Line Strike features.
Hope you enjoy this Spice!
No Signal is 100% correct at what it's trying to do. Use caution when trading!
Practice Risk Management.

S&P Sector PerformanceS&P Sector Performance calculate and display the logarithmic returns of SPX and each S&P Sector for a predefined timeframe or for a custom date.

[Round Numbers] Signal Clean Up Analysis with Backtest (TSO)Round Numbers NEW GEN indicator!
===========================================================================
===========================================================================
This is a full-cycle trading system indicator - it will show and alert each step of the trade from open to close. The algorithm here uses Round Numbers for generating signals, TP (Take Profit) and SL (Stop Loss) levels. Round numbers play big role in trading and can easily become strong support and resistance levels where price can bounce and go the opposite way or go through with a very nice run afterwards.
In addition there is a chained (NOTE: You can select several or ALL of the features, this is not limited to either one) signal cleanup and analysis approach with scheduling and alerting capabilities. Works with most popular timeframes: 1M, 3M, 5M, 15M, 30M, 1H, 4H, D.
NOTE: Every action of the trade is calculated on a confirmed closed candle bar state (barstate.isconfirmed), so the indicator will never repaint!
NOTE: At position open - there will be calculated Take-Profit and Stop-Loss targets, however each target is considered hit, when candle bar closes breaking that target, so Take-Profit and Stop-Loss when hit will slightly differ then what you see at trade/position open.
===========================================================================
===========================================================================
Round Numbers up|down unit setting and overall explanation
---------------------------------------------------------------------------
Round Number up|down unit: is the distance between round numbers on the chart. Since these round number levels are also used by the algorithm to open/close trades, it is important to set this setting to a logical number, which will correspond to an average price movement of the instrument.
Here are some examples for a few popular instruments on what will the default 1 round number unit correspond to and what would be suggested:
BTCUSD > $1 (this won't work for Bitcoin, try at least $100 - 100units)
SPY: > $1 (one of the best settings for SPY or QQQ, 50cents shows good results as well - 0.5units)
FOREX (all major pairs): > 10PIPs (that may be a bit small, unless scalping, try 50PIPs - 5units)
===========================================================================
===========================================================================
Explanation of all the Features | Strategy Configuration Guide | Indicator Settings | Signal Cleanup Analysis
---------------------------------------------------------------------------
>>> Customizable Backtesting for a specific date range, results via TradingView strategy, which includes “Deep Backtesting” for largest amounts of data on trading results.
>>> Trading Schedule with customizable trading daily time range, automatic closing/alert trades before Power Hour or right before market closes or leave it open until next day.
>>> 3 Trading Systems.
>>> Static/Dynamic/Trailing Take-Profit and Stop-Loss setups (HIGHLIGHT: Stop-Loss will be moved to Entry after TP1 is taken or a smart trailing Stop-Loss can be used with Stop-Loss dynamically following the trade to minimize risk).
>>> Single or Multiple profit targets (up to 5).
>>> Take-Profit customizable offset feature (set your Take-Profit targets slightly before everyone is expecting it!).
>>> Candle bar signal analysis (matching candle color, skip opposite structured and/or doji candle uncertain signals).
>>> Additional analysis of VWAP/EMA/ATR/EWO (Elliot Wave Oscillator)/Divergence MACD+RSI/Volume signal confirmation (clean up your chart with indicator showing only the best potential signals!).
>>> Advanced Alerts setup, which can be potentially setup with a trading bot over TradingView Webhook (NOTE: This will require advanced programming knowledge).
===========================================================================
Labels, plots, colors explanations:
---------------------------------------------------------------------------
>>>>> LONG open: green "house" looking arrow below candle bar.
>>>>> SHORT open: red "house" looking arrow above candle bar.
>>>>> LONG/SHORT take-profit target: green/red circles (multi-profit > TP2/3/4/5 smaller circles).
>>>>> LONG/SHORT stop-loss target: green/red + crosses.
>>>>> LONG/SHORT take-profit hits: green/red diamonds.
>>>>> LONG/SHORT stop-loss hits: green/red X-crosses.
>>>>> LONG/SHORT EOD (End of Day | Intraday style) close (profitable trade): green/red squares.
>>>>> LONG/SHORT EOD (End of Day | Intraday style) close (loss trade): green/red PLUS(+)-crosses.
===========================================================================
Date Range and Trading Schedule Settings
---------------------------------------------------------------------------
>>>>> Date Range: Select your start and/or end dates (uncheck “End” for indicator to show results up to the very moment and to use for LIVE trading) for backtesting results, if not using backtesting – uncheck “Start”/“End” to turn it off.
>>>>> Use TradingView “Strategy Tester” to see backtesting results
NOTE: If Strategy Tester does not show any results with Date Ranged fully unchecked, there may be an issue where a script opens a trade, but there is not enough TradingView power to set the Take-Profit and Stop-Loss and somehow an open trade gets stuck and never closes, so there are “no trades present”. In such case you will need to manually check “Start”/“End” dates or use “Depp Backtesting” feature!
>>>>> Trading Schedule: This is where you can setup Intraday Session or any custom session schedule you wish. Turn it ON. Select trading hours. Select EOD (End of Day) setting (NOTE: If it will be OFF, the indicator will assume you are holding your position open until next day!). Please note the EOD trade closure times with the 2 different Intraday close settings when turned on:
At Market Close:
1/3/5min > will close at 15:55pm ET
15min > will close at 15:45pm ET
30min > will close at 15:30pm ET
45min > will close at 15:45pm ET
60min > will close at 15:00pm ET
Before Power Hour:
1/3/5min > will close at 15:00pm ET
15min > will close at 15:00pm ET
30min > will close at 15:00pm ET
45min > will close at 15:00pm ET
60min > will close at 15:00pm ET
>>> Trading Systems: 1) "Open Until Closed by TP or SL": the signal will only open a trade if no trades are currently open/trunning, a trade can only be closed by Take Profit, Stop Loss or End of Day close (if turned on) | 2) "Open Until Closed by TP or SL + OCA": Same as 1), but if there is an opposite signal to the trade which is currently open > it will immediately be closed with new trade open or End of Day close (if turned on) | 3) "OCA (no TP or SL)": There are is Take Profit or Stop Loss, only an opposite signal will close current trade and open an opposite one or End of Day close (if turned on).
>>> Turn On/Off: Current Position SL + Opposite Position Open Signal on the same closing candle bar (If current trade hits Stop-Loss and at that same closing candle bar there is a signal for an opposite direction trade > indicator will close current position as Stop-Loss and immediately open an opposite position). NOTE: With this option turned on, there will be more trades, but not necessarily better results, since after Stop-Loss is hit, it may make sense to wait a little before opening an opposite trade, even if it matches the condition at the same time when Stop-Loss is hit, but sometimes it shows great results, so this setting/feature is included. NOTE: This setting only will work/make sense with TP and SL style/behavior both be set to "Fully Closed Candle"!
>>> Turn On/Off: Turn On/Off: Current Position REGULAR SL | Only the SL + Opposite Position Open will trigger if turned on, IF NOT - THERE WILL BE NO STOP-LOSS AT ALL!!! NOTE: It is very dangerous to trade without Stop-Loss!
>>>>> Signal Candle Bar consuming Take-Profits - position/trade signal candle bar is big enough to "consume"/close ahead the first TP setting > the signal can either be skipped, or all Take-Profit areas pushed ahead using smart formula)
>>>>> MULTIPROFIT | TP (Take-Profit) System: 1) Static – Once the trade is open, all Take-Profit target(s) are immediately calculated and set for the trade > once the target(s) is hit > trade will be partially closed (if candle bar closes beyond several Take-Profit targets > trade will be reduced accordingly to the amount of how many Take-Profit targets were hit) ||| 2) Dynamic – Once the trade is open, only the 1st Take-Profit target is calculated, once the 1st Take-Profit is hit > next Take-Profit distance is calculated based on the distance from trade Entry to where 1st Take-Profit was taken, once 2nd Take-Profit is taken > 3rd Take-Profit is calculated per same logic, these are good for price momentum as with price speeding up – profits increase as well!
>>>>> MULTIPROFIT: SL (stop loss) System | Static: SL is set at position open and remains such; Dynamic: Once ANY TP is taken > SL will be moved to Entry; Trailing: SL will be moved along the position (smart trailing stop-loss), at TP1 taken > SL moves to Entry, at TP2 taken > SL moves to TP1, at TP3 taken > SL moves to TP2 and so on.
>>>>> # of TPs (number of take profit targets): Just like it is named, this is where you select the number of Take-Profit targets for your trading system (NOTE: If "OCA (no TP or SL)" Trading System is selected, this setting won’t do anything, since there are no TP or SLs for that system).
>>>>> TP(s) offset: This is a special feature for all Take-Profit targets, where you can turn on a customizable offset, so that if the price is almost hitting the Take-Profit target, but never actually touches it > you will capture it. This is good to use with HHLL (Highest High Lowest Low), which is pretty much a Support/Resistance as often the price will nearly touch these strong areas and turn around…
===========================================================================
Dynamic/Static/Trailing Take-Profit and Stop-Loss visual examples:
---------------------------------------------------------------------------
1) Fully Static Take-Profit and Stop-Loss
This one is a fully static setup for both Take-Profit and Stop-Loss, you can also observe how trade is closed right before the Power Hour (trade can be closed right before Power Hour or right before Market Closes or left overnight as desired).
2) Static/Dynamic, Static Take-Profit and Dynamic Stop-Loss
You can see a static Take-Profit set at position open, while Stop-Loss moves to Entry once TP1 target is taken.
3) Static/Trailing, Static Take-Profit and Trailing Stop-Loss
In here with each Take-Profit taken, Stop-Loss moves along the trade to previous Take-Profit level, you can notice how stop-loss literally follows the trade and reduces the potential loss.
4) Dynamic/Trailing, Dynamic Take-Profit and Trailing Stop-Loss
See how Take-Profit distances increase with price momentum. Just like in previous example - Trailing Stop-Loss is following the trade and reducing the riks.
===========================================================================
Signal Analysis and Cleanup Settings
---------------------------------------------------------------------------
>>>>> Candle Analysis | Candle Color signal confirmation: If closed candle bar color does not match the signal direction > no trade will be open.
>>>>> Candle Analysis | Skip opposite candle signals: If closed candle bar color will match the signal direction, but candle structure will be opposite (for example: bearish green hammer, long high stick on top of a small green square) > no trade will be open.
>>>>> Candle Analysis | Skip doji candle signals: If closed candle bar will be the uncertain doji > no trade will be open.
>>>>> Divergence/Oscillator Analysis | EWO (Elliot Wave Oscillator) signal confirmation: LONG will only be open if at signal, EWO is green or will be at bullish slope (you can select which setting you desire), SHORT if EWO is red or will be at bearish slope.
>>>>> Divergence/Oscillator Analysis | VWAP signal confirmation: LONG will only be open if at signal, the price will be above VWAP, SHORT if below.
>>>>> Divergence/Oscillator Analysis | Moving Average signal confirmation: LONG will only be open if at signal, the price will be above selected Moving Average, SHORT if below.
>>>>> Divergence/Oscillator Analysis | ATR signal confirmation: LONG will only be open if at signal, the price will be above ATR, SHORT if below.
>>>>> Divergence/Oscillator Analysis | RSI + MACD signal confirmation: LONG will only be open if at signal, RSI + MACD will be bullish, SHORT if RSI + MACD will be bearish.
>>>>> Volume signal confirmation: LONG/SHORT will only be opened with strong Volume matching the signal direction, by default, strong Volume percentage is set to 150% and weak to 50%, but you can change it as you desire.
===========================================================================
||||||||||||||||||||||||||||||||||| *** ||||||||||||||||||||||||||||||||||| *** |||||||||||||||||||||||||||||||||||
||||||||||||||||||||||||||||||||||| *** ||||||||||||||||||||||||||||||||||| *** |||||||||||||||||||||||||||||||||||
TP System - VERY IMPORTANT INFO!
-------------------------------------------------------------------------------------------------------------------
"TP PERCENTAGE" - amount by which current trade/position needs to be reduced/partially closed/sold.
-------------------------------------------------------------------------------------------------------------------
TP System: Dynamic
"TP PERCENTAGE" - will always be the same amount (trade/position size divided by the # of take-profit(TP) targets) and percentage to be closed will always be of the ORIGINAL trade/position.
-------------------------------------------------------------------------------------------------------------------
TP System: Static
"TP PERCENTAGE" - will always be the same amount IF take-profit(TP) targets are hit 1-by-1 (TP1 > TP2 > TP3 > TP4 > TP5), otherwise it will vary and unless it is a 1st take-profit(TP1), the REMAINING trade/position size will always be smaller than original and therefore the percentage to be closed will always be of the REMAINING trade/position and NOT the original one!
-------------------------------------------------------------------------------------------------------------------
"TP PERCENTAGE" CheatSheet (these are the only percentages you may see)
-----------------------------------------------------------------------
TP PERCENTAGE---Close/Sell Amount-------------Example (trade size: 50 stocks)
20%-------------trade size * 0.2--------------50 * 0.2 = 10 stocks
25%-------------trade size * 0.25-------------50 * 0.25 = 12.5(~13) stocks
34%-------------trade size * 0.34-------------50 * 0.34 = 17 stocks
40%-------------trade size * 0.4--------------50 * 0.4 = 20 stocks
50%-------------trade size * 0.5--------------50 * 0.5 = 25 stocks
60%-------------trade size * 0.6--------------50 * 0.6 = 30 stocks
66%-------------trade size * 0.66-------------50 * 0.66 = 33 stocks
75%-------------trade size * 0.75-------------50 * 0.75 = 37.5(~38) stocks
80%-------------trade size * 0.8--------------50 * 0.8 = 40 stocks
100%------------trade size--------------------50 = 50 stocks
-----------------------------------------------------------------------
If for any reason a portion of the current/remaining trade closed at such occurrence was slightly wrong, it is not an issue. Such occurrences are rare and with slight difference in partial TP closed is not significant to overall performance of our algorithms.
||||||||||||||||||||||||||||||||||| *** ||||||||||||||||||||||||||||||||||| *** |||||||||||||||||||||||||||||||||||
||||||||||||||||||||||||||||||||||| *** ||||||||||||||||||||||||||||||||||| *** |||||||||||||||||||||||||||||||||||
Alert Settings (you don’t have to touch this section unless you will be using TradingView alerts through a Webhook to use with trading bot)
---------------------------------------------------------------------------
Here is how a LONG OPEN alert looks like.
NOTE: Each label , , etc. is customizable, you can change the text of it within indicator Input settings.
ALERT >>>>>>>>>>>>>>>>>>>>>>>>>>>>>>>>>>>>>>>>>>>>>>>
COIN: BTCUSD
TIMEFRAME: 15M
LONG: OPEN
ENTRY: 20000
TP1: 20500
TP2: 21000
TP3: 21500
TP4: 22500
TP5: 23500
SL: 19000
Leverage: 0
---------------------------------------------------------------------------
Here is how a TP1 alert will look with 5 TPs breakdown of the trade.
NOTE1: Next to TP1 taken it will show at which price it was triggered.
NOTE2: Next to "TP Percentage" it shows how much of the CURRENT/ACTIVE/REMAINING trade needs to be closed.
NOTE2: If TP2/3/4/5 comes before TP1 - the alert will tell you exactly how many percent of the trade needs to be closed!
ALERT >>>>>>>>>>>>>>>>>>>>>>>>>>>>>>>>>>>>>>>>>>>>>>>
COIN: BTCUSD
TIMEFRAME: 15M
LONG: TP1
TP1: 20500
TP Percentage: 20%
---------------------------------------------------------------------------
Here is how an alert will look for LONG - STOP-LOSS.
ALERT >>>>>>>>>>>>>>>>>>>>>>>>>>>>>>>>>>>>>>>>>>>>>>>
COIN: BTCUSD
TIMEFRAME: 15M
ENTRY: 20000
LONG: SL
SL: 19000
---------------------------------------------------------------------------
Here is how an alert will look for LONG - EOD (End of Day) In Profit close.
ALERT >>>>>>>>>>>>>>>>>>>>>>>>>>>>>>>>>>>>>>>>>>>>>>>
COIN: BTCUSD
TIMEFRAME: 15M
LONG: EOD-Close (profit)
ENTRY: 20000
EOD-Close: 21900
===========================================================================
Adding Alerts in TradngView
---------------------------------------------------------------------------
-Add indicator to chart and make sure the correct strategy is configured (check Backtesting results)
-Right-click anywhere on the TradingView chart
-Click on Add alert
-Condition: Select this indicator by it’s name
-Immediately below, change it to "alert() function calls only", as other wise there will be 2 alerts for every alert!
-Expiration: Open-ended (that may require higher tier TradingView account, otherwise the alert will need to be occasionally re-triggered)
-Alert name: Whatever you desire
-Hit “Create”
-Note: If you change ANY Settings within the indicator – you must DELETE the current alert and create a new one per steps above, otherwise it will continue triggering alerts per old Settings!
===========================================================================
If you have any questions or issues with the indicator, please message me directly via TradingView.
---------------------------------------------------------------------------
Good Luck! (NOTE: Trading is very risky, past performance is not necessarily indicative of future results, so please trade responsibly!)
---------------------------------------------------------------------------
NOTE: There seems to be a strange glitch when strategy is running live, it will show "double-take" take-profits labels on the chart. This is not affecting the script logic and backtesting results, if you simply change the timeframe real quick to something else then back - it will no longer show the duplicate orders... this must be some sort of a glitch as every alert was thoroughly tested to make sure everything is working!
