BFXLS100This is the popular Bitfinex margin Longs/Shorts overlay script made compatible with other exchanges. So you can for example use it with BitMEXT XBTUSD and it will still plot Bitfinex BTCUSD.
It always plots data for the same currency pair, so for ETHUSD of any exchange, it will always plot Bitfinex ETHUSD margin data.
สกุลเงินดิจิตอล

Helios - by @cryptomrdavis -
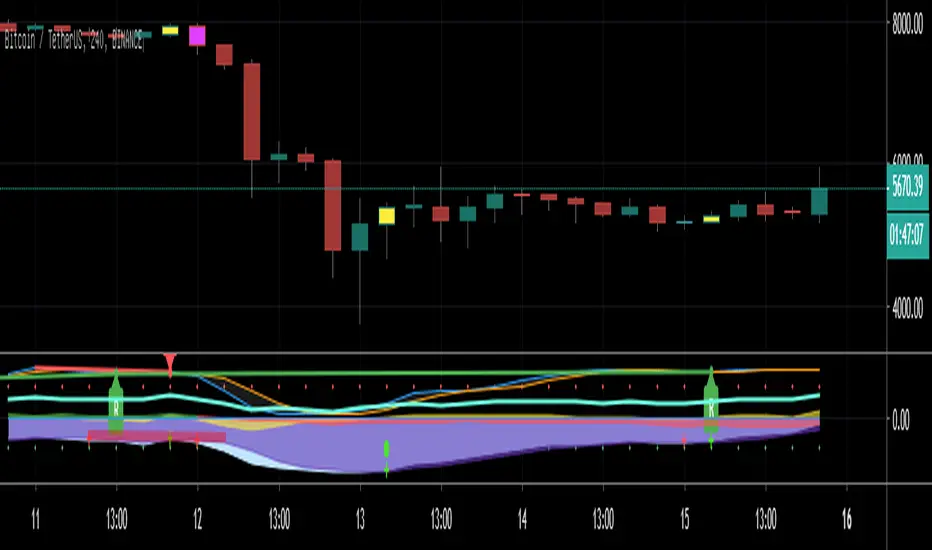
Helios is a simple to use oscillator.
It represent the state of different indicators at the moment. If you see a small green column, that means that only one or few indicators are getting into the positiv area, wait for higher bars to get into a trade. Same thing on the red bars side.
Calculation is based on few indicators like RSI , MACD , EMA , SMA and some more.
Happy trading
+++ use this tool on your own risk. i'm not responsible for your loses +++
Show some ❤
____________________________________________________________________________
BTC: 1GVRDK3HHr9CKM5SF2CGpCNXFuavB3L4j9
ETH: 0x7b825fa752b9926D3E8397cDb1d9E5473D074646
XMR: 41zL2SQS7zyZmwXKng2TeUWsMi5vMmkgSdDCjULUTvM6ichwm1E2ZDEYGt56zk9ghoM9bekhjycSwa8amtTcB2JiUet5jtg
NEO: AXja5xPDhczfm2ujHyBfpkQAAnMsXsazmb
ZEC: zcZzFkRx95cp7MtuW8wLhC5zz5RYF9QkT2uPPmhZZHc6ppXepHGgCSeAS1rtD6WFdqsM5p1gZm2gfirnrnviucsdP4aCpqU
XLM: GAXUQJSW55C7MAC4GI26NZUGIKSHFDVFRFKZCXPLMPY4HCADSDT55XK6
WAVES: 3PCMkNpMHxSraTCkwV1ENcBKa9sXbVCGjQX
BCH: qz57n04ud6mn42u00aymqkku8tfh0lk4jv9c28mjvv
____________________________________________________________________________
++++ cryptotradingresource.com ++++
____________________________________________________________________________

Gravity Swing Oscillator V1 - optimized for CryptoGravity Swing Oscillator V1 - optimized for Crypto
- Top & Bottoms
- Buy / Sell Signals on colorchanging LED Dots
- can show danger Price Dop Zones on Bars
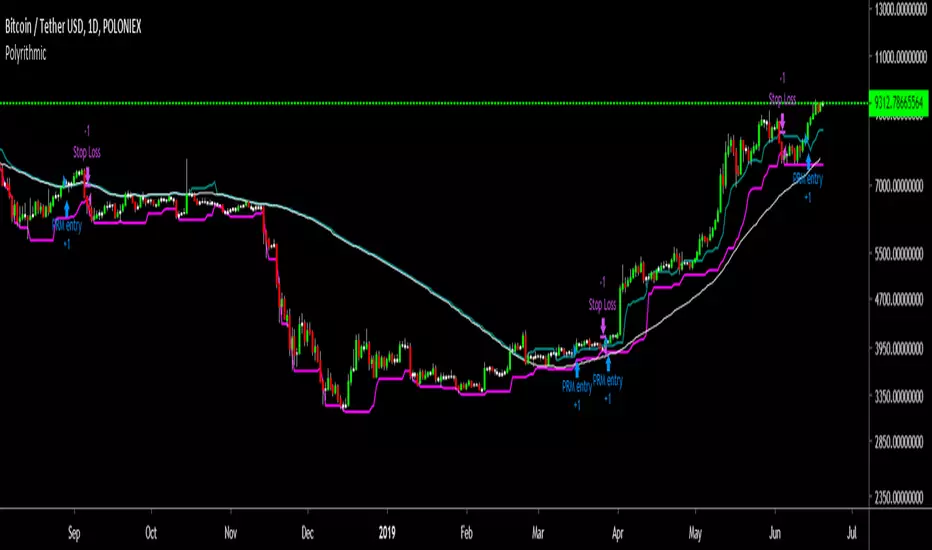
Polyrithmic Trend 2This script is designed to work on cryptocurrency.
This idea is to capture large amounts of the trend but to be able to get out when the support begins to break.
To use this script:
Buy signal:
- When the price is above the white moving average
- When the price goes over the buy line (higher / blue)
- When trading view says buy
Sell signal
- Move a stop up with the pink line and wait to be stopped out
Buy & Sell - TRXBTC:BINANCE 4H Automated StrategyWith this indicator you can create Buy and Sell alerts to automate your trading.
Optimised for BINANCE:TRXBTC in a 4H timeframe.
> > > READ HOW IT WORKS < < <
> > > HOW TO USE < < <
> Get access to the Cyatophilum Indicators <

Cyatophilum Altcoins Trader [ALERTSETUP]A generic Indicator built on Parabolic Stop And Reverse
Optimised for trading altcoins. Up to 8 automated alerts.
> > > READ HOW TO USE < < <
Get access to the Cyatophilum Indicators !

PpSignal ADX/DI HistogramHere we have the ADX with DM histogram signal, and volatile Bollinger Band (period 13, Deviation 0.61).
the best signal is when adx is into volatility and dm histogram is going in the same directions.
For example if you detect a up channel...you will buy when DMI histogram is in buy signal (green) and Adx is abobe the bollinguer band. and in e green color.

Buy & Sell - BTCUSDT:BINANCE 2H by CyatophilumWith this script you can create Buy and Sell alerts to automate your trading.
Configured for BINANCE:BTCUSDT in 2H timeframe.
> > > READ HOW IT WORKS < < <
> > > HOW TO USE < < <
Get the indicator today !

PpSignal Fractal Adaptive Moving AverageThe Fractal Adaptive Moving Average (FRAMA) is an intelligent, adaptive moving average that was developed by John Ehlers. It takes the importance of price changes into account and follows price closely with significant moves while remaining flat if price ranges. The FRAMA takes advantage of the fact that markets are fractal and dynamically adjusts the lookback period based on this fractal geometry. The actual calculation is very elaborate and complicated. The FRAMA is often used in combination with other signals and analysis techniques.
www.stockspotter.com
www.metatrader5.com

Buy & Sell - BTCUSD:COINBASE 2H Automated StrategyWith this script you can create Buy and Sell alerts to automate your trading.
> > > READ HOW IT WORKS < < <
> > > HOW TO USE < < <
Get the indicator today !

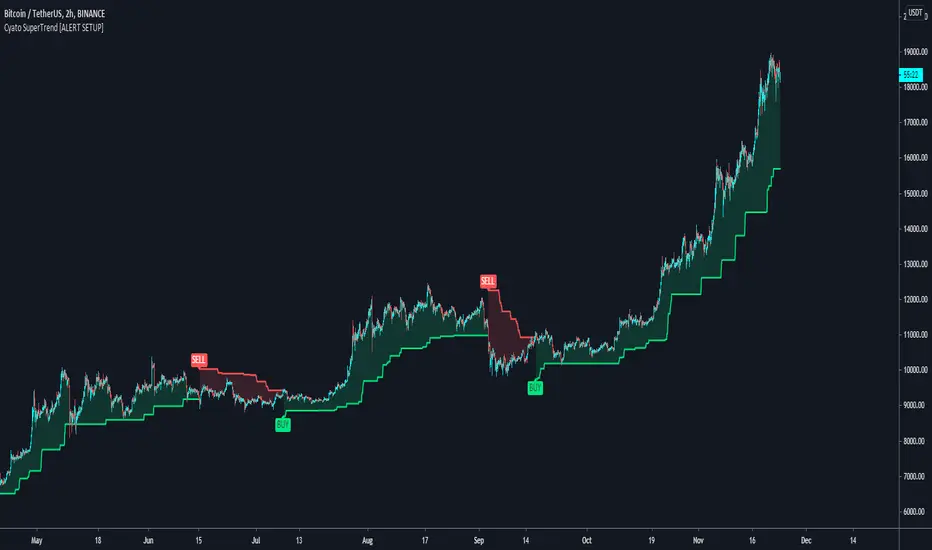
Cyatophilum SuperTrend [ALERT SETUP]Cyatophilum SuperTrend V1
A multi-timeframe indicator with Buy and Sell Alerts, built on ATR. (Averate True Range).
The SuperTrend line can be used as support when green, and resistance when red.
Reversals are strong buy/sell signals but perform badly in range markets.
PpSignal Vortex Indicatorthis indicator is ideal for use in price action technique.
ii you are detect en down or up channel, support resistance, triangle, etc...you can use the vortex indicator for find a good signal.
Look the example picture.
www.mql5.com

Main Indicators @ MadnessCryptoInspired by veteran contributors of tradingview
Indicators list:
1. Main indicators: Moving average collection, Ichimoku, Bollinger Bands, fibonanci, simplize candlestick price action...
2. Price Action indicators: Candlesticks of (almost) any kinds. Harmonic Patterns: ABCD, Alt Bat, Butterfly, Crab, Wolf Wave, Head and Shoulders, Triangle...
3. Advanced indicators: top/bot finder, breakout detector, unpopular indicators
4. Signal & backtest tools: focus on two main factors: percent profitable & profit factor
Cheers,
Madness Crypto
-----------------------------------------------------------
Incase if those's scripts are useful, you can buy me a coffee
ETH & ERC20 tokens: 0xA2F57Cc46A5268F16A0224a81EDe7154218Ce890
Bitcoin: 1PTSbWK6snVSULBXhfx5TD9pJkkYCDe4PC
Binance & BEP2 tokens: bnb1tlxgpnguzq0w3w6myhd0t3d2j9wqd2pzpkudpc

FREE BACKTEST STRATEGY BTC/USDT 15m Binance LONGA long only strategy for trading BINANCE:BTCUSDT in a 15m timeframe built upon Donchian Channels.
The script is already configured for this market /timeframe.
I built it using my generic version that you can request access by leaving a comment:
To get access to the alert setup version and automate the strategy, you need to purchase a subscription on my website .
Thanks for the feedback/support !

PpSignal Spread Between Stock and Reference Index ALARM
this is the overlay PpSignal Spread Between Stock and Reference Index...


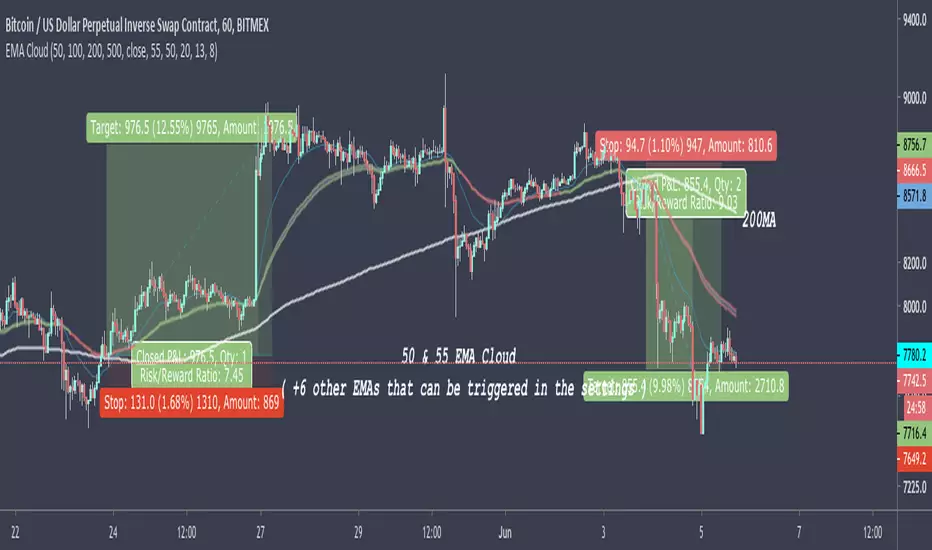
50 & 55 EMA CloudAfter testing thousands of indicators over the years, this simple EMA cloud indicator that I built is still my main weapon. It's always the first one I add to a blank charts and that is not going to change anytime soon.
I find EMAs and MAs are such underrated tools, By observing the price action surrounding these, I can see straight away if it's a good time to get into a trade or not.
As seen here, I also use the 200MA along with the 50/55EMA cloud to find extra strong support and resistances. If price starts to reject both the cloud and the 200MA at the same time/level, then it's a very good indication the price is going to make a big move in that direction as seen here in this chart.
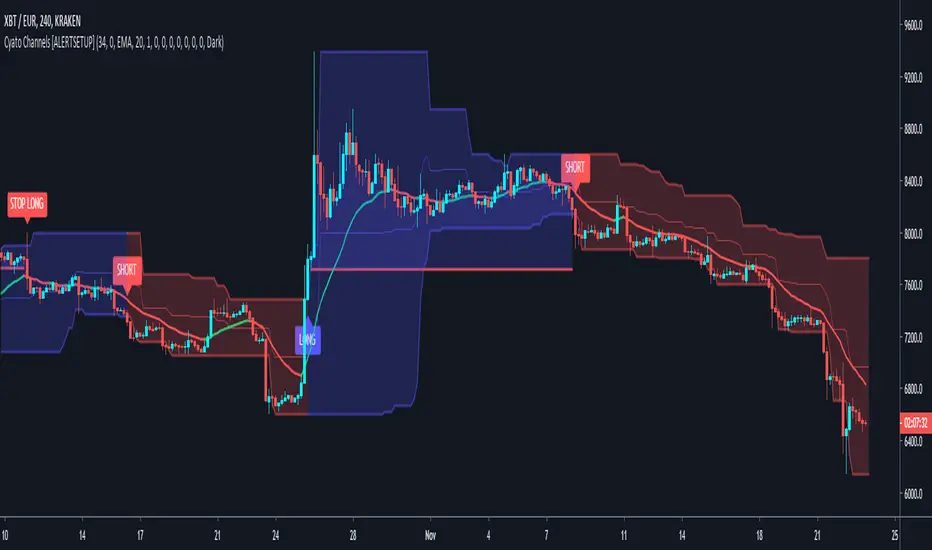
Cyatophilum Channels Pro Trader [ALERTSETUP]The generic Alert Setup for Cyatophilum Channels Pro Trader
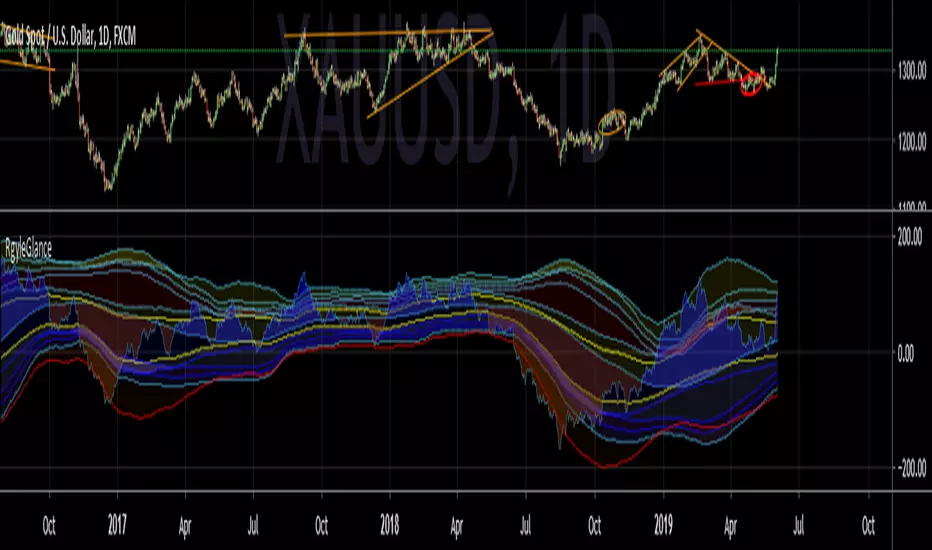
This Indicator Help you to Look at Chart at Glance THE BEST INDICATOR SO FOR CREATED ,
5 YEARS OF TRADING EXPERIENCE
EASILY CAN READ DIVERGENCE ,
TREND,
CAN PREDICT EXIT , ENTRY EARLIER .
I DIDN`T ARRANGED COLORS PROPERLY ,
SPEND SOME TIME USE THE INDICATOR AND READ CHART
IT REALLY HELPS
BestFollowTrendBest for beggining traders.. to follow TRENDS... and Remember.. TREND IS YOURE FRIEND !!!

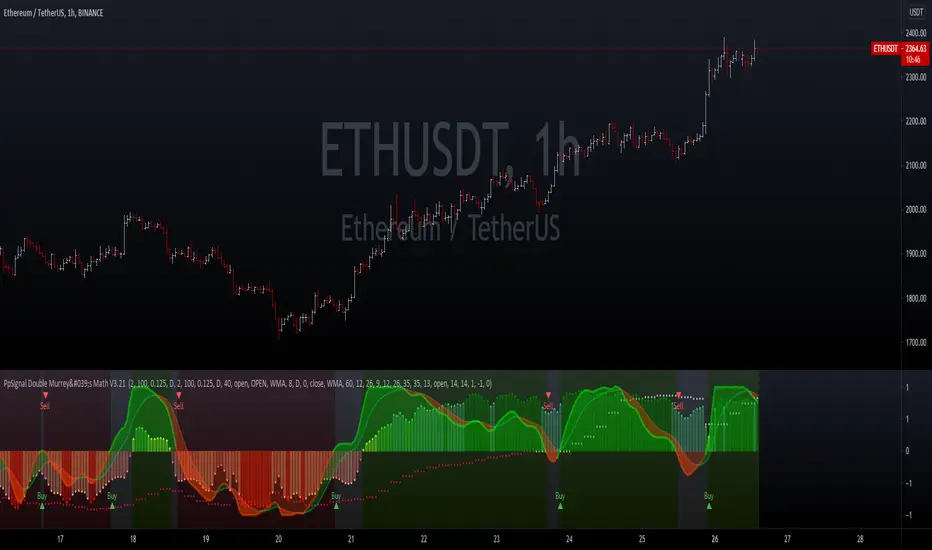
PpSIgnal Murrey's Maththan to @ucsgears, this is the Murray math oscillator, i changed internal atr configuration. the original code you can see in ucsgears profile.
tradingstrategyguides.com
PpSignal Stoch Jake Bernstein , Aroon, Ewo and T3 Velocityfour indicator in one, You can choice in option Stochastic Jake Bernstein Method, Aroon, Ewo or T3 Velocity

Pump Finder v1.0Generally speaking, when a big pump occurs one can expect the price to trend upward.
This script is by default well suited for timeframes larger than 15m. Use on smaller timeframes at your own risk.
When combined with basic TA like trendlines, support and resistance this can be a very powerful indicator.
This indicator performs well for the larger volume crypto's like BTC, BNB, ETH etc. See snapshots below.
Be aware:
- After multiple pumps, the chance of trend reversal becomes more likely.
- False breakouts.
- Always do your own research.
If you have any suggestions, feel free to let me know.
