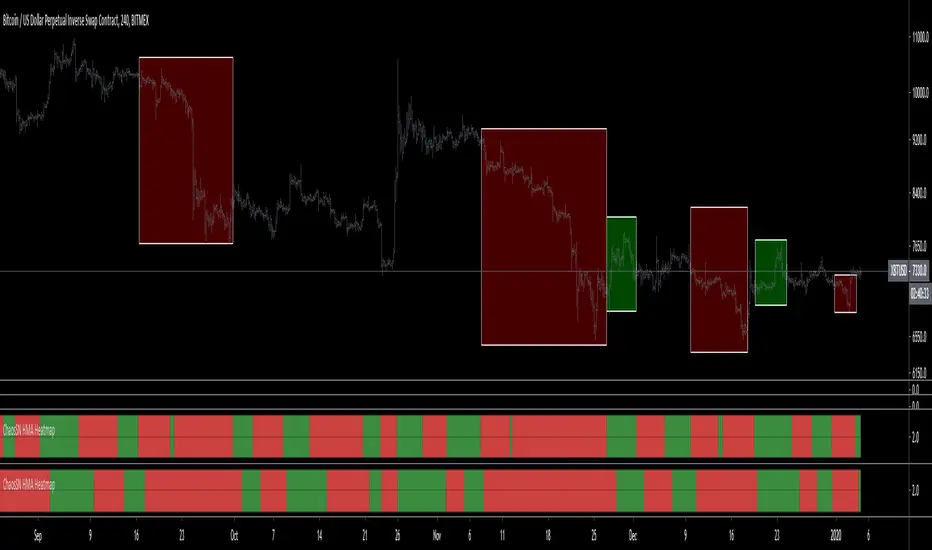
ChaosSN HMA Crossover HeatmapUsed to colour code when one hourly MA crosses over another (default is 50 Hourly MA over 100 Hourly MA). Can be stacked together for different MA pairs as a leading visual cue for trend changes.
This is for the hourly MA and it works on all timeframes below 1D.
Crossover
SMA Cross Entry & Exit StrategyThis is a TradingView Strategy Script meaning you can't execute real trades using your exchange API connected to your TradingView account, it is designed for backtesting only
This is a basic backtesting script for charting the bullish and bearish cross of two user defined simple moving averages, select the cog next to the name of the script ON the price chart in the left hand corner. The script will print to the screen either "Long Entry" or "Short Entry" depending on the direction of the cross. The script using TradingView strategies will subsequently close the opposite of the position that is executed when the bullish or bearish cross occurs. Simply put, if you are short and a bullish cross occurs, your short trade will close and be logged in strategies and the long will fire. You can pyramid the long and short positions to continue entering as long as the trend doesn't flip. You will find this in the script settings. Since this script is for backtesting you can manually set the "backtesting range" for TradingView Strategies and firing the "Long Entry" and "Short Entry". This as well, is in the settings.
Notice: When the SMA cross occurs, you have to wait till the next candle before TradingView Strategy will print the "Long Entry" or "Short Entry" to the screen
TradingView - How To Use Strategies: www.tradingview.com

Hashem OBV (V2)HASHEM OBV (V2)
The OBV is one of the most powerful indicators for spotting divergences and local highs and lows.
This OBV is trapped in a channel between -100 and 100. the Fast OBV is smoothed by 2 (Default) and the Slow OBV is smoothed by 4 (Editable) .
The Idea is when the Fast OBV crosses the Slow it's a setup. when this cross happens on the Top and Bottom Zones it'll have more weight.
The Difference between the Fast and Slow is shown on the Zero Line. when the slope of it is positive it means the previous setup is being played. But when it comes to 0 or/and Reverse, it means the previous setup is either played or it'll not be played.
Also, an EMA and SMA (source form Slow OBV ) are included. the EMA is used for Support/Resistance and the SMA is used for its Slope and the position in the Zones .
NOTE THAT THIS IS NOT A SIGNALING INDICATOR, YOU MUST CONFIRM THEM WITH YOUR OWN TA.

(JS) Ultimate RSISo my goal here was to combine all of my RSI ideas into a single indicator in order to make kind of a "Swiss Army Knife" version of the Relative Strength Index ...
------------------------------------------------------------------------------------------------------------------------------------------------------------------------------------------------------------------------------------------------------------------
So, let's begin with the first RSI indicator I made, which is the RSIDVW (Divergence/Volume Weighted);
To rephrase my original post, the "divergence/volume weighted" portion is meant to expand upon the current RSI format by adding more variables into the equation.
The standard RSI is based off one value that you select (open, close, OHLC4, HLC3, etc.) while this version takes three variables into account.
The default setting is to have RSI normal without anything added to it (Divergence Weight = 0)
1st - it takes the standard variable that RSI normally uses.
2nd - it factors RSI divergence by taking the RSI change % and price change % to form a ratio. Using this ratio, I duplicated the RSI formula and created a divergence RS to be factored in with the standard price RS .
3rd - it takes Relative Volume and amplifies/weakens the move based upon volume confirmation. (So if Relative Volume for a price bar is 1.0, the RSI plot would be the same as it normally would)
So to explain the parameters
- Relative Volume Length: This uses the RV length you specify to determine spikes in volume (or lack of volume ), which then is added into the formula to influence the strength of the RSI move
- RV x Divergence: This is how I calculated the original formula, but you can leave this unchecked to turn Relative Volume off, or apply elsewhere.
- RV x RS: There's two sides, Divergence RS and Standard RS - these check marks allow you to select which part you prefer to be multiplied by Relative Volume .
Checking neither turns off Relative Volume , while checking both amplifies its effects by placing it on both sides of the equation.
-Divergence Weight: This controls how much the DVW portion of the formula influences the RSI plot. As I referred to earlier, default is 0 making RSI normal. The Scale is 0-2, so 1.0 would be the same as 50%.
When I do have DVW on, I generally set it to 0.5
-SMA Divergence: To smooth, or not to smooth, that is the question. UJsing an SMA here is much smoother in my opinon, but leaving it unchecked runs it through an RMA the same way standard RSI is calculated.
-Show Fractal Channel: This allows you to see the whole fractal channel around the RSI (This portion of the code, compliments of the original Ricardo Santos fractal script)
------------------------------------------------------------------------------------------------------------------------------------------------------------------------------------------------------------------------------------------------------------------
The next portion of the script is adding a "Slow RSI"...
This is rather simple really, it allows you to add a second RSI plot so that you can watch for crossovers between fast and slow lines.
-Slow RSI: This turns on the second RSI Plot.
-Slow RSI Length: This determines the length of the second RSI Plot.
------------------------------------------------------------------------------------------------------------------------------------------------------------------------------------------------------------------------------------------------------------------
Pivot Point RSI was something a friend of mine requested I make which turned out pretty cool, I thought... It is also available in this indicator.
-Pivot Points: Selecting this enables the rest of the pivot point related parts of the script
If Pivot Points isn't selected, none of the following things will work
-Plot Pivot: Plots the pivot point .
-Plot S1/R1: Plots S1/R1.
-Plot S2/R2: Plots S2/R2.
-Plot S3/R3: Plots S3/R3.
-Plot S4/R4: Plots S4/R4.
-Plot S5/R5: Plots S5/R5.
-Plot Halfway Points: Plots a line between each pivot .
-Show Pivot Labels: Shows the proper label for each pivot .
When using intraday charts, from a 15 minute interval or less the pivots are calculated based on a single days worth of price action, above that the distance expands.
Here are the current resolutions Pivot Points will work with:
Minutes - 1 , 2, 3, 5, 10, 13, 15, 20, 30, 39, 78, 130, 195
Hours - 1, 2, 3, 4, 5, 6
Daily
Weekly
Currently not available on seconds or monthly
------------------------------------------------------------------------------------------------------------------------------------------------------------------------------------------------------------------------------------------------------------------
Background Colors
Background Colors: I have six color schemes I created for this which can be toggled here (they can be edited).
Gray Background for Dark Mode: Having this on looks much better when using dark mode on your charts.
------------------------------------------------------------------------------------------------------------------------------------------------------------------------------------------------------------------------------------------------------------------
Now finally the last portion, Fibonacci Levels
-Fibonacci Levels: This is off, by default, which then uses the standard levels on RSI (30-50-70). When turned on, it removes these and marks fib levels from 0.146 through 0.886.
------------------------------------------------------------------------------------------------------------------------------------------------------------------------------------------------------------------------------------------------------------------
So the quick rundown:
Ultimate RSI contains "divergence/volume weighted" modifications, a slow RSI plot, pivot points , and Fibonacci levels all while auto-plotting divergence and having the trend illustrated in the background colors.
RSI has always been my "go to" indicator, so I hope you all enjoy this as much as I do!

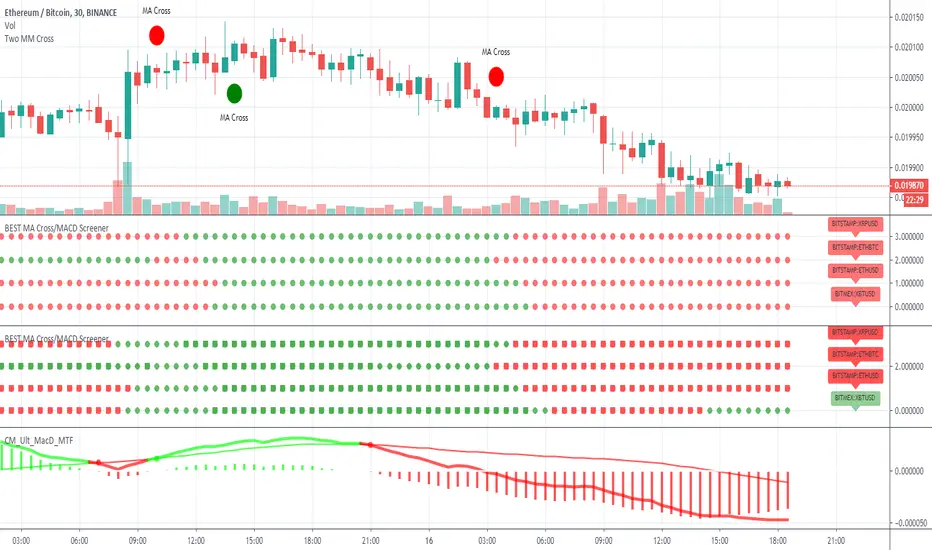
BEST MA Cross/MACD ScreenerHello traders
Continuing deeper and stronger with the screeners' educational serie one more time
I - Concept
This is the first flexible screener I'm releasing. Screener detecting a convergence whenever the MACD and MM cross are giving a signal in the same direction.
Those who know me from TradingView ... are aware that I'm big on convergences. I totally think that 1 indicator isn't enough - whatever the timeframe.
But building my own convergence detection systems has been fruitful for me
II - How did I set the screener
The visual signals are as follow:
- square: MACD + MA cross convergence.
- diamond: Only MACD is selected
- circle: Only MA cross is selected
Then the colors are:
- green when bullish
- red when bearish
Example
Below, I highlighted why we see diamonds on the top screener panel. This is because I only selected the MACD filter
Cool Hacks
Don't forget that you can add the same indicator multiple times on your chart :)
Wishing you all the BEST trading
Dave
SNDTOsc - MTFSNDTOsc helps identify when a market is in a good position to identify an entry.
This indicator requires a bit of manual judgement and tweaking for specific markets. In a higher volatility market, use 1 to catch the quicker price movements. In low volatility, use 4. I normally flip between 1 and 2 with an occasional 3 or 4 in the higher timeframe if I need to determine the trend.
Pay attention to the color and position of the columns because they measure the higher timeframe's current bullish/bearish strength:
Lime - Bullish zone
Green - Potentially exhausted bullish zone
Pink - Bearish zone
Maroon - Potentially exhausted bearish zone
A few simple rules to filter out hasty entries:
HTF (Higher timeframe) - Lime
Look for a long entry upon a bullish crossover (red above blue) as long as the crossover is below the overbought zone.
HTF - Green
No new long positions. Look for short position upon bearish crossover.
HTF - Pink
Look for a short entry upon a bearish crossover as long as crossover is above oversold zone
HTF - Red
No new short positions. Look for long position upon bullish crossover

MAC-Z VWAP with divs & MACD Leader [ChuckBanger]This script is VWAP version of my MAC-Z indicator:
Right now it is my personal favorite. You can use it to spot divergences in both histogram and on the MAZ-Z line. You can also trade the MAC-Z line and its signal line crossovers. It also has MACD Leader crossover built in. MACD leader crossovers is indicated with a vertical line. Green for bullish and red for bearish.
Other signals
Green + = Bullish Divergence (Strong signal)
Red - = Bearish Divergence (Strong signal)
Green + = Hidden Bullish Divergence (Weak signal)
Red - = Hidden Bearish Divergence (Weak signal)
Green dot = Histgram crosses over zero line (Bullish signal)
Red dot = Histgram crosses below zero line (Bearish signal)

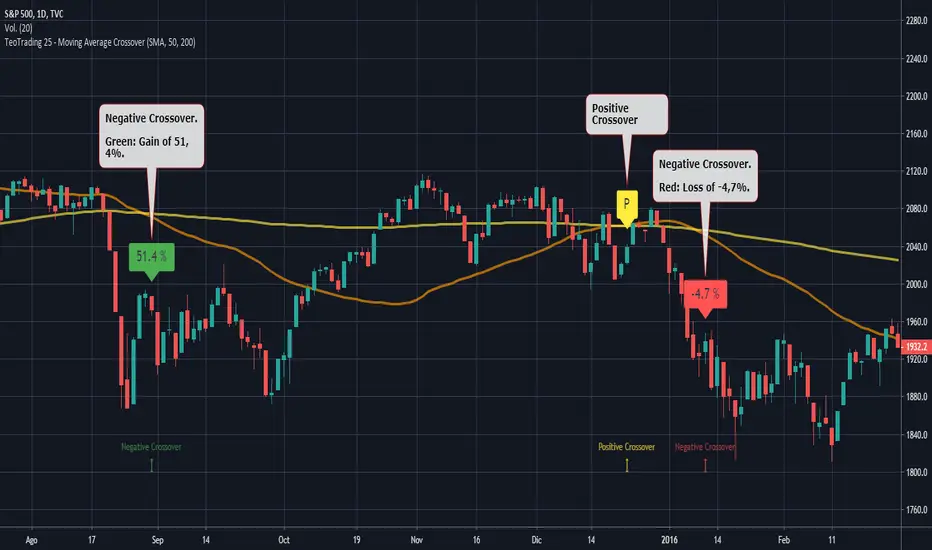
TeoTrading 25 - Moving Average CrossoverThis Script prints different types of moving Average: SMA, EMA, WMA and VWMA.
It is usefull to view in only few minutes differents crossovers.
The crossver´s are indicated with:
Yellow "P": Positive Crossover
Green: Negative Crossover with gain.
Red: Negative Crossover with Loss.
The Percents of gain and loss are indicated in the Negative Crossovers.
Input Parameters:
Type_: Type of Moving Average.
PrintPrice: Enable open value print.
Fast: Fast Moving Average.
Slow: Slow Moving Average.
This indicator does not generate recommendations to buy or to sell. It was designed for educational purposes.
Market Adaptive Stop-LossI realized that the zone changes in the stoploss remained slow, so I couldn't make enough use of the characteristics of technical indicators when opening positions.
This pushed me to keep stop-loss under the influence of a dependent variable.
This script helped me a lot (everget) :
I've redesigned the stop-loss to be affected by intersections.
Therefore, this script is also suitable for adaptive moving averages, fractional periods.
Script features:
1.You can select calculation methods created by using various technical analysis methods from the scripts' settings:
-Moving Average Convergence Divergence ( Macd )
-Stochastic Oscillator ( Stoch )
-Stochastic Relative Strength Index (StochRSI)
-Stochastic Money Flow Index (StochMFI ) (More info : )
-Know Sure Thing ( KST )
-OBV ( On Balance Volume )
-SMA ( Simple Moving Average )
-EMA ( Exponential Moving Average )
-FISHERTRANSFORM ( Fisher Transform )
-AWESOMEOSCILLATOR( Awesome Oscillator )
-PSAR ( Parabolic Stop and Reverse - Parabolic SAR )
-HULLMA( Hull Moving Average )
-VWMA ( Volume Weighted Moving Average )
-RMA (Moving Average using in Relative Strength Index calculations.)
-COG (Center of Gravity )
-ACC-DIST ( Accumulation / Distribution Index )
2 - The region is determined according to the above calculation methods and if it is larger or smaller than the previous stop loss level.
And if the price in the negative zone is lower than the stoploss, it is the exact signal and is shown with more highlighted colors.
And, in the positive zone, where the price is greater than the stoploss, the trade zones are certain.
Shown with more highlighted colors.
If the zones are correct but stop-loss is not suitable for opening positions:
In other words, if the stop-loss is above/under the highest-lowest levels in the positive zone or if the stop loss is located in the lower zone in the negative zone, these zones are shown to be darker and dimmed so that they do not cause false movements.
*** SUMMARY : As a result, you can use this script with support and resistances,and trend lines to get good results.
I hope it helps in your analyzes. Best regards.

MAC-Z & MACD Leader signal [ChuckBanger]This is a combination of my MACD Leader script and MAC-Z with option to add Laguerre filter. The advantage of the MAC-Z over MACD is that it is a more accurate and “assumption-free” indicator that can more accurately describe how a market actually perform. But you can use this as a regular MACD indicator.
Crossovers signals
The MAC-Z line and signal line can be utilized in the same way as a stochastic oscillator, with the crossover between the two lines providing buy and sell signals. As with most crossover strategies, a buy signal comes when the shorter-term, more reactive line – in this case the MAC-Z line (blue line) crosses above the slower signal line (orange line). For example, when the MAC-Z line crosses below the signal line it provides a bearish sell signal.
Zero line crossing
The zero cross strategy is based on either of the lines crossing the zero line. If the MAC-Z crosses the zero line from below, it is a signal for a possible new uptrend, while the MAC-Z crossing from above is a signal that a new downtrend may be starting. This is special powerful if the lines has a fast up or down movement but the price action doesn't reflect that movement.
Divergences
Bearish and bullish divergences is my favorite signals. When price action and oscillators follow the same path it is called Convergences, when they don’t, it’s called a Divergence. Don't confuse the two because they have not the same meaning. But be aware that for example during consolidation or low liquidity, some small divergences between price and indicators might form, but that doesn't mean we should consider them as real divergences.
There is many different types of divergences. It is easier to show a picture then explaining it so I recommend you to check out the link below. Especially the top image. It sums this up very well
medium.com
MACD Leader
The MACD leader is only showing the crossing of MACD as a vertical line
Green vertical line = MACD Leader Bullish Cross
Red vertical line = MACD Leader Bearish Cross
MACD Leader:
MAC-Z:
More Information
cssanalytics.wordpress.com
en.wikipedia.org
drive.google.com

150MA Cross BuyAndSell Strategy [d3nv3r]This is a Buy And Sell Strategy I haven't seen anywhere so i share mine.
Used on Bitcoin - daily chart - the strategy generate sell and buy indicator on crossover and crossunder the 150 simple moving average.

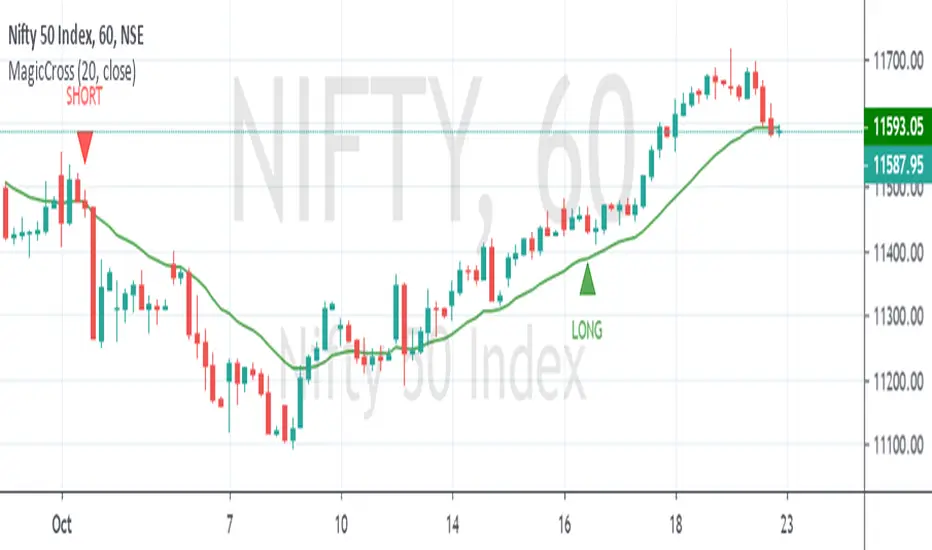
Magic Cross SignalEnter when subsequent candle of Buy or Sell signal breaks high or low respectively. Stop-loss low/high of the signal bar. Book when candle touches MA line on closing basis.
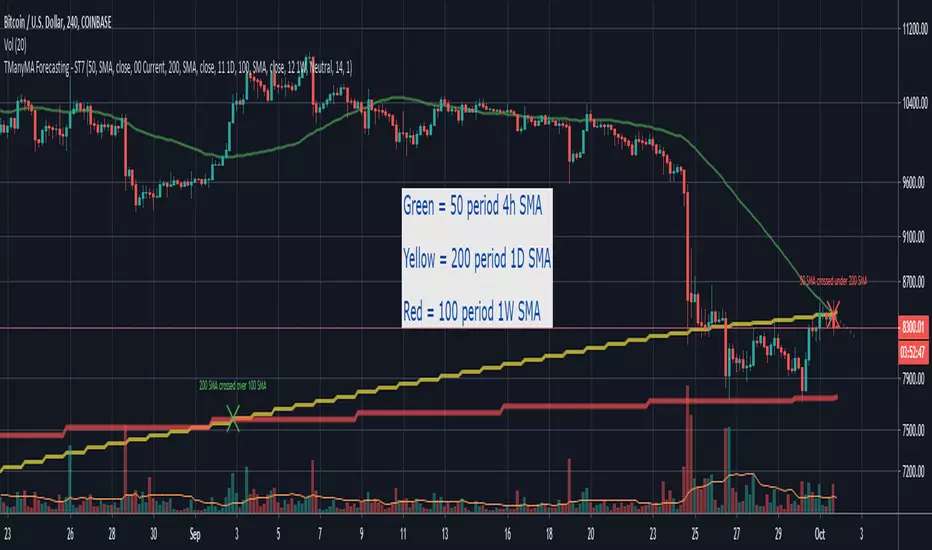
Scripting Tutorial 9 - TManyMA Strategy - Long Market Order OnlyThis script is for a triple moving average strategy where the user can select from different types of moving averages, price sources, lookback periods and resolutions.
Features:
- 3 Moving Averages with variable MA types, periods, price sources, resolutions and the ability to disable each individually
- Crossovers are plotted on the chart with detailed information regarding the crossover (Ex: 50 SMA crossed over 200 SMA )
- Forecasting available for all three MAs. MA values are forecasted 5 values out and plotted as if a continuation to the MA.
- Forecast bias also applies to all forecasting. Bias means we can forecast based on an anticipated bullish, bearish or neutral direction in the market.
- To understand bias, please read the source code, or if you can't read the code just send me a message on here or Twitter. Twitter should be linked to my profile.
- Ribbons added and on by default. Optional setting to disable the ribbons. 5 ribbons between MA1 and MA2 and another 5 between MA2 and MA3.
- Ribbons are alpha-color coded based on their relation to their default MAs.
- Ribbons are only visible between MAs if the MAs being compared share the same Type, Resolution, and Source because there is no way to consolidate those three in a simple manner.
- Ribbon values are calculated based on calculated MA Periods between the MAs.
- Converted the existing study into a strategy
- Strategy only enters long positions with a market order when MA crossovers occur
- Strategy exits positions when crossunders occur
- Trades 100% of the equity with one order/position by default
- Ability to disable trading certain crosses with input checks
This script is meant as an educational script with well-formatted styling, and references for specific functions.
*** PLEASE NOTE - THIS STRATEGY IS MEANT FOR LEARNING PURPOSES. DEPENDING ON IT'S CONFIGURATION IT MAY OR MAY NOT BE USEFUL FOR ACTUAL TRADING. THE STRATEGY IS NOT FINANCIAL ADVICE ***


Scripting Tutorial 8 - Triple Many Moving Averages RibbonsThis script is for a triple moving average indicator where the user can select from different types of moving averages, price sources, lookback periods and resolutions.
Features:
- 3 Moving Averages with variable MA types, periods, price sources, resolutions and the ability to disable each individually
- Crossovers are plotted on the chart with detailed information regarding the crossover (Ex: 50 SMA crossed over 200 SMA )
- Forecasting available for all three MAs. MA values are forecasted 5 values out and plotted as if a continuation to the MA.
- Forecast bias also applies to all forecasting. Bias means we can forecast based on an anticipated bullish, bearish or neutral direction in the market.
- To understand bias, please read the source code, or if you can't read the code just send me a message on here or Twitter. Twitter should be linked to my profile.
- Ribbons added and on by default. Optional setting to disable the ribbons. 5 ribbons between MA1 and MA2 and another 5 between MA2 and MA3.
- Ribbons are alpha-color coded based on their relation to their default MAs.
- Ribbons are only visible between MAs if the MAs being compared share the same Type, Resolution, and Source because there is no way to consolidate those three in a simple manner.
- Ribbon values are calculated based on calculated MA Periods between the MAs.
This script is meant as an educational script with well-formatted styling, and references for specific functions.

ATR/EMA/Pivots/Crossover/LabelsScript for ATR, EMA , Pivots , EMA crossover, and Buy/Sell Labels for EMA Crossover
ATR Channel plotted from open of candle
3 channels with configurable length
+/- .5
+/- 1
+/- 2
EMAx5
Preset to 10, 20, 50, 100, 200. Lengths are configurable
Standard Pivots
Pivot with S1, S2, S3, R1, R2, R3
EMA crossover with Buy/Sell Labels
EMAs lengths are configurable for crossover
(Ability to change colors and turn on/off all of the above. Pic is only showing +/-1 ATR channel, EMAs, Pivot Point with S1/R1, and Crossover with Buy Sell Labels)
Find this useful? Accepting tips. Message me.

EMA X BF 🚀EMA Crossover Strategy
A simple EMA cross is a useful indication of a change in direction of a trend and is a very popular tool in trading. It can also be useful to judge price action momentum or severity by looking at the angle of the 2 EMAs, or the distance between them.
There are 2 Exponential Moving Averages, one fast and one slow. When the fast EMA crosses above the slow EMA, this can be considered bullish and may signal an upside move. Conversely, a cross to the downside of the fast EMA under the slow EMA can be considered bearish.
This strategy uses the same principle but uses different sources for the 2 EMAs; instead of using close values, we use ohlc4 values for the fast EMA and hlc3 values for the slow EMA.
The idea is that a trader might enter a long position upon a cross up and reverse position and go short upon the next cross down.
We use a simple 6% stop loss for both long and short positions.
This strategy is tuned to a 6hr chart for Bitcoin USD pairs.
INSTRUCTIONS
Go Long when the background is green
Go short when the background is red
White background means sideways market: a no trade zone

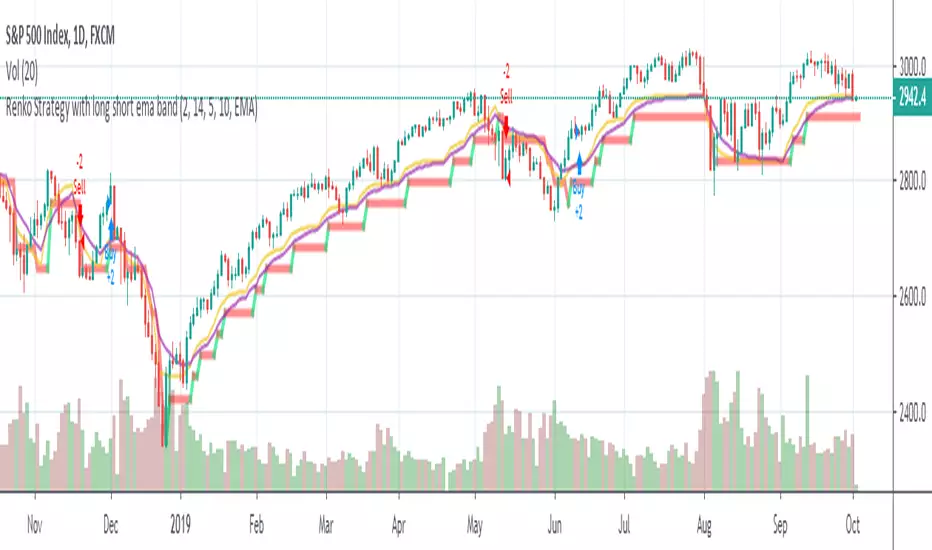
Renko Strategy with Ema against price crossover/underRenko Strategy with Ema against price crossover/under
Scripting Tutorial 7 - Triple Many Moving Averages ResolutionsThis script is for a triple moving average indicator where the user can select from different types of moving averages, price sources, lookback periods and resolutions.
Features:
- 3 Moving Averages with variable MA types, periods, price sources, resolutions and the ability to disable each individually
- Crossovers are plotted on the chart with detailed information regarding the crossover (Ex: 50 SMA crossed over 200 SMA )
- Forecasting available for all three MAs. MA values are forecasted 5 values out and plotted as if a continuation to the MA.
- Forecast bias also applies to all forecasting. Bias means we can forecast based on an anticipated bullish, bearish or neutral direction in the market.
- To understand bias, please read the source code, or if you can't read the code just send me a message on here or Twitter. Twitter should be linked to my profile.
This script is meant as an educational script with well-formatted styling, and references for specific functions.

EMA 20/50 & 50/200 Cross StrategyThis is a simple script using the 20 50 & 200 EMAs
Future modifications coming. I plan to add volume and other plots to this strategy as I continue to develop it.

Scripting Tutorial 6 - Triple Many Moving Averages ForecastingThis script is for a triple moving average indicator where the user can select from different types of moving averages, price sources and lookback periods.
Features:
- 3 Moving Averages with variable MA types, periods, price sources and ability to disable each individually
- Crossovers are plotted on the chart with detailed information regarding the crossover (Ex: 50 SMA crossed over 200 SMA )
- Forecasting available for all three MAs. MA values are forecasted 5 values out and plotted as if a continuation to the MA.
- Forecast bias also applies to all forecasting. Bias means we can forecast based on an anticipated bullish, bearish or neutral direction in the market.
- To understand bias, please read the source code, or if you can't read the code just send me a message on here or Twitter. Twitter should be linked on my profile.
This script is meant as an educational script with well-formatted styling, and references for specific functions.

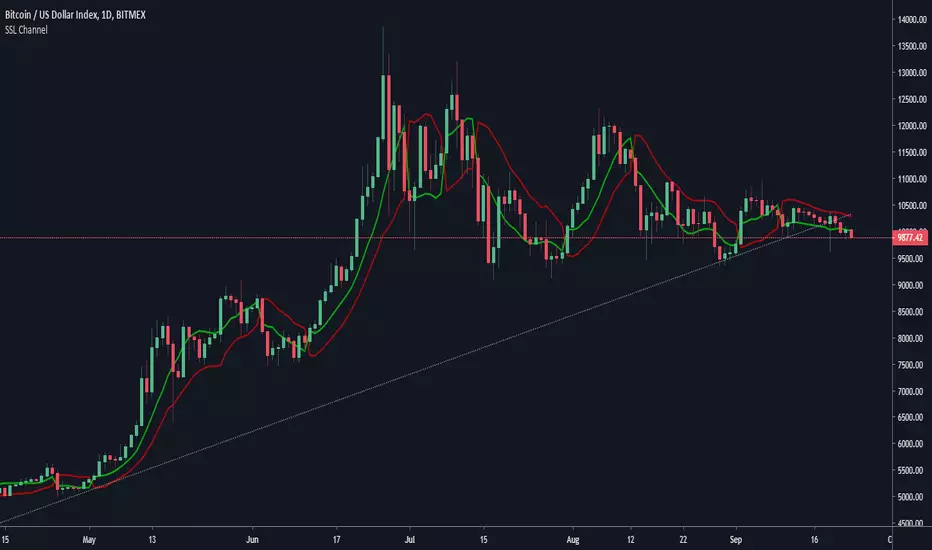
SSL Channel w/alertSSL Channel with cross alert when channels cross up or down. Built on ErwinBeckers SSL Channel script.