Strategy Builder Crypto (Single Trend/Plots)Hi everyone
Big program for the daily indicator
This one will be free on trial only for a week because it has an immense value and required quite a lot of work. For more info to use it long-term, please DM me
That out of the way, let's dive right in...
This is a huge upgrade from that script Ultimate-Algorithm-Builder-Single-Trend
The Tradingview non-pro users will appreciate it because it allows to add the selected subsequent indicators as well. The Pro users too will likely like this feature equally, what the H*** I'm saying :)
This indicator will transform you into what I was in the past... into a quant trader. You'll build your own trading algorithm in a few clicks only
Which timeframe and which assets ?
Short answer : ALL and ALL
You'll have to define the configuration of the tool based on your capital, psychology. For custom configuration of the tool, please DM me directly so that we can discuss further
But a few words of advices anyway :
the bigger the timeframe, the lower the inputs (and vice-versa)
Think about how much $$ you want to make per trade and define your entries from there
Think about how much $$ you can afford to lose per trade and define the supertrend from there
...
Your golden configuration might not work for all assets.
You might have to create some tweaks - for instance you found a great config for BTCUSD but it's not working for ETHUSD, then you can create a copy of your BTCUSD chart and set a new config for ETHUSD
What are the indicators inside :
This fantastic tool that I personally use for my trading detects convergence between the following indicators :
Overlay - meaning if the price close above/below a moving average
Trend Signal - to detect if the the DOW law is broken and predict a possible reversal - en.wikipedia.org/wiki/Dow_theory
In other words, it detects if the higher highs or lower lows sequence is broken
MACD or MACD Zero Lag
MA Cross - Cross of moving averages
Ichimoku - if the price closes below/above the cloud
Supertrend - used to detect polarity zones
TSI Shadow -
Pullback
You'll also have the possibility to define a pullback on a given MA. That means basically that you'll get a convergence and it will only display a signal when it will pullback first
This will reduce your losses in case of invalidation and maximize your gains as it will enter the trade in a better position.
You can define your pullback either based an absolute value or based on a percent distance from the MA
+Example:
Pullback value = 100 means I want a 100 pip/USD distance between the MA pullback and the candle
Pullback percent = 2 means I want a 2% distance between the MA pullback and the candle
The percent option is more generic in my opinion but I let the other available for those who might like it
That's it ?
Almost....You can also setup alerts on the indicator signals so that you won't have to stay days in front of the chart to wait for a signal.
You receive the alert, you check real quick if we're not in front of a support/resistance, if no then take the trade. if yes, I advice waiting for a big pullback - better to be safe than sorry in trading
What If you want a custom version ?
Here are a few custom ideas I could add just for you :
re-enter everytime there is a convergence. So far the indicator is only taking the first convergence. This would give more entries
add the resistances/supports (fibo, pivot)
add the take profit targets and trailing stop loss
..
Please hit me up directly so we can discuss further. Any custom dev will require quite some time so it won't be free
Enjoy that one as I really think it will improve your analyst skills and trading and hopefully make you a few gains (which will make me very happy as I want to help most of you to at least not losing your capital)
Dave
Cross


Ultimate Algorithm Builder (Single Trend)Hello traders
This is a fantastic tool to detect convergence between the following indicators :
Overlay - meaning if the price close above/below the SMA 50
Trend Signal - to detect if the the DOW law is broken and predict a possible reversal - en.wikipedia.org/wiki/Dow_theory
In other words, it detects if the higher highs or lower lows sequence is broken
MACD or MACD Zero Lag
MM Cross - Cross of moving averages
Ichimoku - if the price closes below/above the cloud
Supertrend - used to detect polarity zones
TSI Shadow - propieraty indicator - URL :
It's ultra flexible as you check which indicator you need in your own strategy. That's why I called it the Ultimate Algorithm Builder
Enjoy
Dave

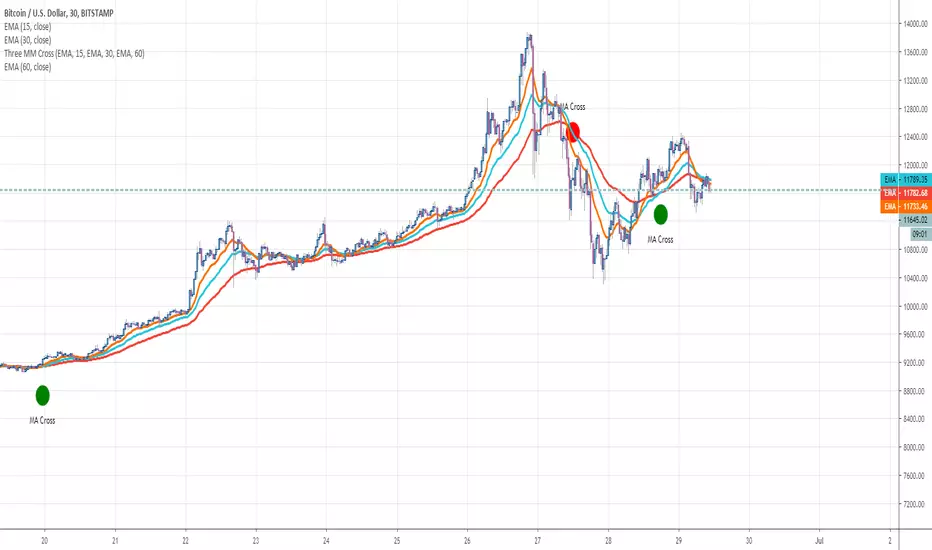
Three MM CrossHello traders
Some friends asked me to do it so... sharing it for everyone instead
This indicator detects when the first moving average is above the two others. It's a very powerful tool for trend traders that use multiple moving averages to detect a strong trend
Enjoy
Dave
Four MM crossHello traders
Some friends asked me to do it so... sharing it for everyone instead
This indicator detects when the first moving average is above the three others. It's a very powerful tool for trend traders that use multiple moving averages to detect a strong trend
Enjoy
Dave

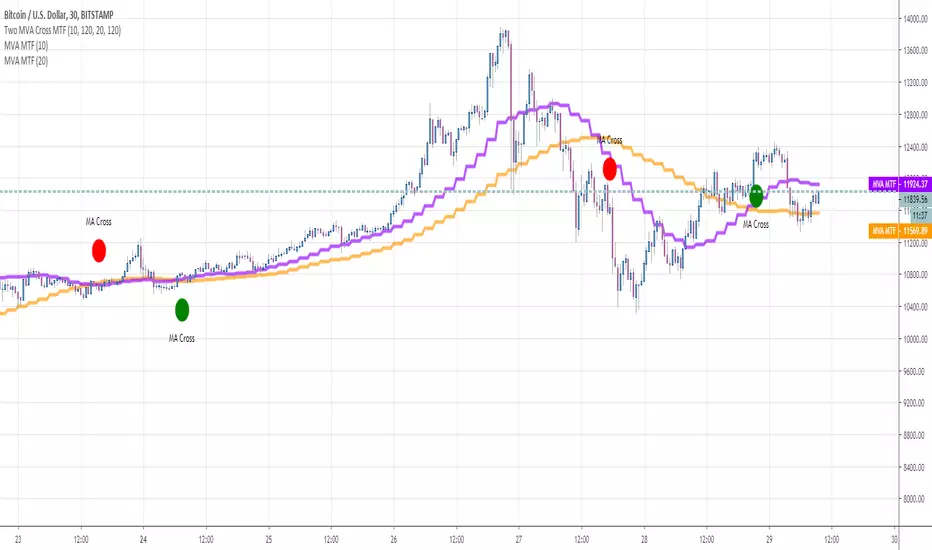
Two MVA Cross MTFHello traders
This is a script to apply the crossover/crossunder of moving average multi-timeframes on a different timeframe chart
In this example, we see two moving averages in the 2H timeframe being detected on a m30 chart
Enjoy
Dave
Two MM CrossHello Traders
This is a script to detect the crossover/crossunder of two moving averages
It's generic as all standard moving averages are accepted and can be crossed between each other
Enjoy
Dave

Multiple Moving AveragesThis script shows multiple moving averages and has an indicator when they are about to cross. Depending on the scale you probably will need to adjust the values to have a working cross indicator.
Turbo TriggerSome Words
This indicator is a collaboration between me and Himeyuri, i encourage you to check her profile and follow her www.tradingview.com
Introduction
A lot of indicators include a "trigger" line, it can be a smoothed version of another input, in this case the trigger will generate signals from his crosses with the input. The purpose of this indicator is to provide a fast trigger line to generate earlier signals as well as avoiding some whipsaw.
The Indicator
There are two lines, a bull line (blue) and the trigger (orange) , when the trigger cross over the bull line a buy signal is generated, when the trigger cross under the bull line a sell signal is generated. The trigger is made from the smoothed difference between the bull and bear line.
smooth control the smoothness of the output. The Bull/Bear Mode is an idea proposed by Himeyuri that involve plotting the bear line instead of the trigger.
Bull/Bear Mode, the lines are somewhat asymmetrical from each others.
Conclusion
We have showcased a new indicator who use a really fast trigger line to generate earlier signals, if some are way to earlier you can still increase smooth in order to correct reactivity. I hope you find a use to it.
Thanks for reading !
A big thanks to Himeyuri who is a great student and great pinescripter.


~Sexy RSI~Fellow sexy traders,
Wrote this to save time from constantly having to add my own horizontals/MAs to the default RSI so I decided to make this modification.
The default settings include channels from 40-80 (green horizontals) for a bullish range, and 20-60 (red horizontals) for the bearish range.
Also includes white line at 50 level, and blue horizontals at extremes (90 and 10).
If RSI stays in one of the red or green range that can signify the trend direction, as directed by Andrew Cardwell (inventor of the RSI ).
If you wish for other levels to be included, just let me know. Comment on here or dm me on twitter @boss_charts and I might add the settings for you.
Additionally, in order to tell the level of the RSI and how overextended it might be, I added the setting for the RSI to change color depending on its level. Current settings are as follows:
Normal RSI (30-70) = PURPLE
Conventional Overbought/Oversold (30-20 + 70-80) = RED
1st extended (20-15 + 80-85) = PINK
2nd extended (15-10 + 85-90) = ORANGE
VERY EXTENDED (<10 + >90) = YELLOW
That way you can get an idea of how drastic a move is by the color alone.
Finally, there are the default MAs added that Mr. Cardwell defines as useful for defining the trend. These being the 9 MA and 45 EMA/WMA.
The strategy with these is to have the MAs on both price and RSI . If the 9MA is above the 45 MA on both price and RSI , then this is bullish and you can look for longs.
Conversely, if the 9 is below the 45 on both RSI and price that is bearish , and you can look for shorts.
I added the background color change for the points where the MAs cross each other, so you do not have to have the MAs fogging up your charts to know where they are relative to one another. This is similar to my MA cross indicator which contains the same functionality.
Never financial advice. Back test it for yourself and find MA configurations that work for you.


Dynamically Adjustable Moving AverageIntroduction
The Dynamically Adjustable Moving Average (AMA) is an adaptive moving average proposed by Jacinta Chan Phooi M’ng (1) originally provided to forecast Asian Tiger's futures markets. AMA adjust to market condition in order to avoid whipsaw trades as well as entering the trending market earlier. This moving average showed better results than classical methods (SMA20, EMA20, MAC, MACD, KAMA, OptSMA) using a classical crossover/under strategy in Asian Tiger's futures from 2014 to 2015.
Dynamically Adjustable Moving Average
AMA adjust to market condition using a non-exponential method, which in itself is not common, AMA is described as follow :
1/v * sum(close,v)
where v = σ/√σ
σ is the price standard deviation.
v is defined as the Efficacy Ratio (not be confounded with the Efficiency Ratio) . As you can see v determine the moving average period, you could resume the formula in pine with sma(close,v) but in pine its not possible to use the function sma with variables for length, however you can derive sma using cumulation.
sma ≈ d/length where d = c - c_length and c = cum(close)
So a moving average can be expressed as the difference of the cumulated price by the cumulated price length period back, this difference is then divided by length. The length period of the indicator should be short since rounded version of v tend to become less variables thus providing less adaptive results.
AMA in Forex Market
In 2014/2015 Major Forex currencies where more persistent than Asian Tiger's Futures (2) , also most traded currency pairs tend to have a strong long-term positive autocorrelation so AMA could have in theory provided good results if we only focus on the long term dependency. AMA has been tested with ASEAN-5 Currencies (3) and still showed good results, however forex is still a tricky market, also there is zero proof that switching to a long term moving average during ranging market avoid whipsaw trades (if you have a paper who prove it please pm me) .
Conclusion
An interesting indicator, however the idea behind it is far from being optimal, so far most adaptive methods tend to focus more in adapting themselves to market complexity than volatility. An interesting approach would have been to determine the validity of a signal by checking the efficacy ratio at time t . Backtesting could be a good way to see if the indicator is still performing well.
References
(1) J.C.P. M’ng, Dynamically adjustable moving average (AMA’) technical
analysis indicator to forecast Asian Tigers’ futures markets, Physica A (2018),
doi.org
(2) www.researchgate.net
(3) www.ncbi.nlm.nih.gov
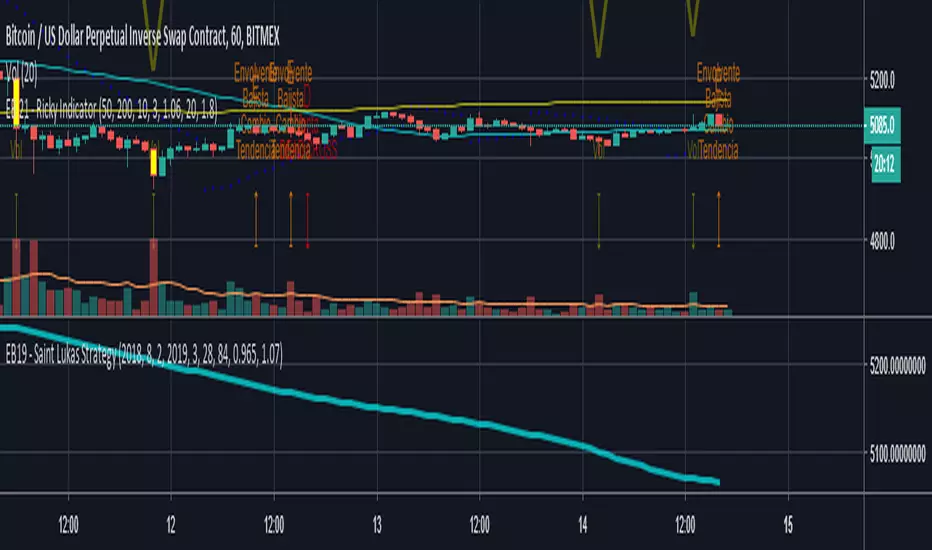
EB 21 - Ricky IndicatorIndicates multiple signals:
SAR
2 SMA
MAST Detector
Bullish Engulfing
Bear Engulfing
Gold and Dead Cross
Volume Increment
(YEK) Combo(YEK) Combo is a combination of several indicators (listed below). You can use them together or one by one. Just click settings, and choose which of them to be shown.
Here are the indicators included in this script:
- Ichimoku Cloud
- Bollinger Bands
- Moving Average 1
- Moving Average 2 (In case of detecting golden crosses or death crosses)
- Exponential Moving Average
- T3 Tillson
- MavilimW
Enjoy!

RPS Moving Average CrossThis indicator is a powerful SMA and EMA Cross tool, that gives the trader better perception on the trend and gives potential BUY (UP arrow) and SELL (DOWN arrow) signals.
Highly configurable and gives deep customization, valuing individual preferences.
How to trade using this tool:
Buy @ Bullish 5 X 8 and Sell @ Bearish 5 X 8 (Suitable for Intra-Day Traders)
Buy @ Bullish 10 X 21 and Sell @ Bearish 10 X 21 (Suitable for Day Traders)
Buy @ Bullish 21 X 50 and Sell @ Bearish 21 X 50 (Suitable for Swing Traders)
Buy @ Bullish 50 X 200 and Sell @ Bearish 50 X 200 (Suitable for Investors)
Hit Like, if you find any value in this tool.
Share your trading experience using this tool in the comments section.
Thank you!
~RPS~

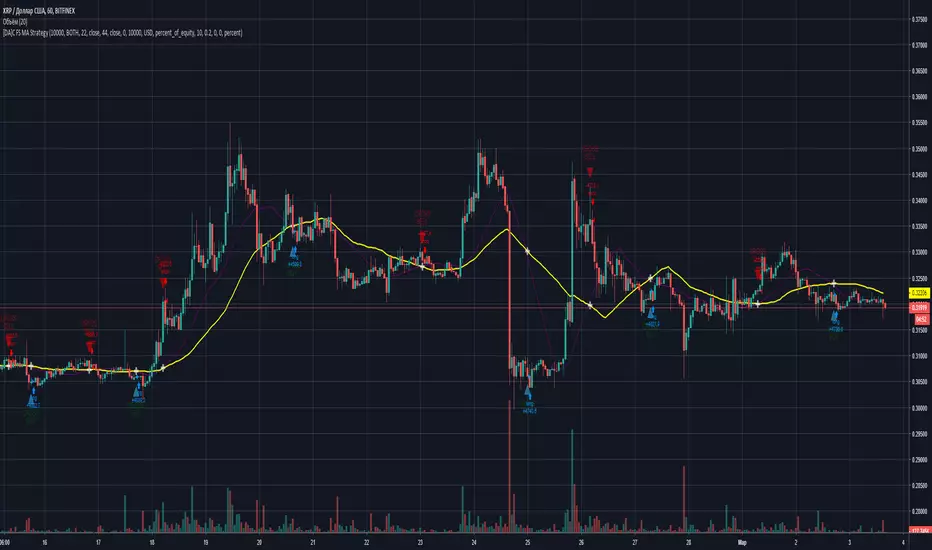
MA cross strategyThis strategy uses simple moving average cross for entry signals, but it can be customized with 3 cases:
1- exit at take profit and stop loss;
2- exit when distance between close and moving average is above a user defined minimum;
3- use Renko candles to calculate the moving average without changing the graph candles.
The third case is the one with better results, but for non-pro users can be used only with daily time frame.
Look at profit factor and percent of winning trades.
You can test also on your favorite pair, but most important is setting correct brick size.
At request, I could share also a screener with alarms for finding which symbol statisfy entry rules.
Please use comment section for any feedback.
********************************** IMPORTANT*******************************
I have developed an expert advisor for metatrader4 (MT4): results of expert advisor form 2015-01-01 to today are very good with low drawdown and good profit.
********************************************************************************

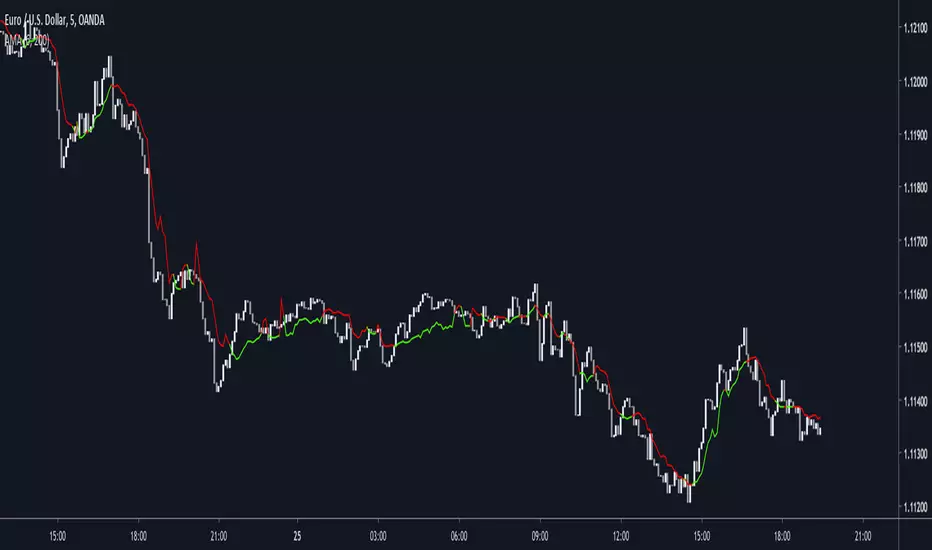
[DA]Cross Fast Slow MA StrategyThis script is for testing moving averages. Recommended settings are set by default and timeframe 12 hour.
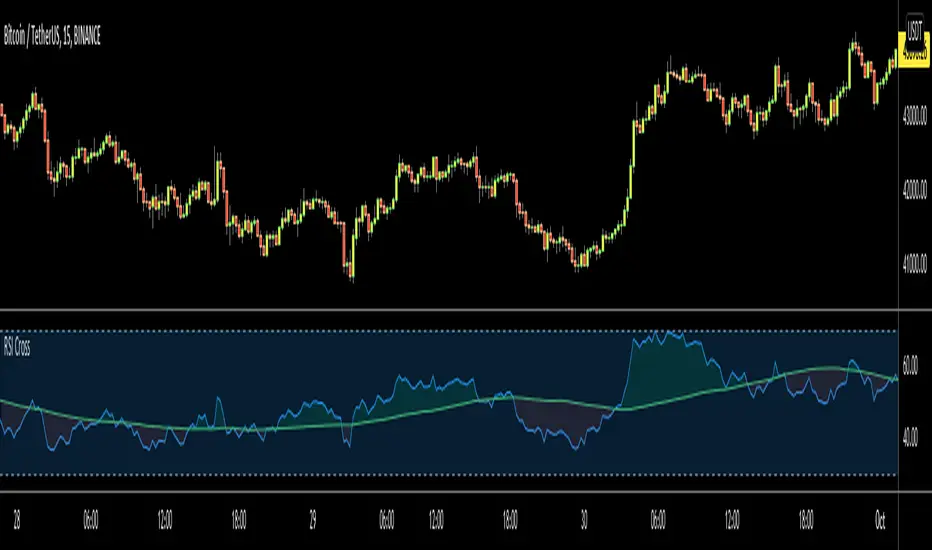
rsi_with_stochrsi_[j15] v3This is version 3 RSI and StochRSI are improved by visualizing the cross-trend wave on the indicator, as well as by highlighting the colors of the bands and take into account the joint intersection of RSI and StochRSI at different settings. Enjoy using it!

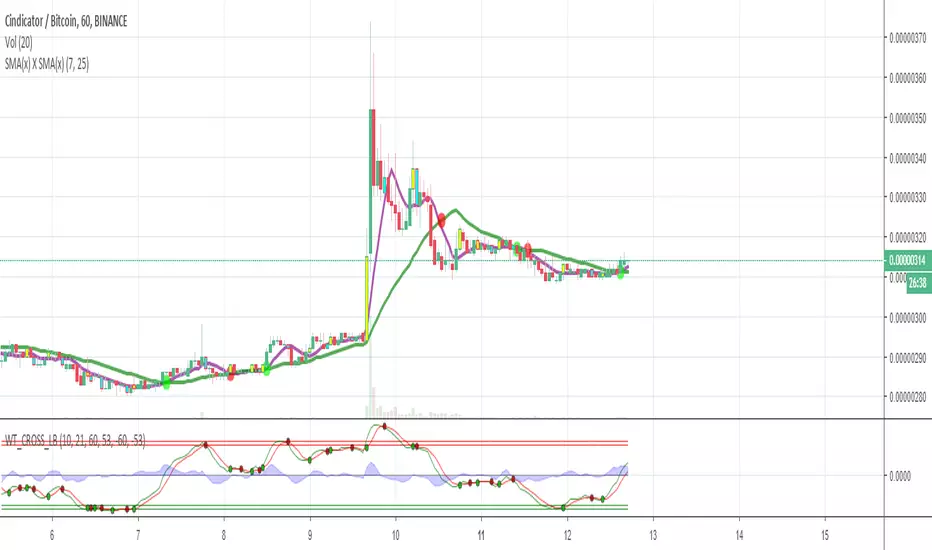
SMA Cross (Short X Long)Its a graph for detecting the SMA cross points.
When short SMA crosses the long SMA downside up it may be a buy signal and the opposite is may be a sell signal.
rsi_with_stochrsi_[j15] v2This is version 2 of the combined indicator RSI and Stochastic RSI. Added intersection of lines k and d, as well as suppression of the upper and lower lines