Hamaada RangeThis indicator plots the Daily DR/IDR range (19:30–23:00 NY) for each weekday, Monday to Friday.
It automatically draws the Daily Range (DR) and Initial Daily Range (IDR) highs, lows, midlines, and opening price.
Each day’s DR/IDR box extends into the following session for clarity and projection.
All lines and colors are fully customizable per-day.
Tracks 3-bar swings after the DR window closes.
Automatically detects when price violates the DR high or low.
Draws a “Swing Violation Line” from the last valid swing to the end of the extension period.
Friday DR extends to next Monday and supports cross-week swing violation detection.
Background shading, labels, and opening lines are optional.
Designed for precision session modeling in NY timezone (America/New_York recommended).
Concept


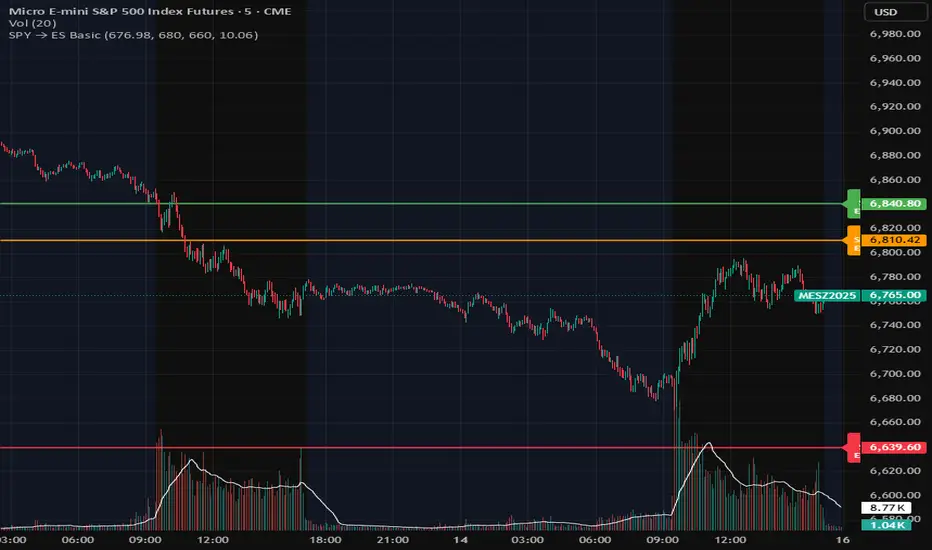
Defended Price Levels (DPLs) — Melvin Dickover ConceptThis indicator identifies and draws horizontal “Defended Price Levels” (DPLs) exactly as originally described by Melvin E. Dickover in his trading methodology.
Dickover observed that when extreme relative volume and extreme “freedom of movement” (volume-to-price-movement ratio) occur on the same bar, especially on bars with large gaps or unusually large bodies, the closing price (or previous close) of that bar very often becomes a significant future support/resistance level that the market later “defends.”
This script automates the detection of those exact coincident spikes using two well-known public indicators:
Relative Volume (RVI)
• Original idea: Melvin Dickover
• Pine Script implementation used here: “Relative Volume Indicator (Freedom Of Movement)” by LazyBear
Link:
Freedom of Movement (FoM)
• Original idea and calculation: starbolt64
• Pine Script: “Freedom of Movement” by starbolt64
Link:
How this indicator works
Calculates the raw (possibly negative) LazyBear RVI and starbolt64’s exact FoM values
Normalizes and standardizes both over the user-defined lookback
Triggers only when both RVI and FoM exceed the chosen number of standard deviations on the same bar (true Dickover coincident-spike condition)
Applies Dickover’s original price-selection rules (uses current close on big gaps or 2× body expansion candles, otherwise previous close)
Draws a thin maroon horizontal ray only when the new level is sufficiently far from all previously drawn levels (default ≥0.8 %) and the maximum number of levels has not been reached
Keeps the chart clean by limiting the total number of significant defended levels shown
This is not a republish or minor variation of the two source scripts — it is a faithful automation of Melvin Dickover’s specific “defended price line” concept that he manually marked using the coincidence of these two indicators.
Full credit goes to:
Melvin E. Dickover — creator of the Defended Price Levels concept
LazyBear — author of the Relative Volume (RVI) implementation used here
starbolt64 — author of the Freedom of Movement indicator and calculation
Settings (all adjustable):
Standard Deviation Length (default 60)
Spike Threshold in standard deviations (default 2.0)
Minimum distance between levels in % (default 0.8 %)
Maximum significant levels to display (15–80)
Use these horizontal maroon lines as potential future support/resistance zones that the market has previously shown strong willingness to defend.
Thank you to Melvin, LazyBear, and starbolt64 for the original work that made this automation possible.

Multi-Timeframe Stochastic (4x) z Podświetlaniem - PawelA script that provides information when most of the stocks are in the overbought or oversold zone.

Multi-Timeframe RSI (4x) z Podświetlaniem - PawełRSI z podświetleniem z różnych tfów z ustawianiem intensywnosci i kolorów.

EMA Trend Alignment (10/20/50) with MTF & SignalsBullish Crossovers 10>20>50 and Bearish Crossover 10<20<50

Volume-Confirmed FTR Zones [AlgoPoint]FTR Zone Indicator — Fail To Return Zones (With Volume Confirmation)
Advanced Smart Money Zone Detection for Institutional Orderflow
The FTR Zone Indicator is a professional-grade tool designed for traders who follow Smart Money Concepts (SMC), ICT methodologies, or institutional orderflow. It automatically detects Fail To Return Zones (FTR) — high-probability supply and demand areas formed after strong displacement moves.
By combining impulse detection, base identification, and volume confirmation, this indicator highlights zones where price is most likely to react, reverse, or mitigate shortly after structure breaks.
⸻
⭐ What Are FTR Zones?
FTR zones (Fail To Return zones) are price areas where:
1. A strong displacement / impulse candle is formed
2. That impulse originates from a small consolidation (base)
3. Price moves away aggressively
4. AND fails to return immediately to the origin area
These zones often indicate:
• Institutional orders
• Imbalance
• Hidden liquidity
• Origin of a trend leg
• High-probability mitigation points
This indicator fully automates the detection and visualization of such areas.
🔍 How the Indicator Works
1. Impulse Detection
The indicator identifies a valid impulse candle using:
• ATR-based bar range filter
• Trend-aligned candle body direction
• Optional volume confirmation
Only large, meaningful institutional candles qualify — filtering out noise.
2. Base Zone Identification
Before every impulse, the tool finds the micro-consolidation base using:
• Highest high of the last X bars
• Lowest low of the last X bars
This base becomes the potential FTR zone.
3. FTR Zone Creation
When a valid impulse is detected:
• Bullish impulse → Demand FTR zone
• Bearish impulse → Supply FTR zone
The zone is immediately drawn on the chart using box.new().
4. Zone Extension
Every zone continuously extends to the right as price evolves, allowing you to track:
• Mitigation
• Retests
• Reaction points
• Liquidity sweeps
5. Invalidation Logic
Zones automatically delete when violated:
• Demand zone invalid if close < zone low
• Supply zone invalid if close > zone high
This keeps the chart clean and helps focus only on active, high-value areas.
🎛️ Key Features
✔ Automatic FTR Zone Detection
Instantly identifies institutional origin zones based on real impulse and displacement.
✔ Volume-Based Filtering
Ensures only high-volume impulses (true institutional orders) create zones.
✔ Supply & Demand Coloring
• Bullish FTR → Demand Zone (Teal tone)
• Bearish FTR → Supply Zone (Red tone)
✔ Safe Zone Storage
Fault-tolerant logic ensures no array errors, invalid zones, or broken visuals.
✔ Auto-Extending Boxes
Real-time zone updates with precise historical mapping.
✔ Smart Invalidation
Zone is removed only when fully broken, preventing false signals.
✔ Clean, Non-Repainting Logic
Impulse detection and zone placement are confirmed only on bar close.
📈 How to Use It (Example Schenarios)
For Reversals or Continuations
• Look for price reacting or mitigating inside a zone
• Use as entry confirmation in trend continuations
• Combine with FVG, BOS/CHOCH, liquidity sweeps, or premium/discount zones
For Scalping or Intraday Trading
• High-probability countertrend entries
• Reaction-based setups at institutional footprints
For Swing Traders
• Identify weekly/daily origin zones
• Plan entries around large displacement points

Break & Retest + Liquidity Sweep EntryIdentify a BOS (vertical line appears).
Wait for price to retest the broken level (circle shows up).
Optionally confirm with liquidity sweep.
Enter long/short trades based on bullish/bearish retest signals.
Use ATR or personal risk management for stop-loss placement.

RSI with Zone Colors//@version=6
indicator(title="RSI with Zone Colors", shorttitle="RSI+", format=format.price, precision=2, timeframe="", timeframe_gaps=true)
//// ==== INPUT SETTINGS ====
rsiLength = input.int(14, title="RSI Length", minval=1)
source = input.source(close, title="Source")
ob_level = input.int(70, title="Overbought Level")
os_level = input.int(30, title="Oversold Level")
//// ==== RSI CALCULATION ====
change = ta.change(source)
up = ta.ma(math.max(change, 0), rsiLength)
down = ta.ma(-math.min(change, 0), rsiLength)
rsi = down == 0 ? 100 : 100 - (100 / (1 + up / down))
//// ==== COLOR BASED ON ZONES ====
rsiColor = rsi > ob_level ? color.red : rsi < os_level ? color.green : #2962FF
//// ==== PLOT RSI ====
plot(rsi, title="RSI", color=rsiColor, linewidth=2)
//// ==== ZONE LINES ====
hline(ob_level, "Overbought", color=#787B86)
hline(50, "Middle", color=color.new(#787B86, 50))
hline(os_level, "Oversold", color=#787B86)
//// ==== FILL ZONES ====
zoneColor = rsi > ob_level ? color.new(color.red, 85) : rsi < os_level ? color.new(color.green, 85) : na
fill(plot(ob_level, display=display.none), plot(rsi > ob_level ? rsi : ob_level, display=display.none), color=zoneColor, title="OB Fill")
fill(plot(os_level, display=display.none), plot(rsi < os_level ? rsi : os_level, display=display.none), color=zoneColor, title="OS Fill")
//// ==== COLOR CANDLE WHEN RSI IN ZONE ====
barcolor(rsi > ob_level ? color.red : rsi < os_level ? color.green : na)

Improved ICT MultiTF A+ IndicatorThis indicator provides ICT-style multi time frame fair value gaps with a 4-hour moving average bias. It prioritizes 15-minute gaps and falls back to 5-minute and 1-minute gaps when none are present. It also includes alert conditions for long and short signals based on session filters and bias.

4/8/15 EMA + Classic & Camarilla PivotsEssentially this is what you can get on TOS but everything included in one chart.

Multi-TF RSI Consolidation (15M) - PepEnhanced view of rsi levels across multiple timeframes in unison.

Order Block Smart Entry (v6)very useful indicator, analyze multiframes to identify the trend, then find out the valid order block and after analyzing lower time frame entry gives the singal.


DTC Killzones ICT🕐 DTC Killzones ICT — Visualize Market Sessions Like a Pro
The DTC Killzones ICT indicator is a clean and intuitive tool designed for traders who want to analyze and visualize institutional trading sessions directly on their charts.
Inspired by ICT’s Killzone concept , this script makes it easy to identify overlapping market sessions — such as London, New York, and Asian — and track how price behaves within each zone.
💡 What It Does
This indicator automatically highlights key market sessions (Killzones) on your chart with fully customizable colors, labels, and transparency.
Each zone dynamically updates to reflect real-time highs and lows, helping you identify:
Session ranges and liquidity zones
Volatility windows and breakout areas
Institutional footprints across sessions
Whether you trade Forex, Indices, or Crypto , this script gives you visual clarity on when and where smart money is likely to move.
⚙️ Main Features
✅ Up to four customizable sessions (New York, London, Asian, and London Close)
✅ Adjustable timeframes and timezone options — sync with your exchange or custom UTC offset
✅ Dynamic high/low range tracking for each session
✅ Toggle range outlines, session labels , and transparency levels
✅ Optional daily dividers and session transition markers
✅ Works on any timeframe and any symbol
🧠 How Traders Use It
ICT-based traders can easily mark Killzones to align with setups like FVGs, liquidity grabs, or Silver Bullet entries.
Intraday traders can visualize session volatility and overlap periods for potential entries.
Swing traders can identify daily structure shifts by tracking range-to-range behavior.
🛠️ Customization
You can fully rename, recolor, or disable each session block.
Adjust the range transparency for visual comfort, and toggle session or daily dividers to fit your workflow.
Everything is designed to be clean, light, and modular — no clutter, no confusion.
⚡ Recommended Settings
For ICT-style analysis:
London Session: 02:00–05:00
New York Session: 07:00–10:00
Asian Session: 19:30–24:00
London Close Session: 10:00–12:00
These time windows are fully editable to suit your timezone or strategy.
🧩 Compatibility
Works seamlessly with TradingView’s built-in timezone tools
Compatible with all instruments and timeframes
Designed to overlay directly on your price chart
🏁 Final Notes
The DTC Killzones ICT indicator focuses purely on market session visualization — no alerts, entries, or trading signals.
It’s designed to complement your existing strategies and enhance clarity when analyzing market behavior across global sessions.
📈 Built for traders who value precision, structure, and timing.

Zarks 4H Range, 15M Triggers Pt2🕓 4-Hour Structure Dividers ⏰
📈 Vertical lines represent each 4-hour candle broken down into smaller execution timeframes — perfect for aligning entries across 15-minute, 5-minute, and 1-minute charts.
🧭 The lines remain true and synchronized with the 4-hour structure, ensuring timing accuracy:
⏱ 15-Minute: Lines appear at :45 of each corresponding hour
⚙️ 5-Minute: Lines appear at :55 of each corresponding hour
🔹 1-Minute: Lines appear at :59 of each corresponding hour
🎯 Use these precise vertical dividers to visualize higher-timeframe structure while executing on lower-timeframe setups — ideal for confluence traders combining HTF bias with LTF precision.

50-Minute Opening Range BreakoutThis is a test of the opening range with Bearish/Bullish confirmation

Volume Surge by MashrabThe "Volume Surge" indicator is like a simple market health checkup. It looks at how much of an asset (like a stock or crypto) is being traded right now and compares it to the recent past. Think of it as a way to quickly see if interest in that asset is suddenly spiking, fading, or staying the same.
The indicator shows this information in an easy-to-read table right on your chart.
How it works:
The indicator keeps track of two main things for you:
Current Volume: The total trading volume over the last "N" days (or whatever time period you choose).
Previous Volume: The total trading volume over the period right before that
Then, it gives you a summary:
The "Ratio" tells you how many times bigger or smaller the current volume is.
The "Percent Change" shows the percentage jump in volume.
How to use it:
This indicator helps you see when something interesting might be happening. Here are a few ways traders use it:
Confirm Breakouts: If a stock breaks above a key price level and the indicator shows a huge volume surge, it’s a stronger signal that the move is real and not a false alarm.
Spot Reversals: If a stock has been trending up but the volume starts to drop off, it could mean the trend is losing steam. A sudden, massive volume surge on a down day might indicate panic selling, which can sometimes happen right before the price turns around.
Check Trend Strength: A healthy trend usually has increasing volume going in the same direction. For example, if a stock is in an uptrend, you want to see lots of volume on the days it goes up.
This indicator isn't a crystal ball, but it's a great tool for understanding the "who" and "how much" behind a price move. It helps you see when a price change is backed by a lot of market activity, which often makes the move more trustworthy.

NY Midnight High/Low Arrows (Auto-Show)🇺🇸 English Explanation
This indicator automatically marks the daily high and low of the New York session.
It draws arrows (▼▲) at the highest and lowest prices after New York midnight (00:00),
and can optionally display small horizontal dotted lines at those levels.
It helps traders identify daily liquidity zones and key turning points in price action.
🇸🇦 الشرح بالعربية
هذا المؤشر يحدد القمة والقاع اليومية لجلسة نيويورك بشكل تلقائي.
يرسم أسهماً (▼▲) عند أعلى وأدنى سعر بعد منتصف الليل بتوقيت نيويورك (00:00)،
ويمكنه أيضًا عرض خطوط أفقية منقطة صغيرة عند تلك المستويات.
يساعد المتداول في معرفة مناطق السيولة اليومية ونقاط الانعكاس المهمة في حركة السعر.

ICT Macro Time WindowsICT Macro Time Windows - Master institutional market timing with automated 'Macro' trading session tracking.
What are 'Macros'?
In ICT terminology, 'Macros' refer to the key institutional trading windows throughout the day where major banks and liquidity providers are most active. These specific time frames see heightened volatility, liquidity, and strategic positioning.
Perfect Timing Automation:
• 8 Critical Macro Sessions:
London 1: 02:33-03:00 EST
London 2: 04:03-04:30 EST
NY AM1: 08:50-09:10 EST
NY AM2: 09:50-10:10 EST
NY AM3: 10:50-11:10 EST
Lunch: 11:50-12:10 EST
PM: 13:10-13:40 EST
Close: 15:15-15:45 EST
• Fully customizable time zones and session times
• Real-time session detection with visual zones & labels
• Automatic High/Low range tracking within each window
• Boxes, lines, and labels for clear visual reference
• Never miss optimal entry/exit timing again
Trade when institutions trade - stop guessing and start timing your setups with precision during these key liquidity windows! All session times are easily adjustable in settings to match your preferred trading hours.
Perfect for Forex, Futures, and Index traders following ICT concepts and institutional flow analysis.

Advanced Multi-Timeframe Trend & Signal System═══════════════════════════════════════════════════════════════
ADVANCED MULTI-TIMEFRAME TREND & SIGNAL SYSTEM v1.0
═══════════════════════════════════════════════════════════════
Created by: Zakaria Safri
License: Mozilla Public License 2.0
A comprehensive technical analysis tool designed for traders seeking
multi-dimensional market insights. This indicator combines proven
technical analysis methods with modern visualization techniques.
═══════════════════════════════════════════════════════════════
KEY FEATURES
═══════════════════════════════════════════════════════════════
✓ SUPERTREND SIGNAL GENERATION
- Customizable sensitivity settings
- Clear long/short entry signals
- Automatic trend direction detection
- ATR-based dynamic calculations
✓ MULTI-TIMEFRAME DASHBOARD
- Real-time trend analysis across 6 timeframes
- Synchronized trend confirmation
- Customizable table position and size
- Current: 1M, 5M, 15M, 1H, 1D coverage
✓ QQE REVERSAL DETECTION
- Quantitative Qualitative Estimation algorithm
- Early reversal signal identification
- Adjustable RSI and smoothing parameters
- Confirmation-based plotting
✓ DYNAMIC SUPPORT & RESISTANCE
- Pivot-based level calculation
- Quick and standard pivot detection
- Color-coded zones (8 levels)
- Automatic level updates
✓ MOMENTUM BREAKOUT SIGNALS
- Ichimoku-inspired calculations
- Bullish and bearish breakout detection
- Visual zone highlighting
- Trend confirmation filters
✓ RISK MANAGEMENT SYSTEM
- ATR-based stop loss calculation
- Multiple take profit targets (TP1, TP2, TP3)
- Customizable risk-to-reward ratios
- Dynamic price level tracking
- Hit detection markers
✓ VOLATILITY BANDS
- Keltner Channel implementation
- Multiple band layers (3 levels)
- EMA-based calculations
- Adaptive to market conditions
✓ TREND CLOUD VISUALIZATION
- Dual moving average cloud
- Clear trend direction indication
- Customizable color scheme
- Trend bar coloring
═══════════════════════════════════════════════════════════════
HOW TO USE
═══════════════════════════════════════════════════════════════
SETUP:
1. Add indicator to your chart
2. Configure sensitivity in Core Signals section
3. Enable desired features (signals, reversals, breakouts)
4. Set up risk management levels if trading
5. Position MTF dashboard to preference
SIGNAL INTERPRETATION:
• LONG Signal: Price crosses above Supertrend
• SHORT Signal: Price crosses below Supertrend
• REV (Reversal): QQE indicates potential trend change
• Diamond Breakouts: Momentum shift confirmation
• T1/T2/T3: Take profit level hits
MULTI-TIMEFRAME ANALYSIS:
• Green (BULL): Higher timeframe supports uptrend
• Red (BEAR): Higher timeframe supports downtrend
• Use for trend alignment and confirmation
• Best results when multiple timeframes align
RISK MANAGEMENT:
• Enable Stop Loss for automatic SL calculation
• Activate TP levels based on trading style
• Adjust Risk-to-Reward ratio (1:1 to 1:10)
• Monitor hit detection circles for exits
═══════════════════════════════════════════════════════════════
TECHNICAL SPECIFICATIONS
═══════════════════════════════════════════════════════════════
CALCULATIONS:
• Supertrend: ATR-based with customizable multiplier
• QQE: Modified RSI with Wilders smoothing
• Keltner Channels: EMA basis with ATR bands
• Pivots: Standard left/right bar methodology
• Support/Resistance: Multi-level pivot analysis
PARAMETERS:
• Supertrend Sensitivity: 0.5 to 10.0 (default: 2.0)
• RSI Period: 5 to 50 (default: 14)
• QQE Multiplier: 1.0 to 10.0 (default: 4.238)
• Risk-to-Reward: 1 to 10 (default: 4)
TIMEFRAMES:
Compatible with all timeframes. MTF dashboard displays:
• 1 Minute (1M)
• 5 Minutes (5M)
• 15 Minutes (15M)
• 1 Hour (1H)
• 1 Day (1D)
• Current chart timeframe
═══════════════════════════════════════════════════════════════
CUSTOMIZATION OPTIONS
═══════════════════════════════════════════════════════════════
VISUAL:
• Professional color scheme (Cyan/Orange)
• Adjustable table position (9 positions)
• Table size options (tiny/small/normal/large)
• Transparent zone highlighting
• Clean, modern label design
TOGGLES:
• Enable/disable any feature independently
• Show/hide signals, reversals, breakouts
• Toggle S/R levels and zones
• Control trend cloud and bands
• Master trend line optional
ALERTS:
The indicator provides visual signals that can be used with
TradingView's alert system by setting alerts on the indicator.
═══════════════════════════════════════════════════════════════
BEST PRACTICES
═══════════════════════════════════════════════════════════════
✓ Combine signals for higher probability setups
✓ Use MTF dashboard for trend confirmation
✓ Respect S/R levels for entry/exit planning
✓ Monitor QQE reversals at key price levels
✓ Adjust sensitivity based on asset volatility
✓ Test on demo/paper trading first
✓ Use proper risk management always
═══════════════════════════════════════════════════════════════
IMPORTANT DISCLAIMER
═══════════════════════════════════════════════════════════════
This indicator is a technical analysis tool and does NOT:
• Guarantee profitable trades
• Provide financial advice
• Predict future price movements with certainty
• Replace proper risk management
• Substitute for personal due diligence
Past performance does not indicate future results. All trading
involves risk. Users should:
- Understand the indicator's logic
- Test thoroughly before live trading
- Use appropriate position sizing
- Never risk more than they can afford to lose
- Consult financial advisors if needed
═══════════════════════════════════════════════════════════════
CODING STANDARDS
═══════════════════════════════════════════════════════════════
This indicator follows PineCoders Coding Conventions:
✓ Proper variable naming (prefixes: i_, f_, c_)
✓ Clear function documentation
✓ Organized code structure
✓ Type declarations
✓ Efficient calculations
✓ No repainting (confirmed signals)
✓ Proper use of request.security
═══════════════════════════════════════════════════════════════
SUPPORT & UPDATES
═══════════════════════════════════════════════════════════════
Version: 1.0
Author: Zakaria Safri
License: MPL 2.0
Last Updated: 2024
For questions, feedback, or suggestions, please comment below.
═══════════════════════════════════════════════════════════════
#trading #signals #supertrend #multiTimeframe #QQE #reversals
#supportResistance #riskManagement #trendAnalysis #momentum

Name of tickerDescription:
This indicator displays the instrument’s ticker symbol and the current chart timeframe at the top center of the chart.
Features:
• Shows the ticker (e.g., BTCUSDT, AAPL, etc.).
• Displays the current timeframe (1m, 5m, 1H, 1D, etc.).
• Positioned at the top center of the chart for easy reference.
• Transparent background for minimal interference with price action.
• Lightweight and simple, no extra settings required.
Usage:
• Works with any instrument: stocks, crypto, futures.
• Useful for traders who want to always see the ticker and timeframe while analyzing the chart.
Settings:
• Text size can be adjusted in the script (text_size).
• Text and background colors can be customized (text_color, bgcolor).
