Hyper Strength Index | QuantLapse🧠 Hyper Strength Index (HSI) | QuantLapse
Overview:
The Hyper Strength Index (HSI) is a composite momentum oscillator designed to unify multiple strength measures into a single, adaptive framework. It combines the Relative Strength Index (RSI), Chande Momentum Oscillator (CMO), Money Flow Index (MFI), and Stochastic RSI to deliver a refined, multidimensional view of market momentum and overbought/oversold conditions.
Unlike traditional oscillators that rely on a single formula, the HSI averages four distinct momentum perspectives — price velocity, directional conviction, volume participation, and stochastic behavior — offering traders a more balanced and noise-resistant reading of market strength.
⚙️ Calculation Logic:
The Hyper Strength Index is computed as the normalized average of:
📈 RSI — classic measure of relative momentum.
💪 CMO — captures directional bias and intensity of moves.
💵 MFI — integrates volume and money flow pressure.
🔄 Stochastic RSI (K-line) — identifies momentum extremes and short-term turning points.
This fusion creates a smoother, more comprehensive signal, mitigating the weaknesses of any single oscillator.
🎯 Interpretation:
Overbought Zone (Default: > 75):
Indicates potential exhaustion of bullish momentum — a cooling phase or reversal may follow.
Oversold Zone (Default: < 7):
Suggests bearish exhaustion — a rebound or accumulation phase may emerge.
Neutral Zone (Between 7 and 75):
Represents balanced market conditions or trend continuation phases.
Visual cues highlight key conditions:
🔺 Red Highlights — Overbought regions or downward inflection points.
🔻 Green Highlights — Oversold regions or upward inflection points.
Neutral zones are shaded with subtle gray backgrounds for clarity.
💡 Key Features:
🔹 Multi-factor strength analysis (RSI + CMO + MFI + StochRSI).
🔹 Adaptive overbought/oversold detection.
🔹 Visual alerts via colored backgrounds and bar markers.
🔹 Customizable smoothing and length parameters for fine-tuning sensitivity.
🔹 Intuitive visualization ideal for both short-term scalping and swing trading setups.
🧭 Usage Notes:
Works best as a momentum confirmation tool — pair with trend filters like EMA, SuperTrend, or ADX.
In trending markets, use crossovers from extreme zones as potential continuation or exhaustion signals.
In ranging markets, exploit overbought/oversold reversals for high-probability mean reversion trades.
📘 Summary:
The Hyper Strength Index | QuantLapse distills multiple dimensions of market strength into a single, cohesive oscillator. By merging price, volume, and directional momentum, it provides traders with a more robust, responsive, and context-aware perspective on market dynamics — a next-generation evolution beyond the limitations of RSI or CMO alone.
CMO

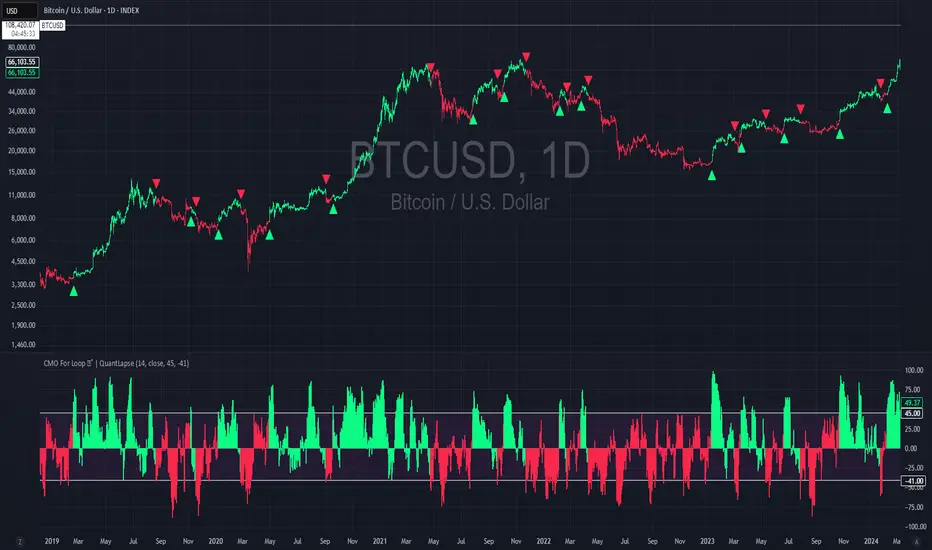
CMO For Loop | QuantLapseCMO For Loop Indicator
The CMO For Loop indicator, inspired by Alex Orekhov's, "Chande Momentum Oscillator," and indicator originally made by Tushar Chande, the CMO designed as a fast and responsive tool to capture quick price movements in financial markets. This oscillator leverages Momentum to measure price deviations, providing a concise yet powerful framework for identifying potential trade entry and exit points. What makes this
"enhanced" CMO indicator special is its ability to identify trending periods more accurately. By using thresholds, this allows the script to enter accurate long and short conditions extremely quickly.
Intended Uses:
Used to capture long-term trends:
Used to identify quick reversals:
Recommended Uses
Best suited for higher timeframes (8H+) to improve accuracy of signals.
Designed for strategies that require fast entries and exits.
Can also be applied to scalping approaches.
Not Recommended For
Should not be used as a mean reversion tool.
Should not be interpreted as a valuation indicator (overbought/oversold levels).
Key Features
Rapid Market Reaction
Built to prioritize speed over smoothing, making it ideal for traders who want to take advantage of quick price shifts in trending or highly volatile markets.
Flexible Thresholds
Users can customize the upper and lower CMO levels to trigger long or short conditions, allowing the indicator to adapt to different assets and trading styles.
Embracing the Noise
Signals may appear frequently, but this is intentional. The tool is optimized for traders who thrive on fast rotations, using the “noise” to catch short-lived yet impactful moves.
Clear Visual Feedback
Plots key oscillator levels and provides dynamic, color-coded candles and shapes that make it easy to identify bias and react quickly.
How It Works
Oscillator Calculation
The CMO (Chande Momentum Oscillator) is derived from comparing the source price’s deviations relative to its momentum. This approach emphasizes trend-driven price shifts.
Signal Triggers
When the oscillator rises above the upper threshold, a long bias is triggered and remains until the CMO drops below the lower threshold.
When the oscillator falls below the lower threshold, a short bias is triggered and remains until the CMO crosses back above the upper threshold.
No bias is active when the oscillator is between thresholds.
Visual Signals
Green candles = long bias
Red candles = short bias
Gray candles = neutral/no signal
Triangles mark points of change in signal direction.
Chande Momentum Oscillator (CMO) Buy Sell Strategy [TradeDots]The "Chande Momentum Oscillator (CMO) Buy Sell Strategy" leverages the CMO indicator to identify short-term buy and sell opportunities.
HOW DOES IT WORK
The standard CMO indicator measures the difference between recent gains and losses, divided by the total price movement over the same period. However, this version of the CMO has some limitations.
The primary disadvantage of the original CMO is its responsiveness to short-term volatility, making the signals less smooth and more erratic, especially in fluctuating markets. This instability can lead to misleading buy or sell signals.
To address this, we integrated the concept from the Moving Average Convergence Divergence (MACD) indicator. By applying a 9-period exponential moving average (EMA) to the CMO line, we obtained a smoothed signal line. This line acts as a filter, identifying confirmed overbought or oversold states, thereby reducing the number of false signals.
Similar to the MACD histogram, we generate columns representing the difference between the CMO and its signal line, reflecting market momentum. We use this momentum indicator as a criterion for entry and exit points. Trades are executed when there's a convergence of CMO and signal lines during an oversold state, and they are closed when the CMO line diverges from the signal line, indicating increased selling pressure.
APPLICATION
Since the 9-period EMA smooths the CMO line, it's less susceptible to extreme price fluctuations. However, this smoothing also makes it more challenging to breach the original +50 and -50 benchmarks.
To increase trading opportunities, we've tightened the boundary ranges. Users can customize the target benchmark lines in the settings to adjust for the volatility of the underlying asset.
The 'cool down period' is essentially the number of bars that await before the next signal generation. This feature is employed to dodge the occurrence of multiple signals in a short period.
DEFAULT SETUP
Commission: 0.01%
Initial Capital: $10,000
Equity per Trade: 80%
Signal Cool Down Period: 5
RISK DISCLAIMER
Trading entails substantial risk, and most day traders incur losses. All content, tools, scripts, articles, and education provided by TradeDots serve purely informational and educational purposes. Past performances are not definitive predictors of future results.

Auto Fibo on IndicatorsThis drawing tool aims to draw auto Fibonacci Retracement Levels on desired indicators.
Users can define the target indicator to draw Auto Fibo Lines, from the "settings tab":
There are six commonly used indicators below the charts that can be selected to draw Fibonacci Retracement lines on:
RSI : Relative Strength Index
CCI : Commodity Channel Index
MFI : Money Flow Index
STOCHASTIC : Stochastic Oscillator
CMF : Chaikin Money Flow
CMO : Chande Momentum Oscillator
Fibonacci Retracement Levels will appear automatically after applying the indicator.
The "Auto Fibo on Indicators" tool looks back. It checks the indicator levels for a desired number of bars and then draws the Fibonacci Levels automatically in the right way, considering the final movements of the indicator.
There are five commonly used Fibonacci Levels added between the Highest and Lowest values such as:
%23.6
%38.2
%50 (Not precisely a Fibonacci Level, indeed)
%61.8 (Golden Ratio)
%78.6
Four extra levels can be added from the settings tab by checking their boxes:
%127.2 (adjustable level)
%161.8
%261.8
%361.8
Default lookback bars of Auto Fibo Levels: 144 (which is also a Fibonacci number)
Default Indicator: RSI
Default Indicator length: 14
Default data source: CLOSE
Users can also define and show overbought and oversold levels by unchecking the "Do not Show Indicator Overbought / Oversold Levels?" button from the settings menu.
In technical analysis, Fibonacci Levels on price can guide valuable trading signals for investors.
Levels can be significant support and resistance levels for breakouts and turning points.
This drawing tool aims to follow those necessary levels on indicators to observe critical levels and breakouts.

Savitzky-Golay Filtered Chande Momentum OscillatorThe Savitzky-Golay Filtered Chande Momentum Oscillator (SGCMO) is a modified version of the Chande Momentum Oscillator that functions as a powerful analytical tool, capable of detecting trends and mean reversals. By applying a Savitzky-Golay filter to the price data, the oscillator provides enhanced visualization and smoother readings. (credit to © anieri for the Savitzky-Golay filter code: www.tradingview.com)
Chande Momentum Oscillator
The Chande Momentum Oscillator (CMO) is a technical indicator developed by Tushar Chande. It measures the momentum of an asset's price movement and provides insights into the overbought or oversold conditions of the market. The CMO calculates the difference between the sum of positive price changes and the sum of negative price changes over a specified period, and then normalizes it to a scale between -100 and +100. Traders and investors use the CMO to identify potential trend reversals, confirm the strength of a current trend, and generate buy or sell signals.
Smoothing
The Savitzky-Golay filter is a digital filter commonly employed for smoothing and noise reduction in time-series data. In the context of the SGCMO, the aim is to effectively smooth the CMO values, reducing the impact of short-term fluctuations and providing clearer insights into underlying trends. Additionally, an exponential moving average (EMA) filter is applied to further reduce noise and enhance trend visibility. This filtered CMO indicator may provide traders and investors with a clearer and more refined representation of momentum changes in the underlying asset, helping them make more informed trading decisions.
Application
The SGCMO serves as both a trend-following and mean-reversion tool. Traders can track the current trend using bullish white lines or bearish orange lines in trending markets. Alternatively, they can utilize green and red vertical lines, which indicate price retracement and help capture pullbacks and reversals. Green vertical lines appear when the trend reverses upwards in an oversold zone (-50 to -80), while red vertical lines indicate negative trend reversals in an overbought zone (50 to 80). Opening long positions when green and white lines appear, or short positions when red and orange lines are visible, can be considered. However, it is advisable to combine this indicator with other complementary technical analysis tools and incorporate it into a comprehensive trading strategy to maximize its effectiveness.

ALMA Smoothed Gaussian Moving AverageThis indicator is an altered version of the Gaussian Moving Average (GMA) (Credit to author: © LeafAlgo ). The GMA applies weights to the prices, giving more importance to the values closer to the current period and gradually diminishing the significance of older prices. The ALMA Smoothed Gaussian Moving Average (ASGMA) applies an ALMA smoothing to its price data to minimize lag and provide a more accurate representation of the underlying trend by dynamically adapting to changing market conditions. The Arnaud Legoux Moving Average (ALMA) is a specialized smoothing technique that adjusts the weights of the moving average based on market volatility. Its calculation uses Wavelet Transform techniques which enables this type of smoothing to capture both high-frequency and low-frequency components of a signal or data. The rationale for this mashup between ALMA and Gaussian filtering is to smooth the moving average line over the smoothed price data and produce stronger trend signals.
ASGMA serves as a trend-following indicator, identifying both bullish and bearish trends. It provides buy and sell signals indicated by "B" and "S" labels plotted alongside the price data. Additionally, the ASGMA's Exponential Moving Average (EMA) line alternates between green and red, indicating bullish and bearish momentum, respectively.
The ASGMA also incorporates two popular momentum indicators, the Relative Strength Index (RSI) and the Chande Momentum Oscillator (CMO). The inclusion of these indicators aims to enhance trend identification and reversal signals. For a strong buy signal, all three indicators (RSI, CMO, and ASGMA) must indicate bullish conditions, resulting in a vertical green line. Conversely, a vertical red line is plotted when all indicators indicate bearish conditions, representing a strong sell signal.
The ASGMA, with its unique combination of smoothing techniques and indicator amalgamation, provides traders and investors with powerful analytical tools. It can be applied in trend-following strategies using the regular buy and sell signals generated by labels and the EMA line. Alternatively, the vertical lines offer stronger buy and sell signals. These features aid in identifying potential entry and exit points, thereby enhancing trading decisions and market analysis. However, it is important to remember that the future performance of any trading strategy is fundamentally unknowable, and past results do not guarantee future performance.

Consensus Oscillator with ADX (LeafAlgo)This indicator creates a normalized consensus from a set of other indicators -- Chande Momentum Oscillator (CMO), Detrended Price Oscillator (DPO), Momentum (MOM), Rate of Change (RoC), Relative Strength Index (RSI), the True Strength Index (TSI) Value line, Volume Oscillator, and a normalized Z-score.
The consensus is created by giving ranged values to each individual indicator. These individual values are added together, then put through a normalization function to create a 0-100 range. The scoring for each indicator is as follows:
CMO:
- If chandeMO <= -50, then the score is valued at -2
- If chandeMO > -50 and chandeMO <= -25, then the score is valued at -1
- If chandeMO > -25 and chandeMO < 25, then the score is valued at 0
- If chandeMO >= 25 and chandeMO < 50, then the score is valued at 1
- If chandeMO >= 50, then the score is valued at 2
DPO:
- If dpo <= -0.005, then the score is valued at -2
- If dpo > -0.005 and dpo <= -0.0025, then the score is valued at -1
- If dpo > -0.0025 and dpo < 0.0025, then the score is valued at 0
- If dpo >= 0.0025 and dpo < 0.005, then the score is valued at 1
- If dpo >= 0.005, then the score is valued at 2
MOM:
- If mom <= -0.05, then the score is valued at -2
- If mom > -0.05 and mom <= -0.025, then the score is valued at -1
- If mom > -0.025 and mom < 0.025, then the score is valued at 0
- If mom >= 0.025 and mom < 0.05, then the score is valued at 1
- If mom >= 0.05, then the score is valued at 2
ROC:
- If roc <= -20, then the score is valued at -2
- If roc > -20 and roc <= -10, then the score is valued at -1
- If roc > -10 and roc < 10, then the score is valued at 0
- If roc >= 10 and roc < 20, then the score is valued at 1
- If roc >= 20, then the score is valued at 2
RSI:
- If rsi <= 20, then the score is valued at -2
- If rsi > 20 and rsi <= 40, then the score is valued at -1
- If rsi > 40 and rsi < 60, then the score is valued at 0
- If rsi >= 60 and rsi < 80, then the score is valued at 1
- If rsi >= 80, then the score is valued at 2
TSI Value:
- If tsi <= -20, then the score is valued at -2
- If tsi > -20 and tsi <= -10, then the score is valued at -1
- If tsi > -10 and tsi < 10, then the score is valued at 0
- If tsi >= 10 and tsi < 20, then the score is valued at 1
- If tsi >= 20, then the score is valued at 2
Volume Oscillator:
- If vo <= -20, then the score is valued at -2
- If vo > -20 and vo <= -10, then the score is valued at -1
- If vo > -10 and vo < 10, then the score is valued at 0
- If vo >= 10 and vo < 20, then the score is valued at 1
- If vo >= 20, then the score is valued at 2
Normalized (-1 to +1) Z-Score:
- If z_n <= -0.5, then the score is valued at -2
- If z_n > -0.5 and z_n <= -0.25, then the score is valued at -1
- If z_n > -0.25 and z_n < 0.25, then the score is valued at 0
- If z_n >= 0.25 and z_n < 0.5, then the score is valued at 1
- If z_n >= 0.5, then the score is valued at 2
The consensus line is colored depending on the closing value of the line. The color is shown as lime if above 70, a darker green between 55 and 70, yellow between 45 and 55, orange between 30 and 45, and red below 30.
Additionally, there is a normalized ADX line added into the indicator to give further confirmation to trend strength. The normalized ADX line is shown as green if above 40, yellow between 40 and 20, and red below 20.
Horizontal lines have been added at 20/30 and 50/60 as semi-important levels to watch.
LeafAlgo Premium Macro StrategiesA "macro score", as defined here, is created by giving various weights to different signals and adding them together to get one smooth score. Positive or negative values are assigned to each of the signals depending on if the statement is true or false (e.g. DPO > 0: +1, DPO < 0: -1). This manner of strategy allows for a subset of the available signals to be present at one time as opposed to every technical signal having to be active in order for a long/short signal to trigger.
This strategy contains SIX different macro score strategies -- "Base DFMA", "Base DFMG", "Ichimoku", "TSI", "Donchian DFMA", and "Donchian DFMG". These strategies have the signals and weights pre-determined in the code. The "Base DFMA" strategy is based on our Democratic Fibonacci Moving Average (DFMA) indicator; the "Donchian DFMA" is the same as the base DFMA strategy, but with a signal from our Donchian Cloud Score indicator as added confluence. The "Base DFMG" strategy is based on our Democratic Fibonacci McGinley Dynamics (DFMG) indicator; the "Donchian DFMG" is the same, but with the Donchian Cloud Score as added confluence. The "Ichimoku" strategy is based on the major sub-indicators found within an Ichimoku Cloud in addition to our Donchian Cloud Score. The "TSI" strategy is based on the True Strength Index.
The ability to select your strategy of choice can be found at the top of the strategy settings under "Strategy Options", then in the drop-down menu labeled "Strategy Choice".
The DFMA - Democratic Fibonacci Moving Average - is a separate indicator that we have released that takes 10 different Fibonacci MAs (lengths of 3 to 233, at Fibonacci intervals) and averages them to form the DFMA line. This helps by creating a consensus on the trend based on moving averages alone. Crossovers of the DFMA with the various Fib MA lengths as well as a cross of the price source and these lines can provide adequate long and short signals. In the two DFMA strategies, the heaviest weights have been given to crosses of the DFMA line/Fib MA (233) as well as the crosses of the Fib MA (3)/DFMA. Additionally, there are thresholds for DPO ( Detrended Price Oscillator , above or below 0), CMO ( Chande Momentum Oscillator , above or below 0), Jurik Volatility Bands (above or below 0), and Stoch RSI (above or below 50). These four signals hold a lighter weight than the MA cross signals. The macro score itself ranges between -10 and 10. In addition to the macro score line, a momentum line (sourced by the macro score itself) has been included. A crossover/crossunder of the macro score and the macro momentum line is included into the long/short signal syntax in addition to a threshold for the macro score.
The DFMG - Democratic Fibonacci McGinley Dynamics - is a separate indicator that we have released that takes 10 different Fibonacci McGinley Dynamic liness (lengths of 3 to 233, at Fibonacci intervals) and averages them to form the DFMG line. This helps by creating a consensus on the trend based on moving averages alone. Crossovers of the DFMG with the various Fib MG lengths as well as a cross of the price source and these lines can provide adequate long and short signals. This strategy has the signals and weights pre-determined in the code. Heaviest weights have been given to crosses of the DFMG line/ McGinley (233) as well as the crosses of the McGinley (3)/DFMG. Additionally, there are thresholds for DPO ( Detrended Price Oscillator , above or below 0), CMO ( Chande Momentum Oscillator , above or below 0), Jurik Volatility Bands (above or below 0), and Stoch RSI (above or below 50). These four signals hold a lighter weight than the McGinley cross signals. The macro score itself ranges between -10 and 10. In addition to the macro score line, a momentum line (sourced by the macro score itself) has been included. A crossover/crossunder of the macro score and the macro momentum line is included into the long/short signal syntax in addition to a threshold for the macro score.
For the Ichimoku macro score, five signals were considered and weighted equally:
- Kijun-sen < Ichimoku Source
- Tenkan-sen < Ichimoku Source
- Kijun-sen > Chikou-span
- Tenkan-sen > Kijun-sen
- Senkou Span A > Senkou Span B
In addition to these factors, the Ichimoku strategy utilizes the Donchian Cloud Score in the long and short entry signals. Thus, the Donchian Cloud settings are applicable to this strategy.
For the True Strength Index strategy, the heaviest weights have been given to various TSI signals, including a crossover/crossunder of TSI signal and TSI value, a threshold for the TSI Signal (above or below 0), and a crossover/crossunder of the CMO ( Chande Momentum Oscillator ) and the TSI signal line. Additionally, there are thresholds for DPO ( Detrended Price Oscillator , above or below 0), Jurik Volatility Bands (above or below 0), and Stoch RSI (above or below 50). These three signals hold a lighter weight than the three TSI signals. The macro score itself ranges between -10 and 10. In addition to the macro score line, a momentum line (sourced by the macro score itself) has been included. A crossover/crossunder of the macro score and the macro momentum line is included into the long/short signal syntax in addition to a threshold for the macro score.
The Donchian Cloud Score is derived from a set of 5 Donchian channels (upper, lower, and basis plotted) defaulted to lengths of 25, 50, 100, 150, and 200. A set of conditions associated with the channels aims to determine ranging versus trending markets. Weights are given to these conditions accordingly, then tallied up to determine the "cloud score", ranging between -25 and 25. In general, a ranging market is determined by a cloud score between -10 and 10, while a positive trending market has a score higher than 10 and a negative trending market has a score lower than -10. That said, long and short thresholds similar to the macro score itself are included in the user settings and set to a default of 5 or -5. The cloud score is plotted as a line in the underlay with coloration reflecting ranging or trending markets (green color above the long threshold, gray between the thresholds, and red below the short threshold). The cloud score is incorporated into the strategy syntax for long and short positions in that the score must be above or below the set threshold for a trade to be placed. A breakdown for the Donchian scoring is as follows:
- Broke the 25-length DC (DC(25)) upper band in the previous 3 bars - +1 if true, 0 if false
- Broke the DC(50) upper band in the previous 3 bars - +2 if true, 0 if false
- Broke the DC(100) upper band in the previous 3 bars - +3 if true, 0 if false
- Broke the DC(150) upper band in the previous 3 bars - +4 if true, 0 if false
- Broke the DC(200) upper band in the previous 3 bars - +5 if true, 0 if false
- Broke the DC(25) lower band in the previous 3 bars - -1 if true, 0 if false
- Broke the DC(50) lower band in the previous 3 bars - -2 if true, 0 if false
- Broke the DC(100) lower band in the previous 3 bars - -3 if true, 0 if false
- Broke the DC(150) lower band in the previous 3 bars - -4 if true, 0 if false
- Broke the DC(200) lower band in the previous 3 bars - -5 if true, 0 if false
- DC(25) basis line above the DC(50) basis line - +1 if true, -1 if false
- DC(25) basis line above the DC(100) basis line - +1 if true, -1 if false
- DC(25)basis line above the DC(150) basis line - +1 if true, -1 if false
- DC(25) basis line above the DC(200) basis line - +1 if true, -1 if false
- DC(50) basis line above the DC(100) basis line - +1 if true, -1 if false
- DC(50) basis line above the DC(150) basis line - +1 if true, -1 if false
- DC(50) basis line above the DC(200) basis line - +1 if true, -1 if false
- DC(100) basis line above the DC(150) basis line - +1 if true, -1 if false
- DC(100) basis line above the DC(200) basis line - +1 if true, -1 if false
- DC(150) basis line above the DC(200) basis line - +1 if true, -1 if false
Thresholds for both the respective macro score and the Donchian Cloud score have been included. Entry signals for each strategy require the score to be >= the respective thresholds for longs and <= the respective thresholds for shorts.
Additionally, a normalized z-score has been included. The z-score does not affect the entry and exit signals, however, it is displayed on the chart in the form of bar coloration. The z-score has been normalized to a range of -1 to +1. A z-score under -0.60 is displayed as a red bar color, a score between -0.60 and -0.2 is displayed as an orange bar color, a score between -0.2 and 0.2 is displayed as a gray bar color, a score between 0.2 and 0.6 is displayed as a lime bar color, and a score over 0.6 is displayed in green.
Data for each respective strategy will be displayed in an overlaid table. This includes the factors that comprise the macro score of choice, the values of each signal that adds up to the macro score, the macro score itself, the value of the momentum line of the macro score, the normalized z-score value, and the Donchian Cloud score (if applicable). Green coloration notes bullish sentiment within the signals or values, gray coloration is neutral, and red coloration notes bearish sentiment.
Take profit, stop loss, and trailing percentages are also included, found at the bottom of the Input tab under “TT and TTP” as well as “Stop Loss”. The take profit and stop loss levels will be reflected as green and red lines respectively on the chart as they occur. Make sure to understand the TP/SL ratio that you desire before use, as the desired hit rate/profitability percentage will be affected accordingly. The option for adding in a trailing stop has also been included, with options to choose between an ATR-based trail or a percentage-based trail. This strategy does NOT guarantee future returns. Apply caution in trading regardless of discretionary or algorithmic. Understand the concepts of risk/reward and the intricacies of each strategy choice before utilizing them in your personal trading.
Profitview/Pineconnector Settings:
If you wish to utilize Profitview’s automation system, find the included “Profitview Settings” under the Input tab of the strategy settings menu. If not, skip this section entirely as it can be left blank. Options will be “OPEN LONG TITLE”, “OPEN SHORT TITLE”, “CLOSE LONG TITLE”, and “CLOSE SHORT TITLE”. If you wished to trade SOL, for example, you would put “SOL LONG”, “SOL SHORT”, “SOL CLOSE LONG”, and “SOL CLOSE SHORT” in these areas. Within your Profitview extension, ensure that your Alerts all match these titles. To set an alert for use with Profitview, go to the “Alerts” tab in TradingView, then create an alert. Make sure that your desired asset and timeframe are currently displayed on your screen when creating the alert. Under the “Condition” option of the alert, select the strategy, then select the expiration time. If using TradingView Premium, this can be open-ended. Otherwise, select your desired expiration time and date. This can be updated whenever desired to ensure the strategy does not expire. Under “Alert actions”, nothing necessarily needs to be selected unless so desired. Leave the “Alert name” option empty. For the “Message”, delete the generated message and replace it with {{strategy.order.alert_message}} and nothing else. If using Pineconnector, follow the same directions for setting up an alert, but use the ",buy,,risk=" syntax as noted in the tooltips.
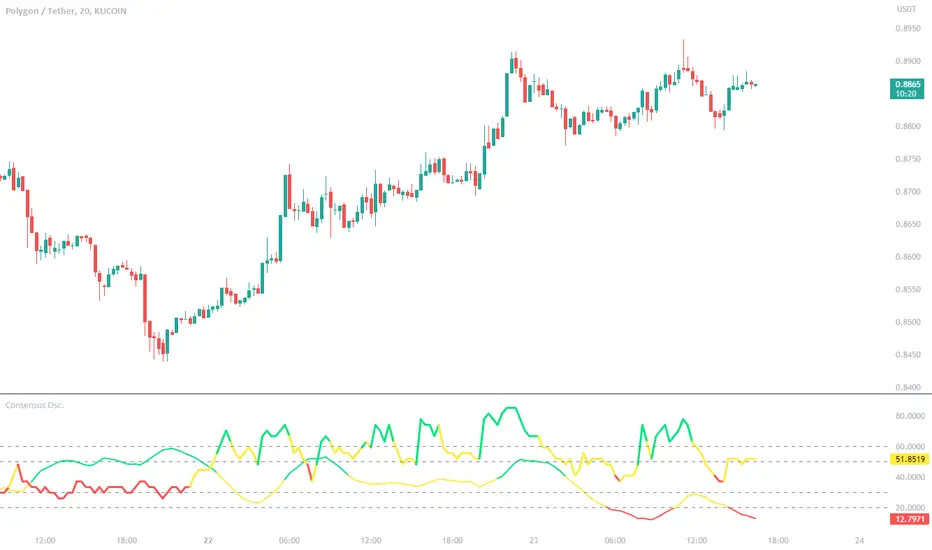
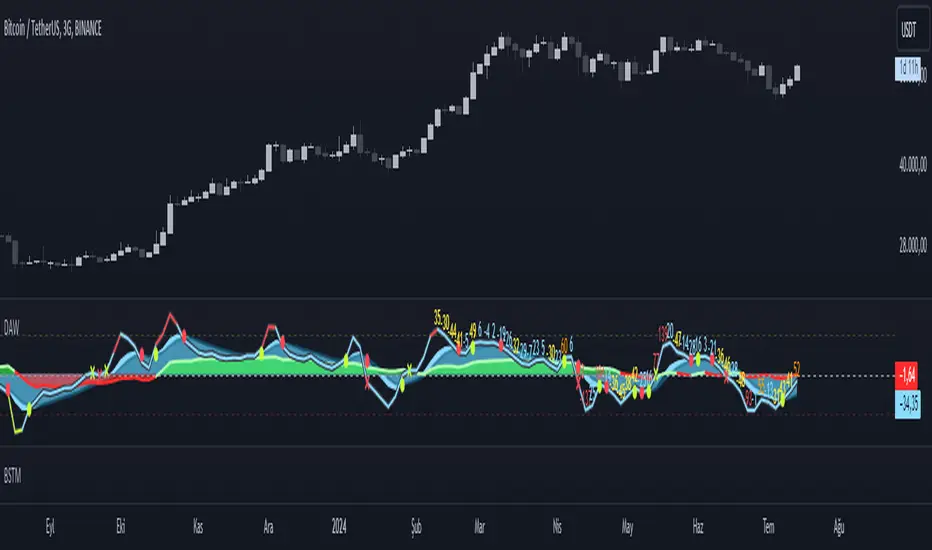
Direction Analysis WavesDescription
It is an indicator that aims to provide information about the direction of the trend, the basis of which is the CCI, CMO and MFI indices.
Symbols on the indicator are for informational purposes. Information about colors and symbols is given below.
Blue Wave: Graphical representation of the Commodity Channel Index (CCI) curve.
Green/Red Wave: Graphical representation of the Chande Momentum Oscillator (CMO) curve. This curve turns green when it rises above zero, and turns red when it falls below zero.
Yellow Wave: Graphical representation of the Money Flow Index (MFI) curve.
Blue Line: CCI line.
Green/Red Cross: CCI line shows green cross on red cross below 0 value.
Warning
As a result, this indicator should be expected to give an idea of the trend direction, not a trading signal.
Version
v1.0
Macro Score (DFMA) and Donchian Cloud Score StrategyA "macro score", as defined here, is created by giving various weights to different signals and adding them together to get one smooth score. Positive or negative values are assigned to each of the signals depending on if the statement is true or false (e.g. DPO > 0: +1, DPO < 0: -1). This manner of strategy allows for a subset of the available signals to be present at one time as opposed to every technical signal having to be active in order for a long/short signal to trigger.
The DFMA - Democratic Fibonacci Moving Average - is a separate indicator that we have released that takes 10 different Fibonacci MAs (lengths of 3 to 233, at Fibonacci intervals) and averages them to form the DFMA line. This helps by creating a consensus on the trend based on moving averages alone. Crossovers of the DFMA with the various Fib MA lengths as well as a cross of the price source and these lines can provide adequate long and short signals.
This strategy has the signals and weights pre-determined in the code. Heaviest weights have been given to crosses of the DFMA line/Fib MA (233) as well as the crosses of the Fib MA (3)/DFMA. Additionally, there are thresholds for DPO ( Detrended Price Oscillator , above or below 0), CMO ( Chande Momentum Oscillator , above or below 0), Jurik Volatility Bands (above or below 0), and Stoch RSI (above or below 50). These four signals hold a lighter weight than the MA cross signals.
The macro score itself is printed in an underlay as a white line that goes between -10 and 10 for this strategy. In addition to the macro score line, a blue momentum line (sourced by the macro score itself) has been included. A crossover/crossunder of the macro score and the macro momentum line is included into the long/short signal syntax in addition to a threshold for the macro score. Long and short thresholds can be determined by the user in the settings menu.
The Donchian Cloud Score is derived from a set of 5 Donchian channels (upper, lower, and basis plotted) defaulted to lengths of 25, 50, 100, 150, and 200. A set of conditions associated with the channels aims to determine ranging versus trending markets. Weights are given to these conditions accordingly, then tallied up to determine the "cloud score", ranging between -25 and 25. In general, a ranging market is determined by a cloud score between -10 and 10, while a positive trending market has a score higher than 10 and a negative trending market has a score lower than -10. That said, long and short thresholds similar to the macro score itself are included in the user settings and set to a default of 5 or -5. The cloud score is plotted as a line in the underlay with coloration reflecting ranging or trending markets (green color above the long threshold, gray between the thresholds, and red below the short threshold). The cloud score is incorporated into the strategy syntax for long and short positions in that the score must be above or below the set threshold for a trade to be placed. A breakdown for the Donchian scoring is as follows:
- Broke the 25-length DC (DC(25)) upper band in the previous 3 bars - +1 if true, 0 if false
- Broke the DC(50) upper band in the previous 3 bars - +2 if true, 0 if false
- Broke the DC(100) upper band in the previous 3 bars - +3 if true, 0 if false
- Broke the DC(150) upper band in the previous 3 bars - +4 if true, 0 if false
- Broke the DC(200) upper band in the previous 3 bars - +5 if true, 0 if false
- Broke the DC(25) lower band in the previous 3 bars - -1 if true, 0 if false
- Broke the DC(50) lower band in the previous 3 bars - -2 if true, 0 if false
- Broke the DC(100) lower band in the previous 3 bars - -3 if true, 0 if false
- Broke the DC(150) lower band in the previous 3 bars - -4 if true, 0 if false
- Broke the DC(200) lower band in the previous 3 bars - -5 if true, 0 if false
- DC(25) basis line above the DC(50) basis line - +1 if true, -1 if false
- DC(25) basis line above the DC(100) basis line - +1 if true, -1 if false
- DC(25)basis line above the DC(150) basis line - +1 if true, -1 if false
- DC(25) basis line above the DC(200) basis line - +1 if true, -1 if false
- DC(50) basis line above the DC(100) basis line - +1 if true, -1 if false
- DC(50) basis line above the DC(150) basis line - +1 if true, -1 if false
- DC(50) basis line above the DC(200) basis line - +1 if true, -1 if false
- DC(100) basis line above the DC(150) basis line - +1 if true, -1 if false
- DC(100) basis line above the DC(200) basis line - +1 if true, -1 if false
- DC(150) basis line above the DC(200) basis line - +1 if true, -1 if false
Take profit, stop loss, and trailing percentages are also included, found at the bottom of the Input tab under “TT and TTP” as well as “Stop Loss”. Make sure to understand the TP/SL ratio that you desire before use, as the desired hit rate/profitability percentage will be affected accordingly. The option for adding in a trailing stop has also been included, with options to choose between an ATR-based trail or a percentage-based trail. This strategy does NOT guarantee future returns. Apply caution in trading regardless of discretionary or algorithmic. Understand the concepts of risk/reward and the intricacies of each strategy choice before utilizing them in your personal trading.
Profitview/Pineconnector Settings:
If you wish to utilize Profitview’s automation system, find the included “Profitview Settings” under the Input tab of the strategy settings menu. If not, skip this section entirely as it can be left blank. Options will be “OPEN LONG TITLE”, “OPEN SHORT TITLE”, “CLOSE LONG TITLE”, and “CLOSE SHORT TITLE”. If you wished to trade SOL, for example, you would put “SOL LONG”, “SOL SHORT”, “SOL CLOSE LONG”, and “SOL CLOSE SHORT” in these areas. Within your Profitview extension, ensure that your Alerts all match these titles. To set an alert for use with Profitview, go to the “Alerts” tab in TradingView, then create an alert. Make sure that your desired asset and timeframe are currently displayed on your screen when creating the alert. Under the “Condition” option of the alert, select the strategy, then select the expiration time. If using TradingView Premium, this can be open-ended. Otherwise, select your desired expiration time and date. This can be updated whenever desired to ensure the strategy does not expire. Under “Alert actions”, nothing necessarily needs to be selected unless so desired. Leave the “Alert name” option empty. For the “Message”, delete the generated message and replace it with {{strategy.order.alert_message}} and nothing else. If using Pineconnector, follow the same directions for setting up an alert, but use the ",buy,,risk=" syntax as noted in the tooltips.

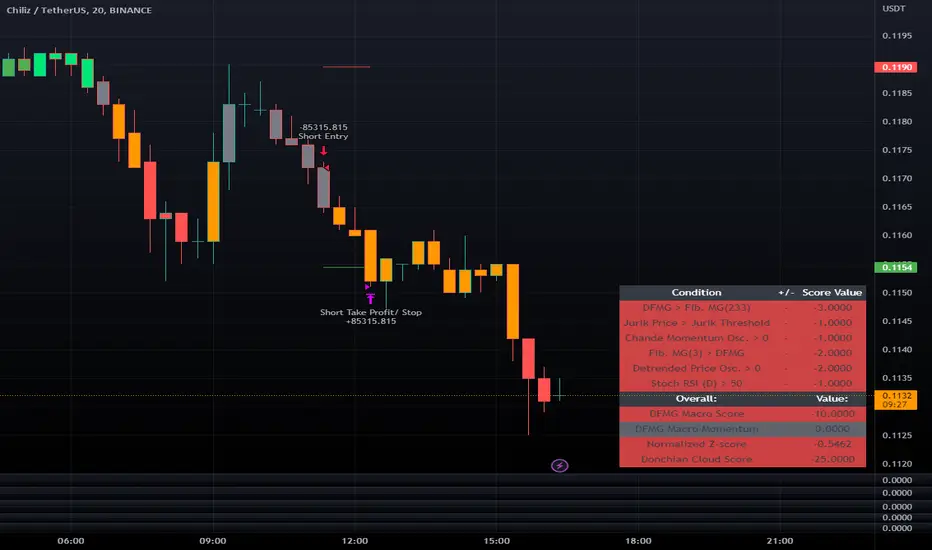
Macro Score - Dem. Fib. McGinley DynamicsA "macro score", as defined here, is created by giving various weights to different signals and adding them together to get one smooth score. Positive or negative values are assigned to each of the signals depending on if the statement is true or false (e.g. DPO > 0: +1, DPO < 0: -1). This manner of strategy allows for a subset of the available signals to be present at one time as opposed to every technical signal having to be active in order for a long/short signal to trigger.
The DFMG - Democratic Fibonacci McGinley Dynamic - is a separate indicator that we have released that takes 10 different Fibonacci McGinley Dynamics (lengths of 3 to 233, at Fibonacci intervals) and averages them to form the DFMG line. This helps by creating a consensus on the trend based on these dynamic lines alone. Crossovers of the DFMG with the various McGinley lengths as well as a cross of the price source and these lines can provide adequate long and short signals.
This strategy has the signals and weights pre-determined in the code. Heaviest weights have been given to crosses of the DFMG line/McGinley(233) as well as the crosses of the McGinley(3)/DFMG. Additionally, there are thresholds for DPO ( Detrended Price Oscillator , above or below 0), CMO ( Chande Momentum Oscillator , above or below 0), Jurik Volatility Bands (above or below 0), and Stoch RSI (above or below 50). These four signals hold a lighter weight than the McGinley cross signals.
The macro score itself is printed in an underlay as a white line that goes between -10 and 10 for this strategy. In addition to the macro score line, a green momentum line (sourced by the macro score itself) has been included. A crossover/crossunder of the macro score and the macro momentum line is included into the long/short signal syntax in addition to long and short thresholds for the macro score, defaulted to 5 and -5 respectively.
Take profit, stop loss, and trailing percentages are also included, found at the bottom of the Input tab under “TT and TTP” as well as “Stop Loss”. Make sure to understand the TP/SL ratio that you desire before use, as the desired hit rate/profitability percentage will be affected accordingly. The option for adding in a trailing stop has also been included, with options to choose between an ATR-based trail or a percentage-based trail.
This strategy does NOT guarantee future returns. Apply caution in trading regardless of discretionary or algorithmic. Understand the concepts of risk/reward and the intricacies of each strategy choice before utilizing them in your personal trading.
Profitview/Pineconnector Settings:
If you wish to utilize Profitview’s automation system, find the included “Profitview Settings” under the Input tab of the strategy settings menu. If not, skip this section entirely as it can be left blank. Options will be “OPEN LONG TITLE”, “OPEN SHORT TITLE”, “CLOSE LONG TITLE”, and “CLOSE SHORT TITLE”. If you wished to trade SOL, for example, you would put “SOL LONG”, “SOL SHORT”, “SOL CLOSE LONG”, and “SOL CLOSE SHORT” in these areas. Within your Profitview extension, ensure that your Alerts all match these titles. To set an alert for use with Profitview, go to the “Alerts” tab in TradingView, then create an alert. Make sure that your desired asset and timeframe are currently displayed on your screen when creating the alert. Under the “Condition” option of the alert, select the strategy, then select the expiration time. If using TradingView Premium, this can be open-ended. Otherwise, select your desired expiration time and date. This can be updated whenever desired to ensure the strategy does not expire. Under “Alert actions”, nothing necessarily needs to be selected unless so desired. Leave the “Alert name” option empty. For the “Message”, delete the generated message and replace it with {{strategy.order.alert_message}} and nothing else. If using Pineconnector, follow the same directions for setting up an alert, but use the " ,buy, ,risk=" syntax as noted in the tooltips.
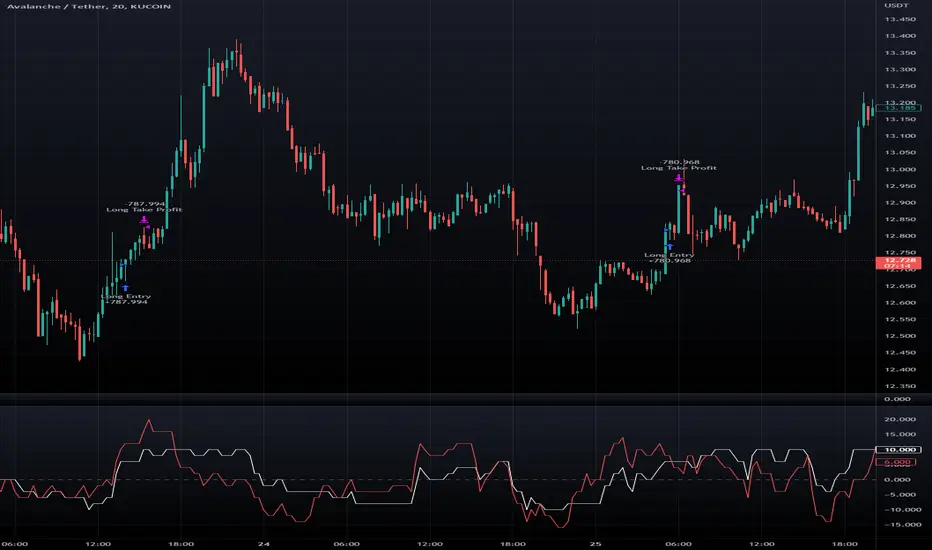
Default Properties for AVAX 20M:
DPO - 35 , uncentered
CMO - 25, open
K/D - 3/3
RSI Stoch Length - 3
Stoch Length - 4
Stoch Source - open
JVB Length - 14
JVB Smoothing - 2
DFMG source - close
Macro Length - 14
TP % - 1.5%
TTP % - 0.005%
SL % - 1.8%, no trail

Consensus Tables - Oscillators, Multi-MA , DFMA, and IchimokuThis indicator is a series of underlaid tables that determine a consensus value using a simple positive or negative score for a set signal. This consensus value is also shown as a histogram and reflected on the chart's bar colors. There are a total of four different table options to choose from: a set of trend and volume oscillators, a set of 11 moving averages, a set of Fibonacci moving averages and their own consensus line, and a set of Ichimoku-based conditions. The type of table can be chosen from a drop-down menu at the top of the user settings, with settings for each of the table types grouped up respectively.
Oscillator Table:
The Oscillator table consists of the Average Directional Index (ADX) set as a value instead of +/- and is not used in the scoring to gather consensus. Rather, a value of 25 or above is used to confirm the trend regardless of positive or negative. The Chande Momentum Oscillator (CMO), Detrended Price Oscillator (DPO), Momentum, Rate of Change (ROC), Relative Strength Index (RSI), True Strength Index (TSI), and Volume Oscillator are used in the Oscillator table for a consensus value and given a + or - depending on the condition being met. The conditions and weighting are as follows:
-- CMO > or < 0, given a weight of +/- 2
-- DPO > or < 0, given a weight of +/- 2
-- Momentum > or < 0, given a weight of +/- 2
-- ROC > or < 0, given a weight of +/- 2
-- RSI > or < 50, given a weight of +/- 1
-- TSI Value Line > or < 0, given a weight of +/- 1
-- TSI Signal Line > or < 0, given a weight of +/- 1
-- Volume Osc. > or < 0, given a weight of +/- 2
The consensus value is determined by adding these values together and dividing by 13.
Multi-MA Table:
For the Moving Average Ribbon/Multi-MA table the user is able to determine the source, type, and lengths of 11 moving averages. The type selection consists of EMA, DEMA, TEMA, SMA, RMA, VWMA, WMA, SMMA, and a Hull MA. The preset values for the 11 moving averages are 5, 7, 10, 14, 21, 26, 50, 75, 100, 150, and 200. The consensus conditions and weighting are as follows:
-- If MA(1 through 10) < or > the price source, given a weight of +/- 1
-- If MA(11) < or > the price source, given a weight of +/- 2
The consensus value is determined by adding these values together and dividing by 12.
DFMA Table:
The Democratic Fibonacci Moving Average table is derived from our indicator of the same name. The source for the DFMA can be chosen by the user, but the SMA lengths are predetermined in Fibonacci intervals from 3 to 233. The DFMA line itself is determined by finding the average value of these 10 Fibonacci MA lengths. The consensus conditions and weighting are as follows:
-- If Fib. MA (3-233) < or > the source, given a weight of +/- 1
-- If DFMA value < or > the source, given a weight of +/- 2
The consensus value is determined by adding these values together and dividing by 12.
Ichimoku Table:
The Ichimoku table values a handful of conditions using the Tenkan-sen/Conversion Line, Kijun-sen/Base Line, Senkou-span A and B, and the Chikou-span, each of which are given their standard values of 9, 26, 52, and 26, respectively, but can be changed in the user settings if desired. As opposed to the other tables, there are fewer conditions to be met and given values to. All of the conditions are given the same weighting (+/- 1). The conditions are as follows:
-- Kijun-sen < or > the source
-- Tenkan-sen < or > the source
-- Kijun-sen > or < the Chikou-span
-- Tenkan-sen > or < the Kijou-sen
-- Senkou Span A > or < Senkou Span B
The consensus value is determined by dividing the total value by 5.
Overall consensus and overall trend values are given alongside each of these options. The overall consensus value is determined by taking the average of the 4 respective consensus values. Trend values are determined as such:
-- If consensus value >= 0.75, considered a "Strong Buy"
-- If consensus value is between 0.25 and 0.75, considered a "Buy"
-- If consensus value is between 0.25 and -0.25, considered "Neutral"
-- If consensus value is between -0.25 and -0.75, considered a "Sell"
-- If consensus value is <= -0.75, considered a "Strong Sell"
Table colors are set as either green, red, or gray to reflect positive, negative, and neutral sentiment sentiment. Bar colors reflect the consensus value and the determined table trend:
-- If trend for the chosen table is "Strong Buy", bar color is green
-- If trend for the chosen table is "Buy", bar color is lime
-- If trend for the chosen table is "Neutral", bar color is gray
-- If trend for the chosen table is "Sell", bar color is orange
-- If trend for the chosen table is "Strong Sell", bar color is red

Macro Score - DFMA-BasedA "macro score", as defined here, is created by giving various weights to different signals and adding them together to get one smooth score. Positive or negative values are assigned to each of the signals depending on if the statement is true or false (e.g. DPO > 0: +1, DPO < 0: -1). This manner of strategy allows for a subset of the available signals to be present at one time as opposed to every technical signal having to be active in order for a long/short signal to trigger.
The DFMA - Democratic Fibonacci Moving Average - is a separate indicator that we have released that takes 10 different Fibonacci MAs (lengths of 3 to 233, at Fibonacci intervals) and averages them to form the DFMA line. This helps by creating a consensus on the trend based on moving averages alone. Crossovers of the DFMA with the various Fib MA lengths as well as a cross of the price source and these lines can provide adequate long and short signals.
This strategy has the signals and weights pre-determined in the code. Heaviest weights have been given to crosses of the DFMA line/Fib MA (233) as well as the crosses of the Fib MA (3)/DFMA. Additionally, there are thresholds for DPO ( Detrended Price Oscillator , above or below 0), CMO ( Chande Momentum Oscillator , above or below 0), Jurik Volatility Bands (above or below 0), and Stoch RSI (above or below 50). These foursignals hold a lighter weight than the MA cross signals.
The macro score itself is printed in an underlay as a white line that goes between -10 and 10 for this strategy. In addition to the macro score line, a blue momentum line (sourced by the macro score itself) has been included. A crossover/crossunder of the macro score and the macro momentum line is included into the long/short signal syntax in addition to a threshold for the macro score (-5/5).
Take profit, stop loss, and trailing percentages are also included, found at the bottom of the Input tab under “TT and TTP” as well as “Stop Loss”. Make sure to understand the TP/SL ratio that you desire before use, as the desired hit rate/profitability percentage will be affected accordingly. This strategy does NOT guarantee future returns. Apply caution in trading regardless of discretionary or algorithmic. Understand the concepts of risk/reward and the intricacies of each strategy choice before utilizing them in your personal trading.
Profitview Settings:
If you wish to utilize Profitview’s automation system, find the included “Profitview Settings” under the Input tab of the strategy settings menu. If not, skip this section entirely as it can be left blank. Options will be “OPEN LONG TITLE”, “OPEN SHORT TITLE”, “CLOSE LONG TITLE”, and “CLOSE SHORT TITLE”. If you wished to trade SOL, for example, you would put “SOL LONG”, “SOL SHORT”, “SOL CLOSE LONG”, and “SOL CLOSE SHORT” in these areas. Within your Profitview extension, ensure that your Alerts all match these titles. To set an alert for use with Profitview, go to the “Alerts” tab in TradingView, then create an alert. Make sure that your desired asset and timeframe are currently displayed on your screen when creating the alert. Under the “Condition” option of the alert, select the strategy, then select the expiration time. If using TradingView Premium, this can be open-ended. Otherwise, select your desired expiration time and date. This can be updated whenever desired to ensure the strategy does not expire. Under “Alert actions”, nothing necessarily needs to be selected unless so desired. Leave the “Alert name” option empty. For the “Message”, delete the generated message and replace it with {{strategy.order.alert_message}} and nothing else.
Default Properties, for AVAX 20M:
DPO - 40, uncentered
CMO - 25, open
K/D - 3/3
RSI Stoch Length - 3
Stoch Length - 4
Stoch Source - open
JVB Length - 25
JVB Smoothing - 2
DFMA source - close
Macro Length - 13
TP % - 1.5%
TTP % - 0.005%
SL % - 2%

Oscillator ExtremesThe Oscillator Extremes indicator plots the normalized positioning of the selected oscillator versus the Bollinger Bands' upper and lower boundaries. Currently, this indicator has four different oscillators to choose from; RSI, CMO, CCI, and ROC.
When the oscillator pushes towards one extreme, it will bring the value of the prevailing line closer to zero. If the bullish or bearish line crosses the zero line, the oscillator is past the extreme of the Bollinger Band.
Example: If the RSI crosses over the upper boundary of the Bollinger, the bullish(green) line will cross under the zero line.
Crossovers of the bullish and bearish lines can indicate a shift in momentum and are a signal. Where the line crossing under, towards zero, is the prevailing trend. The plotted lines will highlight green(bullish) or red(bearish) to show the prevailing trend. This is similar to a DI+- crossover that is commonly associated with the ADX.
We have included an optional normalized ADX to help validate signals. The ADX will change color based on the slope of the ADX. Purple indicates a positive slope and white for a negative slope.

Macro Score -- User-Customized Scores and SignalsA "macro score", as defined here, is created by giving various weights to different signals and adding them together to get one smooth score. Positive or negative values are assigned to each of the signals depending on if the statement is true or false (e.g. DPO > 0: +1, DPO < 0: -1). This manner of strategy allows for a subset of the available signals to be present at one time as opposed to every technical signal having to be active in order for a long/short signal to trigger. This particular strategy allows the user to choose between 18 different signals to be used in scoring as well as allowing the user to determine the individual weights of each score as well as the overall threshold to determine long or short signals. Weights for each score range between 1 and 5, with 5 being the greatest weight. The overall threshold for long or short is dependent on the total possible weights added together (i.e. if your weights total -10 or +10, a threshold within this range must be used).
The macro score itself is printed in an underlay as a white line that goes between the maximum positive and negative values for all weights added together for this strategy. In addition to the macro score line, a green momentum line (sourced by the macro score itself) has been included. A crossover/crossunder of the macro score and the macro momentum line is included into the long/short signal syntax in addition to a threshold for the macro score. The length of the Macro Score's momentum line can be found in the settings.
The current signals to choose from include:
- ADX Threshold - if the Average Directional Index is above a set threshold, signal positive or negative
- CMF Threshold - if the Chaikin Money Flow oscillator is above 0, signal positive; otherwise, signal negative
- CMO > TSI Signal - signal positive if there is a cross of the Chande Momentum Oscillator and the True Strength Index signal line
- CMO Threshold - if the Chande Momentum Oscillator is above 0, signal positive; otherwise, signal negative
- DPO Threshold - if the Detrended Price Oscillator is above 0, signal positive; otherwise, signal negative
- EOM Threshold - if the Ease of Money Oscillator is above 0, signal positive; otherwise, signal negative
- Jurik Threshold - if the Jurik price line (from the Jurik Volatility Bands) is above 0, signal positive; otherwise, signal negative
- MACD Threshold - if the MACD signal line is above 0, signal positive; otherwise, signal negative
- McGinley Cross - a crossover of a fast McGinley Dynamic length line and a slow McGinley Dynamic line signals positive; otherwise, signal negative
- PSAR - if the direction of the PSAR is heading long, signal positive; otherwise, signal negative
- ROC Threshold - if the Rate of Change oscillator is above 0, signal positive; otherwise, signal negative
- RSI Threshold - if the Relative Strength Index is above 50, signal positive; otherwise, signal negative
- Stoch RSI Threshold - if the Stoch RSI is above 50, signal positive; otherwise, signal negative
- Supertrend - if the Supertrend determines long, signal positive; otherwise, signal negative
- TSI Cross - a crossover of the True Strength Index value line and the TSI signal line signals positive; otherwise, signal negative
- TSI Signal Threshold - if the TSI signal line is above 0, signal positive; otherwise, signal negative
- Williams Alligator Cross - if the Williams Alligator lips cross the teeth and jaw, signal positive; otherwise, signal negative
- Williams %R - if the Williams %R is above -50, signal positive; otherwise, signal negative
Take profit, stop loss, and trailing percentages are also included, found at the bottom of the Input tab under “TT and TTP” as well as “Stop Loss”. Make sure to understand the TP/SL ratio that you desire before use, as the desired hit rate/profitability percentage will be affected accordingly. This strategy does NOT guarantee future returns. Apply caution in trading regardless of discretionary or algorithmic. Understand the concepts of risk/reward and the intricacies of each strategy choice before utilizing them in your personal trading.
Profitview Settings:
If you wish to utilize Profitview’s automation system, find the included “Profitview Settings” under the Input tab of the strategy settings menu. If not, skip this section entirely as it can be left blank. Options will be “OPEN LONG TITLE”, “OPEN SHORT TITLE”, “CLOSE LONG TITLE”, and “CLOSE SHORT TITLE”. If you wished to trade SOL, for example, you would put “SOL LONG”, “SOL SHORT”, “SOL CLOSE LONG”, and “SOL CLOSE SHORT” in these areas. Within your Profitview extension, ensure that your Alerts all match these titles. To set an alert for use with Profitview, go to the “Alerts” tab in TradingView, then create an alert. Make sure that your desired asset and timeframe are currently displayed on your screen when creating the alert. Under the “Condition” option of the alert, select the strategy, then select the expiration time. If using TradingView Premium, this can be open-ended. Otherwise, select your desired expiration time and date. This can be updated whenever desired to ensure the strategy does not expire. Under “Alert actions”, nothing necessarily needs to be selected unless so desired. Leave the “Alert name” option empty. For the “Message”, delete the generated message and replace it with {{strategy.order.alert_message}} and nothing else.
Sample setup for SOLUSDT 30M:
- Score 1 - Value 4, PSAR (0.05 start, 0.02 increment, 0.2 max value; sourced open)
- Score 2 - Value 4, Jurik Threshold (JVB Length 25, JVB Smoothing 6, JVB Price Threshold 0)
- Score 3 - Value 5, DPO Threshold (DPO Length 40, uncentered)
- Score 4 - Value 5, CMO Threshold (CMO Length 40, sourced open)
- Score 5 - Value 2, MACD Threshold (Fast Length 12, Slow Length 30, sourced open)
- Macro Length 21
- Long Threshold - -3
- Short Threshold - +3
- Take Profit % - 0.9/0.9
- Trail % - 0.005
- Stop Loss % - 1.4
Sample setup for AVAXUSDT 20M:
- Score 1 - Value 3, TSI Cross (Long Length 25, Short Length 16, Signal Length 17)
- Score 2 - Value 2, TSI Signal Threshold (same settings as the TSI Cross)
- Score 3 - Value 2, Jurik Threshold (JVB Length 20, JVB Smoothing 8, JVB Price Threshold 0)
- Score 4 - Value 2, DPO Threshold (DPO Length 40, uncentered)
- Score 5 - Value 1, Stoch Threshold (K/D 3, RSI (Stoch) Length 10, Stochastic Length 4, sourced open)
- Macro Length 13
- Long Threshold - +5
- Short Threshold - -5
- Take Profit % - 1.2/1.2
- Trail % - 0.005
- Stop Loss % - 1.5

Macro Score - TSI-BasedA "macro score", as defined here, is created by giving various weights to different signals and adding them together to get one smooth score. Positive or negative values are assigned to each of the signals depending on if the statement is true or false (e.g. DPO > 0: +1, DPO < 0: -1). This manner of strategy allows for a subset of the available signals to be present at one time as opposed to every technical signal having to be active in order for a long/short signal to trigger.
This strategy has the signals and weights pre-determined in the code. Heaviest weights have been given to various TSI (True Strength Index) signals, including a crossover/crossunder of TSI signal and TSI value, a threshold for the TSI Signal (above or below 0), and a crossover/crossunder of the CMO (Chande Momentum Oscillator) and the TSI signal line. Additionally, there are thresholds for DPO (Detrended Price Oscillator, above or below 0), Jurik Volatility Bands (above or below 0), and Stoch RSI (above or below 50). These three signals hold a lighter weight than the three TSI signals.
The macro score itself is printed in an underlay as a white line that goes between -10 and 10 for this strategy. In addition to the macro score line, a red momentum line (sourced by the macro score itself) has been included. A crossover/crossunder of the macro score and the macro momentum line is included into the long/short signal syntax in addition to a threshold for the macro score (-6/6).
Take profit, stop loss, and trailing percentages are also included, found at the bottom of the Input tab under “TT and TTP” as well as “Stop Loss”. Make sure to understand the TP/SL ratio that you desire before use, as the desired hit rate/profitability percentage will be affected accordingly. This strategy does NOT guarantee future returns. Apply caution in trading regardless of discretionary or algorithmic. Understand the concepts of risk/reward and the intricacies of each strategy choice before utilizing them in your personal trading.
Profitview Settings:
If you wish to utilize Profitview’s automation system, find the included “Profitview Settings” under the Input tab of the strategy settings menu. If not, skip this section entirely as it can be left blank. Options will be “OPEN LONG TITLE”, “OPEN SHORT TITLE”, “CLOSE LONG TITLE”, and “CLOSE SHORT TITLE”. If you wished to trade SOL, for example, you would put “SOL LONG”, “SOL SHORT”, “SOL CLOSE LONG”, and “SOL CLOSE SHORT” in these areas. Within your Profitview extension, ensure that your Alerts all match these titles. To set an alert for use with Profitview, go to the “Alerts” tab in TradingView, then create an alert. Make sure that your desired asset and timeframe are currently displayed on your screen when creating the alert. Under the “Condition” option of the alert, select the strategy, then select the expiration time. If using TradingView Premium, this can be open-ended. Otherwise, select your desired expiration time and date. This can be updated whenever desired to ensure the strategy does not expire. Under “Alert actions”, nothing necessarily needs to be selected unless so desired. Leave the “Alert name” option empty. For the “Message”, delete the generated message and replace it with {{strategy.order.alert_message}} and nothing else.
Adaptive Fisherized CMOIntroduction
Heyo, here is another no-repaint adaptive fisherized indicator.
I added Inverse Fisher Transform, Ehlers dominant cycle analysis and smoothing to the Chande Momentum Oscillator (CMO).
Usage
The CMO is a momentum oscillator which shows the usual movement of an asset.
I recommend to use it from a lower timeframe with a higher timeframe set.
Signals
(Signal mode will come soon.)
Zero Line
CMO crosses above zero line => enter long
CMO cross below zero line => ente short
Overbought/Oversold
CMO crosses above bottom band => enter long
CMO crosses under top band => enter short
MA (Maybe this signals will vary. Then, check update notes.)
CMO crosses above MA => enter long
CMO crosses below MA => enter short
Enjoy and share your experience with it!
More to read: CMO Explanationsp

RSI+CMO Hybrid StrategyThis strategy is based on the RSI+CMO Hybrid Index I created. I modified both the original RSI and CMO so that the RSI+CMO Index value ranges from -100 to +100 and defined as follows. When the RSI+CMO Hybrid Index values close above the Bull Level and below the Bear Level, the strategy will trigger long and short signals respectively. This newly defined hybrid RSI+CMO indicator showed better win rates and better profits than the original CMO strategy. The default setting for this strategy is optimized for an 8-hour candle. For candles at different times, try to find the optimal value yourself.
* I was going to open the script, but recently there was a case of stealing my script and publishing it without permission, so I decided not to disclose it.
▶ Modified RSI = Original RSI - 50
Therefore,
Original RSI (0 ~ 100) → Modified RSI (-50 ~ +50)
▶ Modified CMO = Original CMO * 0.5
Therefore,
Original CMO (-100 ~ +100) → Modified CMO (-50 ~ +50)
▶ RSI+CMO Hybrid Index = Modified RSI + Modified CMO
Therefore,
RSI+CMO Hybrid Index (-100 ~ +100)
________________________________________________________
이 전략은 기존의 RSI와 CMO 지표를 수정하여 새롭게 정의한 하이브리드 RSI+CMO 지표를 기반으로 만들어졌습니다. 지표 값의 범위가 -100에서 100의 범위를 가질 수 있도록 기존의 RSI와 CMO를 수정하여 만들었습니다. RSI+CMO Hybrid Index 값이 Bull Level 이상과 Bear Level 아래에서 봉마감을 하면 이 전략은 각각 롱과 숏 신호를 트리거합니다. 이렇게 새롭게 정의된 RSI+CMO 지표는 기존 CMO 전략 대비 승률과 수익이 더 우수합니다. 이 전략의 세팅 기본값은 8시간봉에 최적화 되어있습니다. 다른 시간대 봉에서는 최적값을 직접 찾아보십시오. 그리고 이전략은 RSI+CMO Hybrid Index와 함께 사용하면 Long과 Short 신호를 예측할 수 있어 편리합니다.
* 최근에 제 스크립트를 도용/표절하여 무단으로 퍼블리쉬한 사례가 발생하여 더 이상 스크립트는 공개하지 않기로 하였습니다.

RSI+CMO Hybrid IndexThis indicator plots hybrid Relative Strength Index (RSI) and Chande Momentum Oscillator (CMO). The CMO was developed by Tushar Chande. A scientist, an inventor, and a respected trading system developer, Mr. Chande developed the CMO to capture what he calls "pure momentum". I modified the original RSI and CMO so that the RSI+CMO Index value ranges from -100 to +100 and defined as follows. This newly defined hybrid RSI+CMO indicator showed better win rates and better profits than the original CMO strategy.
* I was going to open the script, but recently there was a case of stealing my script and publishing it without permission, so I decided not to disclose it.
▶ Modified RSI = Original RSI - 50
Therefore,
Original RSI (0 ~ 100) → Modified RSI (-50 ~ +50)
▶ Modified CMO = Original CMO * 0.5
Therefore,
Original CMO (-100 ~ +100) → Modified CMO (-50 ~ +50)
▶ RSI+CMO Hybrid Index = Modified RSI + Modified CMO
Therefore,
RSI+CMO Hybrid Index (-100 ~ +100)
________________________________________________________
이 지표는 기존의 RSI와 CMO 지표를 수정하여 새롭게 정의한 하이브리드 RSI+CMO 지표입니다. 지표 값의 범위가 -100에서 100의 범위를 가질 수 있도록 기존의 RSI와 CMO를 수정하여 만들었습니다. 이렇게 새롭게 정의된 RSI+CMO 지표는 기존 CMO 전략 대비 승률과 수익이 더 우수합니다. 전략은 별도로 스크립트를 퍼블리쉬할 예정이고 이 지표와 함께 사용해야 Long, Short 신호를 봉마감전에 미리 예측하고 진입할 수 있어 편리합니다.
* 최근에 제 스크립트를 도용/표절하여 무단으로 퍼블리쉬한 사례가 발생하여 더 이상 스크립트는 공개하지 않기로 하였습니다.

Oscilator CandlesBased on the response received on Bollinger %B candles, thought it would be nice to get the same on oscillators.
Use cases include applying atr based indicators or any indicators which utilizes - high, low, open close on oscillator values. Example : supertrend
Note: length values are reused by different oscillator types based on input requirements.

Hybrid Overbought/Oversold Detector + Put/Call SignalsThere are many indicators of overbought/oversold conditions out there. Some of more common ones are:
- Bollinger Bands %B
- Money Flow Index (MFI)
- Relative Strength Index (RSI)
- Stochastic
This script uses a combination of these 4 oscillators to confirm overbought/oversold and filter the signals of market reverse which could be used for trading binary options.
You may select which oscillators you want to apply and of course change the source, the length of the calculations and the overbought/oversold levels.
Also the script will draw a combined graph which is the average of the selected oscillators in the options.
Send me your ideas!

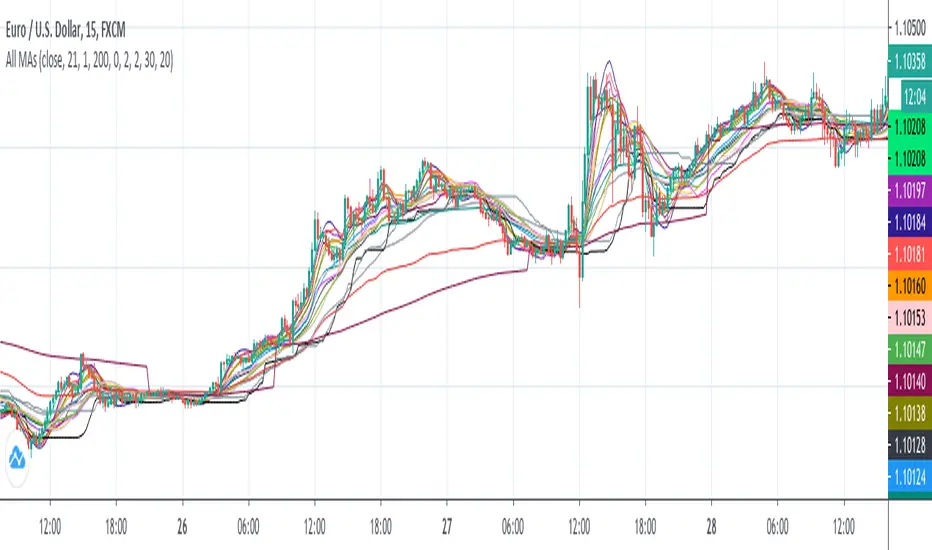
All MAs displayedThis is a collection of moving averages.
Thanks to everget and other pinecoders to pubblish their codes in tradingview.
I just collect a lot of moving averages in one script and transform them in stand alone functions, so you can copy and paste in your script the MA that best fit your needs.
Furthermore, the chart shows which moving average has more smooth and which one has less lag and so on: in this way it is easy to graphically compare moving averages.
Combo Backtest 123 Reversal & CMOaDisparity Index This is combo strategies for get a cumulative signal.
First strategy
This System was created from the Book "How I Tripled My Money In The
Futures Market" by Ulf Jensen, Page 183. This is reverse type of strategies.
The strategy buys at market, if close price is higher than the previous close
during 2 days and the meaning of 9-days Stochastic Slow Oscillator is lower than 50.
The strategy sells at market, if close price is lower than the previous close price
during 2 days and the meaning of 9-days Stochastic Fast Oscillator is higher than 50.
Second strategy
The related CMOaDisparity Index article is copyrighted material from Stocks & Commodities Dec 2009
My strategy modification.
WARNING:
- For purpose educate only
- This script to change bars colors.
