Trend Flow & Breakout Professional [Strategy]Description:
🌪️ Overview
Stop guessing. Start following the flow.
The Trend Flow & Breakout Professional is a high-precision visual trading system designed to solve the biggest problem traders face: Choppy Markets & Fakeouts.
Instead of relying on lagging indicators that generate false signals, this engine uses a proprietary "Momentum Alignment Algorithm" to identify when price action is entering a genuine expansion phase. It transforms complex trend data into a clean, easy-to-read visual roadmap, allowing you to catch the meat of the move while filtering out the noise.
🔮 Key Features
1. The "Traffic Light" Visual System Trading is 90% psychology. This script reduces mental fatigue by coloring the chart background to reflect the dominant market state:
🟢 Green Zone (Bullish Flow): Momentum is accelerating upwards. The system suggests holding long positions and ignoring minor pullbacks.
🔴 Red Zone (Bearish Flow): Structure has broken down. The system suggests defensive measures or short entries.
Note: The background remains active as long as the trend structure holds, preventing you from exiting trades too early.
2. Smart Noise Filtering Unlike standard crossover strategies that get destroyed in sideways ranges, this system includes a Multi-Layer Trend Filter. It only triggers a signal when:
Short-term momentum aligns perfectly with the medium-term direction.
Volatility expands significantly (breakout confirmation).
Price successfully clears key long-term structural resistance (The "Blue Sky" Zone).
3. Built-in "Smart Strategy" Backtester We have integrated a professional-grade position management module. You can customize how the strategy executes trades in the settings:
Mode A: Sniper (Trend Reversal): Enters heavily on the first confirmed breakout and holds until the trend reverses. Ideal for swing traders.
Mode B: Builder (Pyramiding): Adds to the position incrementally as the trend confirms its strength, maximizing profit during strong runs.
4. Cooldown Mechanism To prevent over-trading, the algorithm includes a smart "Cooldown Period" that prevents signal spamming during high-volatility consolidations.
⚙️ How to Trade This System
Wait for the Signal:
Look for the "Buy" / "Sell" labels accompanied by a bright Neon Candle.
Ensure the background color shifts (e.g., from Grey/Red to Green).
Ride the Zone:
Do not exit just because of one red candle. As long as the Background remains Green, the trend is healthy.
The background color acts as your "psychological anchor," helping you let profits run.
Exit / Reversal:
A complete background color flip (e.g., Green to Red) indicates a structural trend failure. This is your signal to close positions or flip directions.
⚠️ Disclaimer
This tool is for educational and technical analysis purposes only. Past performance does not guarantee future results. Always use proper risk management.
รูปแบบชาร์ต

N1E_UTBOATN1E_UTBOAT
ATR trailing stop
Optional Heikin Ashi source
Buy/Sell signals based on a crossover of price vs ATR trailing stop
Strategy long/short entries

Session Breakout StrategyThis is simple Session Breakout Strategy with Toggles provided to enable different Sessions based on the requirement..
ADX and Volume Filters provided to cut down the Whipsaws..
For BTC in 5 mins works good with the default setting.
For Gold Change ATR TP - 2.5 and ATR SL -1.5 in 5m TF.

Fibonacci Vision ProFibonacci Precision Signals Pro | Smart Buy & Sell Alerts
━━━━━━━━━━━━━━━━━━━━━━━━━━━━━━━━━━━━━━━━━━━━━━━━━━━━
OVERVIEW
This indicator combines Fibonacci mathematics with advanced signal filtering to deliver precise buy and sell signals. It automatically detects swing structure, calculates the key 0.618 retracement level, and generates signals only when multiple confirmation factors align.
Clean. Accurate. Professional.
━━━━━━━━━━━━━━━━━━━━━━━━━━━━━━━━━━━━━━━━━━━━━━━━━━━━
HOW IT WORKS
The script identifies swing highs and lows, then calculates Fibonacci retracement levels automatically. When price interacts with the 0.618 zone and all filters confirm, a signal appears:
▲ buy — Long entry opportunity
▼ sell — Short entry opportunity
━━━━━━━━━━━━━━━━━━━━━━━━━━━━━━━━━━━━━━━━━━━━━━━━━━━━
6-LAYER CONFIRMATION SYSTEM
Every signal must pass through:
Trend Direction Analysis
Fibonacci Level Interaction
EMA Trend Filter (50-period default)
RSI Momentum Validation (14-period default)
Volume Spike Detection
Candlestick Pattern Recognition (Pin bars, Engulfing, Momentum candles)
This multi-layer approach significantly reduces false signals.
━━━━━━━━━━━━━━━━━━━━━━━━━━━━━━━━━━━━━━━━━━━━━━━━━━━━
BUILT-IN RISK MANAGEMENT
Every trade includes automatic stop loss and take profit levels:
Stop Loss: 100 pips
Take Profit: 200 pips
Risk-Reward Ratio: 1:2
Adjust these values in settings to match your trading style.
━━━━━━━━━━━━━━━━━━━━━━━━━━━━━━━━━━━━━━━━━━━━━━━━━━━━
KEY FEATURES
✅ Automatic Fibonacci calculation — no manual drawing
✅ Multi-timeframe compatibility — M15 to Daily
✅ Universal market support — Forex, Crypto, Stocks, Indices
✅ Clean minimalist signals — white triangles with text
✅ Customizable filters — adjust sensitivity to your preference
✅ Built-in alerts — never miss a signal
✅ No repainting — signals remain fixed once confirmed
━━━━━━━━━━━━━━━━━━━━━━━━━━━━━━━━━━━━━━━━━━━━━━━━━━━━
Swing Detection:
Swing Length — Controls sensitivity to market structure (default: 10)
Confirmation Bars — Bars required to confirm signal (default: 1)
Signal Filters:
EMA Trend Filter — Toggle trend confirmation on/off
EMA Length — Adjust trend filter period (default: 50)
RSI Filter — Toggle momentum confirmation on/off
RSI Length — Adjust momentum period (default: 14)
Volume Filter — Toggle volume confirmation on/off
Volume Multiplier — Set volume threshold (default: 1.2x average)
Risk Management:
Stop Loss Pips — Set your stop loss distance (default: 100)
Take Profit Pips — Set your profit target (default: 200)
Pip Value — Adjust for your instrument (0.0001 for most Forex, 0.01 for JPY pairs)
Visuals:
Show Signals — Toggle signal visibility
Show Cloud — Toggle Fibonacci zone visibility
━━━━━━━━━━━━━━━━━━━━━━━━━━━━━━━━━━━━━━━━━━━━━━━━━━━━
BEST PRACTICES
Use on H1 or H4 timeframes for optimal results
Trade in direction of the higher timeframe trend
Avoid trading during major news events
Combine with proper position sizing
Always use the built-in stop loss
Be patient — quality signals over quantity
━━━━━━━━━━━━━━━━━━━━━━━━━━━━━━━━━━━━━━━━━━━━━━━━━━━━
MARKETS SUPPORTED
Forex — All major, minor, and exotic pairs
Crypto — BTC, ETH, and altcoins
Stocks — Any equity on TradingView
Indices — S&P500, NASDAQ, DAX, FTSE, etc.
Commodities — Gold, Silver, Oil, etc.
━━━━━━━━━━━━━━━━━━━━━━━━━━━━━━━━━━━━━━━━━━━━━━━━━━━━
WHY FIBONACCI?
The 0.618 ratio (Golden Ratio) is observed by traders worldwide. When price retraces to this level, it often:
Reverses direction
Finds support or resistance
Creates high-probability entry opportunities
This script automates the detection of these key moments.
━━━━━━━━━━━━━━━━━━━━━━━━━━━━━━━━━━━━━━━━━━━━━━━━━━━━
ALERTS INCLUDED
Set up notifications to receive signals on:
Mobile push notifications
Desktop popups
Email alerts
Webhook integrations
Never miss a trading opportunity again.
━━━━━━━━━━━━━━━━━━━━━━━━━━━━━━━━━━━━━━━━━━━━━━━━━━━━
WHAT MAKES THIS DIFFERENT
Most indicators give too many signals. This one focuses on quality.
Most indicators clutter your chart. This one keeps it clean.
Most indicators ignore risk management. This one includes it.
Most indicators work on one market. This one works on all.
━━━━━━━━━━━━━━━━━━━━━━━━━━━━━━━━━━━━━━━━━━━━━━━━━━━━
DISCLAIMER
This indicator is a trading tool, not financial advice. Trading involves substantial risk of loss. Past performance does not guarantee future results. Always use proper risk management and never trade with money you cannot afford to lose. Test on a demo account before trading live.

Tariq Supertrend StrategyThis Strategy which points out the best time to enter in Long Trade or Short Trade

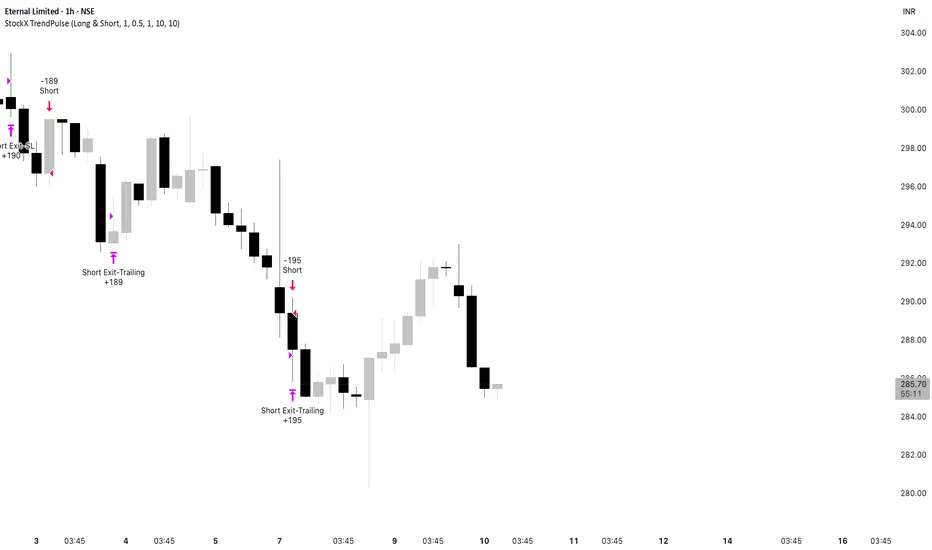
StockX TrendPulseThis is one of our premium, high-grade trading scripts built specifically for highly liquid stocks. It’s a fully automated system designed to deliver consistent performance, adapt to changing market conditions, and maintain strict risk control. With enhanced trade management and built-in performance tracking, it provides a reliable, disciplined framework for stock traders who demand precision and robustness.
StockX TrendPulse removes emotion from trading decisions and provides complete transparency through detailed performance metrics. The strategy is fully backtested and ready for live deployment.
Ready to Trade Like a Pro?
StockX TrendPulse is a premium strategy with limited availability.
Email brijamohanjha@gmail.com
to request access and pricing.
VWolf – Slope GuardOVERVIEW
Slope Guard combines a momentum core (WaveTrend + RSI/MFI + QQE family) with a directional bias (EMA/DEMA and a DEMA-slope filter). Trade direction can be constrained by the Supertrend regime (Normal or Pivot). Risk is managed with ATR-based stops and targets, optional Supertrend-anchored dynamic levels, and a two-stage take-profit that can shift the stop to break-even after the first partial. The strategy supports explicit Backtest and Forward-test windows and adapts certain thresholds by market type (Forex vs. Stocks).
RECOMMENDED USE
Markets: Forex and equities; use Market Type to properly scale the DEMA-slope gate.
Timeframes: M15–H4 for intraday-swing and H1–D1 for slower swing; avoid ultra-low TFs without tightening ADX/QQE.
Assets: Instruments with persistent trends and orderly pullbacks; avoid flat ranges without sufficient ADX.
Strengths
Multi-layer confluence: trend bias + momentum + regime + strength.
Flexible risk engine: ATR vs. Supertrend anchoring, staged exits, and automatic break-even.
Clean research workflow: separated Backtest and Forward-test windows.
Precautions
Structural latency: Pivot-based constructs confirm with delay; validate with Forward-test.
Filter interaction: QQE Strict + ADX + WT zero-line can become overly selective; calibrate by asset/TF.
Overfitting risk: Prefer simple, portable parameter sets and validate across symbols/TFs.
CONCLUSION
Slope Guard is a “trend + momentum” framework with risk control at its core. By enforcing a baseline bias, validating momentum with the Vuman composite, and offering ATR or Supertrend-anchored exits—plus staged profits and break-even shifts—it seeks to capture the core of directional swings while compressing drawdowns. Keep testing windows isolated, start with moderate filters (QQE Normal, ADX ~20–25), and only add stricter gates (WT zero-line, DEMA slope) once they demonstrably improve stability without starving signals.
FOR MORE INFORMATION VISIT vwolftrading.com

VWolf - Shadow PulseOVERVIEW
The Trend Momentum Breakout Strategy is a rule-based trading system designed to identify high-probability entries in trending markets using a combination of trend confirmation, momentum filtering, and precise trigger conditions. The strategy is suitable for intermediate to advanced traders who prefer mechanical systems with clear entry/exit logic and configurable risk management options.
At its core, this strategy seeks to enter pullbacks within strong trends, capitalizing on momentum continuation after brief pauses in price movement. By integrating multiple moving averages (MAs) for trend validation, ADX (Average Directional Index) as a strength filter, and Stochastic RSI as an entry trigger, the strategy filters out weak trends and avoids overextended market conditions. Exit logic is based on a customizable fixed stop-loss (SL) and take-profit (TP) framework, with optional dynamic risk-reduction mechanisms powered by the Supertrend indicator.
This strategy is designed to perform best in clearly trending markets and is especially effective in avoiding false breakouts or choppy sideways action thanks to its ADX-based filtering. It can be deployed across a variety of asset classes, including forex, stocks, cryptocurrencies, and indices, and is optimized for intra-day to swing trading timeframes.
RECOMMENDED USE
This strategy is designed to be flexible across multiple markets, but it performs best under certain conditions:
Best Suited For:
Trending markets with clear directional momentum.
High-volume instruments that avoid erratic price action.
Assets with intraday volatility and swing patterns.
Recommended Asset Classes:
Forex pairs (e.g., EUR/USD, GBP/JPY)
Cryptocurrencies (e.g., BTC/USD, ETH/USDT)
Major indices (e.g., S&P 500, NASDAQ, DAX)
Large-cap stocks (especially those with consistent liquidity)
Suggested Timeframes:
15-minute to 1-hour charts for intraday setups.
4-hour and daily charts for swing trading.
Lower timeframes (1–5 min) may generate too much noise unless fine-tuned.
Market Conditions to Avoid:
Ranging or sideways markets with low ADX values.
Assets with irregular price structures or low liquidity.
News-heavy periods with unpredictable price spikes.
CONCLUSION
This strategy stands out for its robust and modular approach to trend-following trading, offering a high level of customization while maintaining clear logic and structural discipline in entries and exits. By combining three distinct layers of confirmation—trend identification (via configurable moving averages), trend strength validation (via the DMI filter), and timing (via the Stochastic RSI trigger)—it aims to reduce noise and increase the probability of entering trades with directional bias and momentum on its side.
Its flexibility is one of its strongest points: users can tailor the strategy to fit various trading styles and market conditions. Whether the trader prefers conservative setups using only the slowest moving average, or more aggressive entries requiring full alignment of fast, medium, and slow MAs, the system adjusts accordingly. Likewise, exit management offers both static and dynamic methods—such as ATR-based stop losses, Supertrend-based adaptive exits, and partial profit-taking mechanisms—allowing risk to be managed with precision.
This makes the strategy particularly suitable for trend-driven markets, such as major currency pairs, indices, or volatile stocks that demonstrate clear directional moves. It is not ideal for sideways or choppy markets, where multiple filters may reduce the number of trades or result in whipsaws.
From a practical standpoint, the strategy also incorporates real-world trading mechanics, like time-based filters and account risk control, which elevate it from a purely theoretical model to a more execution-ready system.
In summary, this is a well-structured, modular trend strategy ideal for intermediate to advanced traders who want to maintain control over their system parameters while still benefiting from layered signal confirmation. With proper calibration, it has the potential to become a reliable tool in any trader’s arsenal—particularly in markets where trends emerge clearly and sustainably.
FOR MORE INFORMATION VISIT vwolftrading.com

VWolf - Raptor ClawOVERVIEW
The 'VWolf - Raptor Claw' is a straightforward scalping strategy designed for high-frequency trades based on the Stochastic RSI indicator. It focuses exclusively on identifying potential trend reversals through stochastic cross signals in extreme zones, without the need for additional confirmations. This makes it highly responsive to market movements, capturing rapid price shifts while maintaining simplicity.
This strategy is best suited for highly liquid and volatile markets like forex, indices, and major cryptocurrencies, where quick momentum shifts are common. It is ideal for experienced scalpers who prioritize fast entries and exits, but it can also be adapted for swing trading in lower timeframes.
Entry Conditions:
Long Entry:Stochastic RSI crosses above the oversold threshold (typically 20), indicating a potential bullish reversal.
Short Entry:Stochastic RSI crosses below the overbought threshold (typically 80), indicating a potential bearish reversal.
Exit Conditions:
Stop Loss: Set at the minimum (for longs) or maximum (for shorts) within a configurable lookback window to reduce risk.
Take Profit: Defined by a risk-reward ratio (RRR) input to optimize potential gains relative to risk.
CONCLUSION
The 'VWolf - Raptor Claw' strategy is perfect for traders seeking a simple yet aggressive approach to the markets. It capitalizes on sharp momentum shifts in extreme zones, relying on precise stop loss and take profit settings to capture rapid profits while minimizing risk. This approach is highly effective in high-volatility environments where quick decision-making is essential.
FOR MORE INFORMATION VISIT vwolftrading.com

VWolf - Quantum DriftOVERVIEW
The Quantum Drift strategy is a sophisticated, highly customizable trading approach designed to identify market entries and exits by leveraging multiple technical indicators. The strategy uniquely combines the Dynamic Exponential Moving Average (DEMA), QQE indicators, Volume Oscillator, and Hull Moving Average (HULL), enabling precise detection of trend direction, momentum shifts, and volatility adjustments. It stands out due to its adaptability across different market conditions by allowing significant user customization through various input parameters.
RECOMMENDED USE
Markets: Ideal for Forex and Stocks due to the strategy's volatility-sensitive and trend-following nature.
Timeframes: Best suited for medium to higher timeframes (15m, 1H, 4H), where clearer trend signals and less noise occur, enhancing strategy reliability.
CONCLUSION
The Quantum Drift strategy is tailored for intermediate to advanced traders seeking a versatile and adaptive system. Its strength lies in combining momentum, volatility, and trend-following components, providing robust entry and exit signals. However, its effectiveness relies significantly on accurate parameter tuning by traders familiar with the underlying indicators and market behavior.
FOR MORE INFORMATION VISIT vwolftrading.com

VWolf – Pivot VumanSkewOVERVIEW
This strategy blends a lightweight trend scaffold (EMA/DEMA) with a skew-of-volatility filter and VuManchu/WaveTrend momentum signals. It’s designed to participate only when trending structure, momentum alignment, and volatility asymmetry converge, while delegating execution management to either a standard SuperTrend or a Pivot-based SuperTrend. Position sizing is risk‑based, with optional two‑step profit taking and automatic stop movement once price confirms in favor.
RECOMMENDED USE
Markets: Designed for Forex and equities, and readily adaptable to indices or liquid futures.
Timeframes: Performs best from 15m to 4h where momentum and trend layers both matter; daily can be used for confirmation/context.
Conditions: Trending or range‑expansion phases with clear volatility asymmetry. Avoid extremely compressed sessions unless thresholds are relaxed.
Strengths
Multi‑layer confluence (trend + skew + momentum) reduces random signals.
Dual SuperTrend modes provide flexible trailing and regime control.
Built‑in hygiene (ADX/DMI, lockout after loss, ATR gap) curbs over‑trading.
Risk‑% sizing and two‑step exits support consistent, plan‑driven execution.
Precautions
Over‑tight thresholds can lead to missed opportunities; start from defaults and tune gradually.
High sensitivity in momentum settings may overfit to a single instrument/timeframe.
In very low volatility, ATR‑gap or skew filters may block entries—consider adaptive thresholds.
CONCLUSION
VWolf – Pivot VumanSkew is a disciplined trend‑participation strategy that waits for directional structure, volatility asymmetry, and synchronized momentum before acting. Its execution layer—selectable between Normal and Pivot SuperTrend—keeps management pragmatic: scale out early when appropriate, trail intelligently, and defend capital with volatility‑aware stops. For users building a diversified playbook, Pivot VumanSkew serves as a trend‑continuation workhorse that can be tightened for precision or relaxed for higher participation depending on the market’s rhythm.

VWolf – Momentum TwinOVERVIEW
VWolf – Momentum Twin is designed to identify high-probability momentum reversals emerging from overbought or oversold market conditions. It employs a double confirmation from the Stochastic RSI oscillator, optionally filtered by trend and directional movement conditions, before executing trades.
The strategy emphasizes consistent risk management by scaling stop-loss and take-profit targets according to market volatility (ATR), and it provides advanced position management features such as partial profit-taking and automated stop-loss adjustments.
RECOMMENDED USE
Markets: Major FX pairs, index futures, large-cap stocks, and top-volume cryptocurrencies.
Timeframes: Best suited for M15–H4; adaptable for swing trading on daily charts.
Trader Profile: Traders who value structured, volatility-adjusted momentum reversal setups.
Strengths:
Double confirmation filters out many false signals.
Multiple filter options allow strategic flexibility.
ATR scaling maintains consistent risk across assets.
Trade management tools improve adaptability in dynamic markets.
Precautions:
May produce fewer trades in strong one-direction trends.
Over-filtering can reduce trade frequency.
Requires validation across instruments and timeframes before deployment.
CONCLUSION
The VWolf – Momentum Twin offers a disciplined framework for capturing momentum reversals while preserving flexibility through its customizable filters and risk controls. Its double confirmation logic filters out a significant portion of false reversals, while ATR-based scaling ensures consistency across varying market conditions. The optional trade management features, including partial profit-taking and automatic stop adjustments, allow the strategy to adapt to both trending and ranging environments. This makes it a versatile tool for traders who value structured entries, robust risk control, and adaptable management in a variety of markets and timeframes.

VWolf – Hull VectorOVERVIEW
VWolf – Hull Vector is a momentum-driven trend strategy centered on the Hull Moving Average (HMA) angle. It layers optional confirmations from EMA/DEMA alignment, DMI/ADX strength, and Supertrend triggers to filter lower-quality entries and improve trade quality.
Risk is controlled through capital-based position sizing, ATR-anchored stops and targets, and dynamic trade management (partial exits and stop movement). The strategy supports Backtest and Forwardtest modes with configurable date ranges, and a market profile toggle (Forex vs. Stocks) to adjust internal scaling for price behavior.
RECOMMENDED USE
Markets: Major Forex pairs, index CFDs/futures, and liquid stocks with clean trend legs.
Styles: Intraday and swing applications where momentum continuation is common.
Volatility Regimes: Performs best in trending or expanding-volatility environments; consider tightening thresholds in choppy phases.
Workflow Tips:Start with HMA angle + ST trigger only; then layer DEMA and DMI/ADX if you need more selectivity.
Use Forwardtest dates to simulate out-of-sample performance after tuning Backtest parameters.
Re-evaluate angle thresholds when switching between Forex and Stocks modes.
Strengths
Clear momentum core (HMA angle) with optional, orthogonal filters (trend alignment, strength, trigger).
Robust risk tooling: ATR/ST stops, two-step profits, and capital-based sizing.
Testing discipline: Native Backtest/Forwardtest scoping supports walk-forward validation.
Broad portability: Works across instruments thanks to market-aware scaling.
Precautions
Over-filtering risk: Enabling all gates simultaneously may under-trade; calibrate selectivity to your timeframe.
Sideways markets: Expect more whipsaws when slope hovers near zero; raise angle threshold or rely more on ADX gating.
Overfitting hazard: Tune on one regime, then verify with Forwardtest windows and alternative markets/timeframes.

VWolf – Hulk StrikeOVERVIEW
VWolf – Hullk Strike is a dynamic trend-following strategy designed to capture pullbacks within established moves. It combines a configurable Moving Average (HULL, EMA, SMA, or DEMA) trend filter with DMI/ADX confirmation and a Stochastic RSI timing trigger. Risk is managed through ATR- or Supertrend-based stops, optional partial profit-taking, and automatic stop adjustments. The strategy aims to rejoin momentum after controlled retracements while maintaining consistent, quantified risk
RECOMMENDED USE
Markets: Liquid indices, major FX pairs, large-cap equities, high-liquidity crypto pairs.
Timeframes: M15 to D1 (stricter filters for lower timeframes, looser for higher).
Profiles: Traders seeking structured trend participation with systematic timing.
Strengths
Highly flexible trend engine adaptable to multiple markets.
Dual confirmation reduces false signals during pullbacks.
Risk-first design with multiple stop models and partial exits.
Precautions
Over-filtering may reduce trade frequency and miss fast continuations.
Under-filtering may increase whipsaw risk in choppy markets.
Backtest vs forward-test differences if date/session filters are inconsistent.
CONCLUSION
VWolf – Hullk Strike is designed to capture the “second leg” of a trend after a controlled retracement. With configurable MA strictness, DMI/ADX strength filters, and precise Stoch RSI timing, it enhances selectivity while keeping responsiveness. Its stop/target framework—anchored stops, proportional targets, partial exits, and dynamic stop moves—offers disciplined risk control and upside preservation.
FOR MORE INFORMATION VISIT vwolftrading.com

VWolf - Basic EdgeOVERVIEW
VWolf - Basic Edge is a clean and accessible crossover strategy built on the core principle of moving average convergence. Designed for simplicity and ease of use, it allows traders to select from multiple types of moving averages—including EMA, SMA, HULL, and DEMA—and defines entry points strictly based on the crossover of two user-defined MAs.
This strategy is ideal for traders seeking a minimal, no-frills trend-following system with flexible exit conditions. Upon crossover in the selected direction (e.g., fast MA crossing above slow MA for a long entry), the strategy opens a trade and then manages the exit based on the user’s chosen method:
Signal-Based Exit:Trades are closed on the opposite crossover signal (e.g., long is exited when the fast MA crosses below the slow MA).
Fixed SL/TP Exit:The trade is closed based on fixed Stop Loss and Take Profit levels.Both SL and TP values are customizable via the strategy’s input settings.Once either the TP or SL is reached, the position is exited.
Additional filters such as date ranges and session times are available for backtesting control, but no extra indicators are used—staying true to the “basic edge” philosophy. This strategy works well as a starting framework for beginners or as a reliable, lightweight system for experienced traders wanting clean, rule-based entries and exits.
RECOMMENDED FOR
- Beginner to intermediate traders who want a transparent and easy-to-follow system.
- Traders looking to understand or build upon classic moving average crossover logic.
- Users who want a customizable but uncluttered strategy framework.
🌍 Markets & Instruments:
Well-suited for liquid and trending markets, including:Major forex pairs
Stock indices
Commodities (e.g., gold, oil)
Cryptocurrencies with stable trends (e.g., BTC, ETH)
⏱ Recommended Timeframes:
Performs best on higher intraday or swing trading timeframes, such as:15m, 1h, 4h, and 1D
Avoid low-timeframe noise (e.g., 1m, 3m) unless paired with strict filters or volatility controls.
FOR MORE INFORMATION VISIT vwolftrading.com

Reversal WaveThis is the type of quantitative system that can get you hated on investment forums, now that the Random Walk Theory is back in fashion. The strategy has simple price action rules, zero over-optimization, and is validated by a historical record of nearly a century on both Gold and the S&P 500 index.
Recommended Markets
SPX (Weekly, Monthly)
SPY (Monthly)
Tesla (Weekly)
XAUUSD (Weekly, Monthly)
NVDA (Weekly, Monthly)
Meta (Weekly, Monthly)
GOOG (Weekly, Monthly)
MSFT (Weekly, Monthly)
AAPL (Weekly, Monthly)
System Rules and Parameters
Total capital: $10,000
We will use 10% of the total capital per trade
Commissions will be 0.1% per trade
Condition 1: Previous Bearish Candle (isPrevBearish) (the closing price was lower than the opening price).
Condition 2: Midpoint of the Body The script calculates the exact midpoint of the body of that previous bearish candle.
• Formula: (Previous Open + Previous Close) / 2.
Condition 3: 50% Recovery (longCondition) The current candle must be bullish (green) and, most importantly, its closing price must be above the midpoint calculated in the previous step.
Once these parameters are met, the system executes a long entry and calculates the exit parameters:
Stop Loss (SL): Placed at the low of the candle that generated the entry signal.
Take Profit (TP): Calculated by projecting the risk distance upward.
• Calculation: Entry Price + (Risk * 1).
Risk:Reward Ratio of 1:1.
About the Profit Factor
In my experience, TradingView calculates profits and losses based on the percentage of movement, which can cause returns to not match expectations. This doesn’t significantly affect trending systems, but it can impact systems with a high win rate and a well-defined risk-reward ratio. It only takes one large entry candle that triggers the SL to translate into a major drop in performance.
For example, you might see a system with a 60% win rate and a 1:1 risk-reward ratio generating losses, even though commissions are under control relative to the number of trades.
My recommendation is to manually calculate the performance of systems with a well-defined risk-reward ratio, assuming you will trade using a fixed amount per trade and limit losses to a fixed percentage.
Remember that, even if candles are larger or smaller in size, we can maintain a fixed loss percentage by using leverage (in cases of low volatility) or reducing the capital at risk (when volatility is high).
Implementing leverage or capital reduction based on volatility is something I haven’t been able to incorporate into the code, but it would undoubtedly improve the system’s performance dramatically, as it would fix a consistent loss percentage per trade, preventing losses from fluctuating with volatility swings.
For example, we can maintain a fixed loss percentage when volatility is low by using the following formula:
Leverage = % of SL you’re willing to risk / % volatility from entry point to exit or SL
And if volatility is high and exceeds the fixed percentage we want to expose per trade (if SL is hit), we could reduce the position size.
For example, imagine we only want to risk 15% per SL on Tesla, where volatility is high and would cause a 23.57% loss. In this case, we subtract 23.57% from 15% (the loss percentage we’re willing to accept per trade), then subtract the result from our usual position size.
23.57% - 15% = 8.57%
Suppose I use $200 per trade.
To calculate 8.57% of $200, simply multiply 200 by 8.57/100. This simple calculation shows that 8.57% equals about $17.14 of the $200. Then subtract that value from $200:
$200 - $17.14 = $182.86
In summary, if we reduced the position size to $182.86 (from the usual $200, where we’re willing to lose 15%), no matter whether Tesla moves up or down 23.57%, we would still only gain or lose 15% of the $200, thus respecting our risk management.
Final Notes
The code is extremely simple, and every step of its development is detailed within it.
If you liked this strategy, which complements very well with others I’ve already published, stay tuned. Best regards.

Market Solver Pro [Eˣ]Market Solver Pro is a multi-layer trend-and-structure based strategy designed to help traders study how price behaves around higher-timeframe support, resistance, and momentum shifts. It combines three core concepts into a single framework:
1. Multi-Timeframe Structure Zones (Support/Resistance Gradient)
The script identifies swing-based higher-timeframe pivot highs (PH) and pivot lows (PL).
These levels form dynamic zones where price frequently reacts. A gradient is displayed between the PH and PL to help traders visually understand where price sits within the broader structure.
This zone system is built using:
A structure timeframe (W/D/60 depending on chart TF)
Multi-step pivot validation
Real-time plot adjustments for consistency
The purpose of this component is to highlight context—whether the market is pressing into resistance, approaching support, or moving through the middle of the structure range.
2. Adaptive Ichimoku-Based Trend Model (Three-Layer Confirmation)
The strategy uses an expanded Ichimoku-style calculation applied across three timeframe multipliers.
Each layer evaluates:
Tenkan-sen slope
Kijun-sen slope
Cloud alignment
Momentum confirmation relative to recent highs/lows
Based on the user’s Risk Appetite (Low/Moderate/High), the strategy selects which layer to prioritize:
Low → Long-term trend consistency
Moderate → Mid-term sensitivity
High → Short-term responsiveness
The result is a trend-state signal (Up or Down) derived from structural and directional agreement across multiple layers.
3. Market Structure Filter (Directional Bias Control)
A price-action-based structure engine classifies swing highs/lows into:
HH (Higher High)
LH (Lower High)
HL (Higher Low)
LL (Lower Low)
The Market Structure Filter uses this information to determine whether higher-timeframe price action supports trend continuation or is compressing into a squeeze condition.
Filters include:
None
Standard
Strict
This prevents trades from triggering during conflicting structural environments unless intentionally allowed.
4. Entry Logic (Long / Short Conditions)
A signal appears only when all active components agree:
Valid chart timeframe
Date-range filter permitting backtest inclusion
HTF structure filter aligned
Trend-state confirmation
Price breaking beyond the current structure zone
Exclusion of opposite pin-bar signatures
When these conditions align, the strategy issues a long or short entry.
5. Stop-Loss Engine (S1/R1 Dynamic Management)
Stop-loss placement is derived from the pivot-timeframe’s S1/R1 levels and the bar of entry.
Two modes are available:
Standard trail: Stop updates with improving S1/R1 levels
2R → Break-Even: Moves stop to break-even on a 2R move, then trails using the stricter of BE or S1/R1
This helps users study how momentum-based trailing behaviour affects risk exposure under different market conditions.
6. Performance Table (Optional Display)
The script can display a performance summary including:
Win/Loss count
Profit factor
Average win/loss
Compounded result
Largest win/loss
Current risk percentage
These statistics reflect the parameters chosen inside the script and can assist in evaluating how different configurations behave when backtesting historical data.
They are not predictive and do not imply future results.
7. Auto vs Manual Settings
Auto Mode: Automatically selects trend multipliers, structure timeframe, and risk mode according to the chart’s timeframe.
Manual Mode: Gives users full control over all parameters and is used by alert conditions.
This allows flexible experimentation across intraday and swing environments.
8. Intended Use
This strategy is designed for educational and analytical purposes—specifically to help traders explore how multi-timeframe trend alignment, market structure, and dynamic support/resistance interact.
It does not guarantee performance and should be used alongside independent analysis, risk management, and market awareness.

🔥 Ribas Waves Strategy PRO++📝 Strategy Description: Ribas Waves Strategy PRO++
The Ribas Waves Strategy PRO++ is a powerful trading system based on the identification of Wolfe Waves patterns, designed to capture high-probability reversal points with precise entries and smart risk management.
This advanced version is fully customizable, allowing traders to adapt entry confirmations, trend filters, and risk/reward ratios to their preferred trading style and market conditions.
⚙️ Key Features:
✅ Automatic detection of both Bullish and Bearish Wolfe Wave patterns
✅ Entry confirmation options:
No confirmation (pure Wolfe pattern)
Directional candle (bullish or bearish close)
Engulfing candle (bullish/bearish)
Inside bar + breakout
✅ Optional EMA trend filter
✅ Configurable take profit via:
Risk multiple (R-multiple: e.g., 3x risk)
Percentage of risk (e.g., 300% of stop-loss distance)
✅ Toggle to show or hide wave labels and structure on chart
✅ Entry cooldown to prevent overlapping trades
✅ Visual display of current strategy position: 📈 Long / 📉 Short / ⛔️ Flat
📌 How to Use:
Set pivot sensitivity based on the asset's volatility (default: 7)
Choose your preferred entry confirmation method
Enable or disable the EMA trend filter
Adjust your take profit logic (R-multiple or % of risk)
Run a backtest or use live alerts for execution
💡 Author Recommendations:
Best suited for volatile markets such as crypto, indices, and forex.
For more trades, disable confirmation filters or use “Directional Candle” mode.
Use higher timeframes or combine with volume/context filters for increased accuracy.
Regularly backtest different settings to optimize your edge on specific assets.

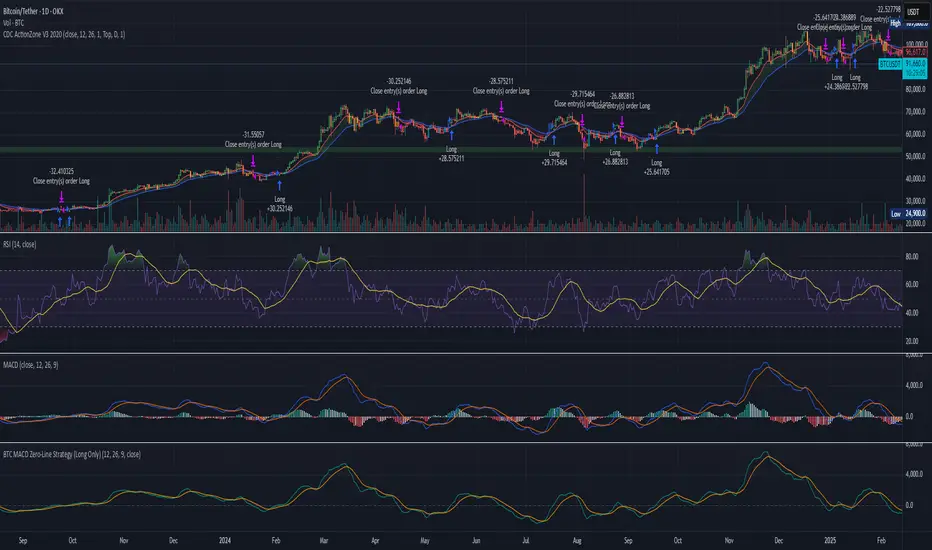
MACD Zero-Line Strategy (Long Only)Strategy to Open order when Mac-D Signal Cross up 0, Sell when it cross down 0
specific breakout FiFTOStrategy Description: 10:14 Breakout Only
Overview This is a time-based intraday trading strategy designed to capture momentum bursts that occur specifically after the 10:14 AM candle closes. It operates on the logic that if price breaks the high of this specific candle within a short window, a trend continuation is likely.
Core Logic & Rules
The Setup Candle (10:14 AM)
The strategy waits specifically for the minute candle at 10:14 to complete.
Once this candle closes, the strategy records its High price.
Defining the Entry Level
It calculates a trigger price by taking the 10:14 High and adding a user-defined Buffer (e.g., +1 point).
Formula: Entry Level = 10:14 High + Buffer
The "Active Window" (Expiry)
The trade setup does not remain open all day. It has a strict time limit.
By default, the setup is valid from 10:15 to 10:20.
If the price does not break the Entry Level by the expiry time (default 10:20), the setup is cancelled and no trade is taken for the day.
Entry Trigger
If a candle closes above the Entry Level while the window is open, a Long (Buy) position is opened immediately.
Exits (Risk Management)
Stop Loss: A fixed number of points below the entry price.
Target: A fixed number of points above the entry price.
Visual & Automation Features
Visual Boxes: Upon entry, the strategy draws a "Long Position" style visual on the chart. A green box highlights the profit zone, and a red box highlights the loss zone. These boxes extend automatically until the trade closes.
JSON Alerts: The strategy is pre-configured to send data-rich alerts for automation (e.g., Telegram bots).
Entry Alert: Includes Symbol, Entry Price, SL, and TP.
Exit Alerts: Specific messages for "Target Hit" or "SL Hit".
Summary of User Inputs
Entry Buffer: Extra points added to the high to filter false breaks.
Fixed Stop Loss: Risk per trade in points.
Fixed Target: Reward per trade in points.
Expiry Minute: The minute (10:xx) at which the setup becomes invalid if not triggered.

KNNstrategyKNN is an advanced gold-trading strategy built on a set of refined, confidential patterns extracted from thousands of recurring price behaviors. It identifies hidden reversal and breakout zones using a unique candle-movement signature optimized for fast timeframes. The strategy filters market noise and reveals high-precision entry points overlooked by traditional methods. KNN delivers a powerful edge in the highly volatile gold market through unmatched pattern accuracy and smart validation logic.

EdgeX by YCGH Capital╔════════════════════════════════════════════════════════════╗
⚡ SYSTEMATIC BTCUSDT SWING TRADER ⚡
╚════════════════════════════════════════════════════════════╝
━━━━━━━━━━━━━━━━━━━━━━━━━━━━━━━━━━━━━━━━━━━━━━━━━━━━━━━━━━
📊 STRATEGY OVERVIEW
╔════════════════════════════════════════════════════════════╗
║ 🔐 PREMIUM STRATEGY - EXCLUSIVE ACCESS 🔐 ║
╚════════════════════════════════════════════════════════════╝
This is a premium strategy with exclusive access.
To request access, reach out at:
📬 brijamohanjha@gmail.com
• Vetted performance data available upon request
• Setup assistance and strategy tuning included
• Ongoing support for live trading optimization
━━━━━━━━━━━━━━━━━━━━━━━━━━━━━━━━━━━━━━━━━━━━━━━━━━━━━━━━━━
A dynamic, rule-based trading framework designed for BTCUSDT on
the 4-hour chart, focused on capturing clear directional edges
with disciplined risk management and fully automated execution.
━━━━━━━━━━━━━━━━━━━━━━━━━━━━━━━━━━━━━━━━━━━━━━━━━━━━━━━━━━
🎯 KEY CHARACTERISTICS
━━━━━━━━━━━━━━━━━━━━━━━━━━━━━━━━━━━━━━━━━━━━━━━━━━━━━━━━━━
✓ Long & Short | Bidirectional participation in both trending
directions without discretionary overrides
✓ Structured Rules | Entries triggered only on high-conviction
setups; naturally quiet during choppy consolidations
✓ Adaptive Sizing | Position size scales dynamically with account
equity using percentage-based capital allocation
✓ Cost-Aware | Transaction fees and slippage explicitly modeled
for realistic live trading performance
✓ Automated Execution | Bar-level real-time processing ensures
consistent, emotion-free trade management
━━━━━━━━━━━━━━━━━━━━━━━━━━━━━━━━━━━━━━━━━━━━━━━━━━━━━━━━━━
💰 RISK & CAPITAL MANAGEMENT
━━━━━━━━━━━━━━━━━━━━━━━━━━━━━━━━━━━━━━━━━━━━━━━━━━━━━━━━━━
• Fixed-fraction position sizing for compounding growth
• Predefined stop-loss and take-profit constraints
• Account equity-based position scaling
• Realistic fee structure incorporated into P&L
━━━━━━━━━━━━━━━━━━━━━━━━━━━━━━━━━━━━━━━━━━━━━━━━━━━━━━━━━━
🚀 IDEAL FOR
━━━━━━━━━━━━━━━━━━━━━━━━━━━━━━━━━━━━━━━━━━━━━━━━━━━━━━━━━━
→ Medium-term swing participation
→ Backtesting and strategy robustness analysis
→ Quantitative trading systems development
→ Systematic, rules-based execution
╔════════════════════════════════════════════════════════════╗
Built for disciplined, consistent execution
╚════════════════════════════════════════════════════════════╝

Crypto Intraday Strategy by SAIFOverview
A comprehensive intraday trading strategy designed for cryptocurrency markets, combining multiple technical indicators and risk management principles to identify high-probability trading opportunities.
Key Features
Multi-Timeframe Analysis
Utilizes exponential moving averages for trend identification
Incorporates swing structure analysis for support and resistance levels
Applies momentum and trend strength filters
Risk Management
Configurable risk-reward ratios (default 1.6:1)
Maximum risk per trade capped at 3.1% of equity
Dynamic stop-loss placement based on market structure
Position sizing at 2% of equity per trade
Advanced Filters
Trend strength confirmation using ADX indicator
Momentum validation through multiple oscillators
Market correlation analysis for additional confluence
Optional weekend trading filter to avoid low-liquidity periods
Swing Structure Recognition
Automatically identifies key swing highs and lows
Uses pivot points to determine optimal entry zones
Prevents entries too far from established support/resistance
Trade Execution
The strategy employs a one-way trading approach, entering positions only when multiple technical conditions align. Each trade includes pre-defined stop-loss and take-profit levels calculated at entry.
Customization Options
Adjustable swing detection sensitivity
Configurable EMA distance thresholds
Optional correlation filters
Weekend trading toggle
Risk parameters can be modified to suit individual preferences
Important Disclaimers
⚠️ Educational Purpose Only: This strategy is provided for educational and informational purposes. Past performance does not guarantee future results.
⚠️ Risk Warning: Trading cryptocurrencies carries substantial risk of loss. Only trade with capital you can afford to lose.
⚠️ Not Financial Advice: This tool does not constitute financial, investment, or trading advice. Always conduct your own research and consult with qualified financial professionals.
⚠️ Backtesting Limitations: Historical backtesting results may not reflect actual trading conditions due to slippage, execution delays, and changing market dynamics.
Fees & Slippage
Commission: 0.12% per trade
Slippage: 2 ticks accounted for in backtesting
Recommended Usage
Thoroughly backtest on your preferred trading pairs
Start with small position sizes when live trading
Monitor performance across different market conditions
Adjust parameters based on asset volatility and your risk tolerance
